This document discusses climate change and its causes, impacts, and potential solutions. It provides evidence that climate change is occurring due to human greenhouse gas emissions, outlines the various impacts expected across different regions including Asia Pacific and small island states, and explores how information and communication technologies and a transition to renewable energy coupled with energy efficiency can help address climate change. The document aims to demonstrate that ICTs will be crucial to promoting green growth and sustainable development.
![10Relative contribution of GHGs to global warming[1]](https://image.slidesharecdn.com/module10-definitioncausesofclimatechangeimpactonapregion-110408024319-phpapp01/75/Module-10-definition-causes-of-climate-change-impact-on-ap-region-10-2048.jpg)
![12Atmospheric concentrations of carbon dioxide (CO2) - Mauna Loa or Keeling curve[1]Wikipedia. 2010. Mauna Loa Carbon Dioxide-en.svg. Own work, from Image:Mauna Loa Carbon Dioxide.png, uploaded in Commons by Nils Simon under licence GFDL & CC-NC-SA ; itself created by Robert A. Rohde from NOAA published data and is incorporated into the Global Warming Art project.http://en.wikipedia.org/wiki/File:Mauna_Loa_Carbon_Dioxide-en.svg](https://image.slidesharecdn.com/module10-definitioncausesofclimatechangeimpactonapregion-110408024319-phpapp01/75/Module-10-definition-causes-of-climate-change-impact-on-ap-region-12-2048.jpg)
![13Atmospheric concentrations of CO2 January 2011: 391.19 ppm[1]http://www.esrl.noaa.gov/gmd/ccgg/trends/](https://image.slidesharecdn.com/module10-definitioncausesofclimatechangeimpactonapregion-110408024319-phpapp01/75/Module-10-definition-causes-of-climate-change-impact-on-ap-region-13-2048.jpg)
![15Changes in temperature, sea level and Northern Hemisphere snow cover[1][IPCC. 2007. Climate Change 2007: Synthesis Report. Contribution of Working Groups I, II and III to the Fourth Assessment Report of the Intergovernmental Panel on Climate Change. IPCC. Core Writing Team, Pachauri, R.K. and Reisinger, A. (Eds.). IPCC, Geneva, Switzerland. pp 104. http://www.ipcc.ch/publications_and_data/publications_ipcc_fourth_assessment_report_synthesis_report.htm](https://image.slidesharecdn.com/module10-definitioncausesofclimatechangeimpactonapregion-110408024319-phpapp01/75/Module-10-definition-causes-of-climate-change-impact-on-ap-region-15-2048.jpg)
![16Fluctuations in T (red line) and in the atmospheric concentration of CO2 (yellow) over the past 649,000 years[1]US. EPA. 2009. Climate change science. Figure 1: Changes in Carbon Dioxide and Temperature. 8 Sept. 2009. http://www.epa.gov/climatechange/science/pastcc_fig1.html](https://image.slidesharecdn.com/module10-definitioncausesofclimatechangeimpactonapregion-110408024319-phpapp01/75/Module-10-definition-causes-of-climate-change-impact-on-ap-region-16-2048.jpg)
![17Changes in CO2 from ice core and modern data over a period of 10,000 years before the present[1][IPCC. 2007. Climate Change 2007: Synthesis Report. Contribution of Working Groups I, II and III to the Fourth Assessment Report of the Intergovernmental Panel on Climate Change. IPCC. Core Writing Team, Pachauri, R.K. and Reisinger, A. (Eds.). IPCC, Geneva, Switzerland. pp 104. http://www.ipcc.ch/publications_and_data/publications_ipcc_fourth_assessment_report_synthesis_report.htm](https://image.slidesharecdn.com/module10-definitioncausesofclimatechangeimpactonapregion-110408024319-phpapp01/75/Module-10-definition-causes-of-climate-change-impact-on-ap-region-17-2048.jpg)
![18Global and continental temperature change[1][IPCC. 2007. Climate Change 2007: Synthesis Report. Contribution of Working Groups I, II and III to the Fourth Assessment Report of the Intergovernmental Panel on Climate Change. IPCC. Core Writing Team, Pachauri, R.K. and Reisinger, A. (Eds.). IPCC, Geneva, Switzerland. pp 104. http://www.ipcc.ch/publications_and_data/publications_ipcc_fourth_assessment_report_synthesis_report.htm](https://image.slidesharecdn.com/module10-definitioncausesofclimatechangeimpactonapregion-110408024319-phpapp01/75/Module-10-definition-causes-of-climate-change-impact-on-ap-region-18-2048.jpg)
![20Mapping the global variation in CO2 emissions[1]UNDP. 2007. Human Development Report 2007/2008. Fighting climate change: Human solidarity in a divided world. Map. 1.1. UNDP, New York. 399 pp.](https://image.slidesharecdn.com/module10-definitioncausesofclimatechangeimpactonapregion-110408024319-phpapp01/75/Module-10-definition-causes-of-climate-change-impact-on-ap-region-20-2048.jpg)
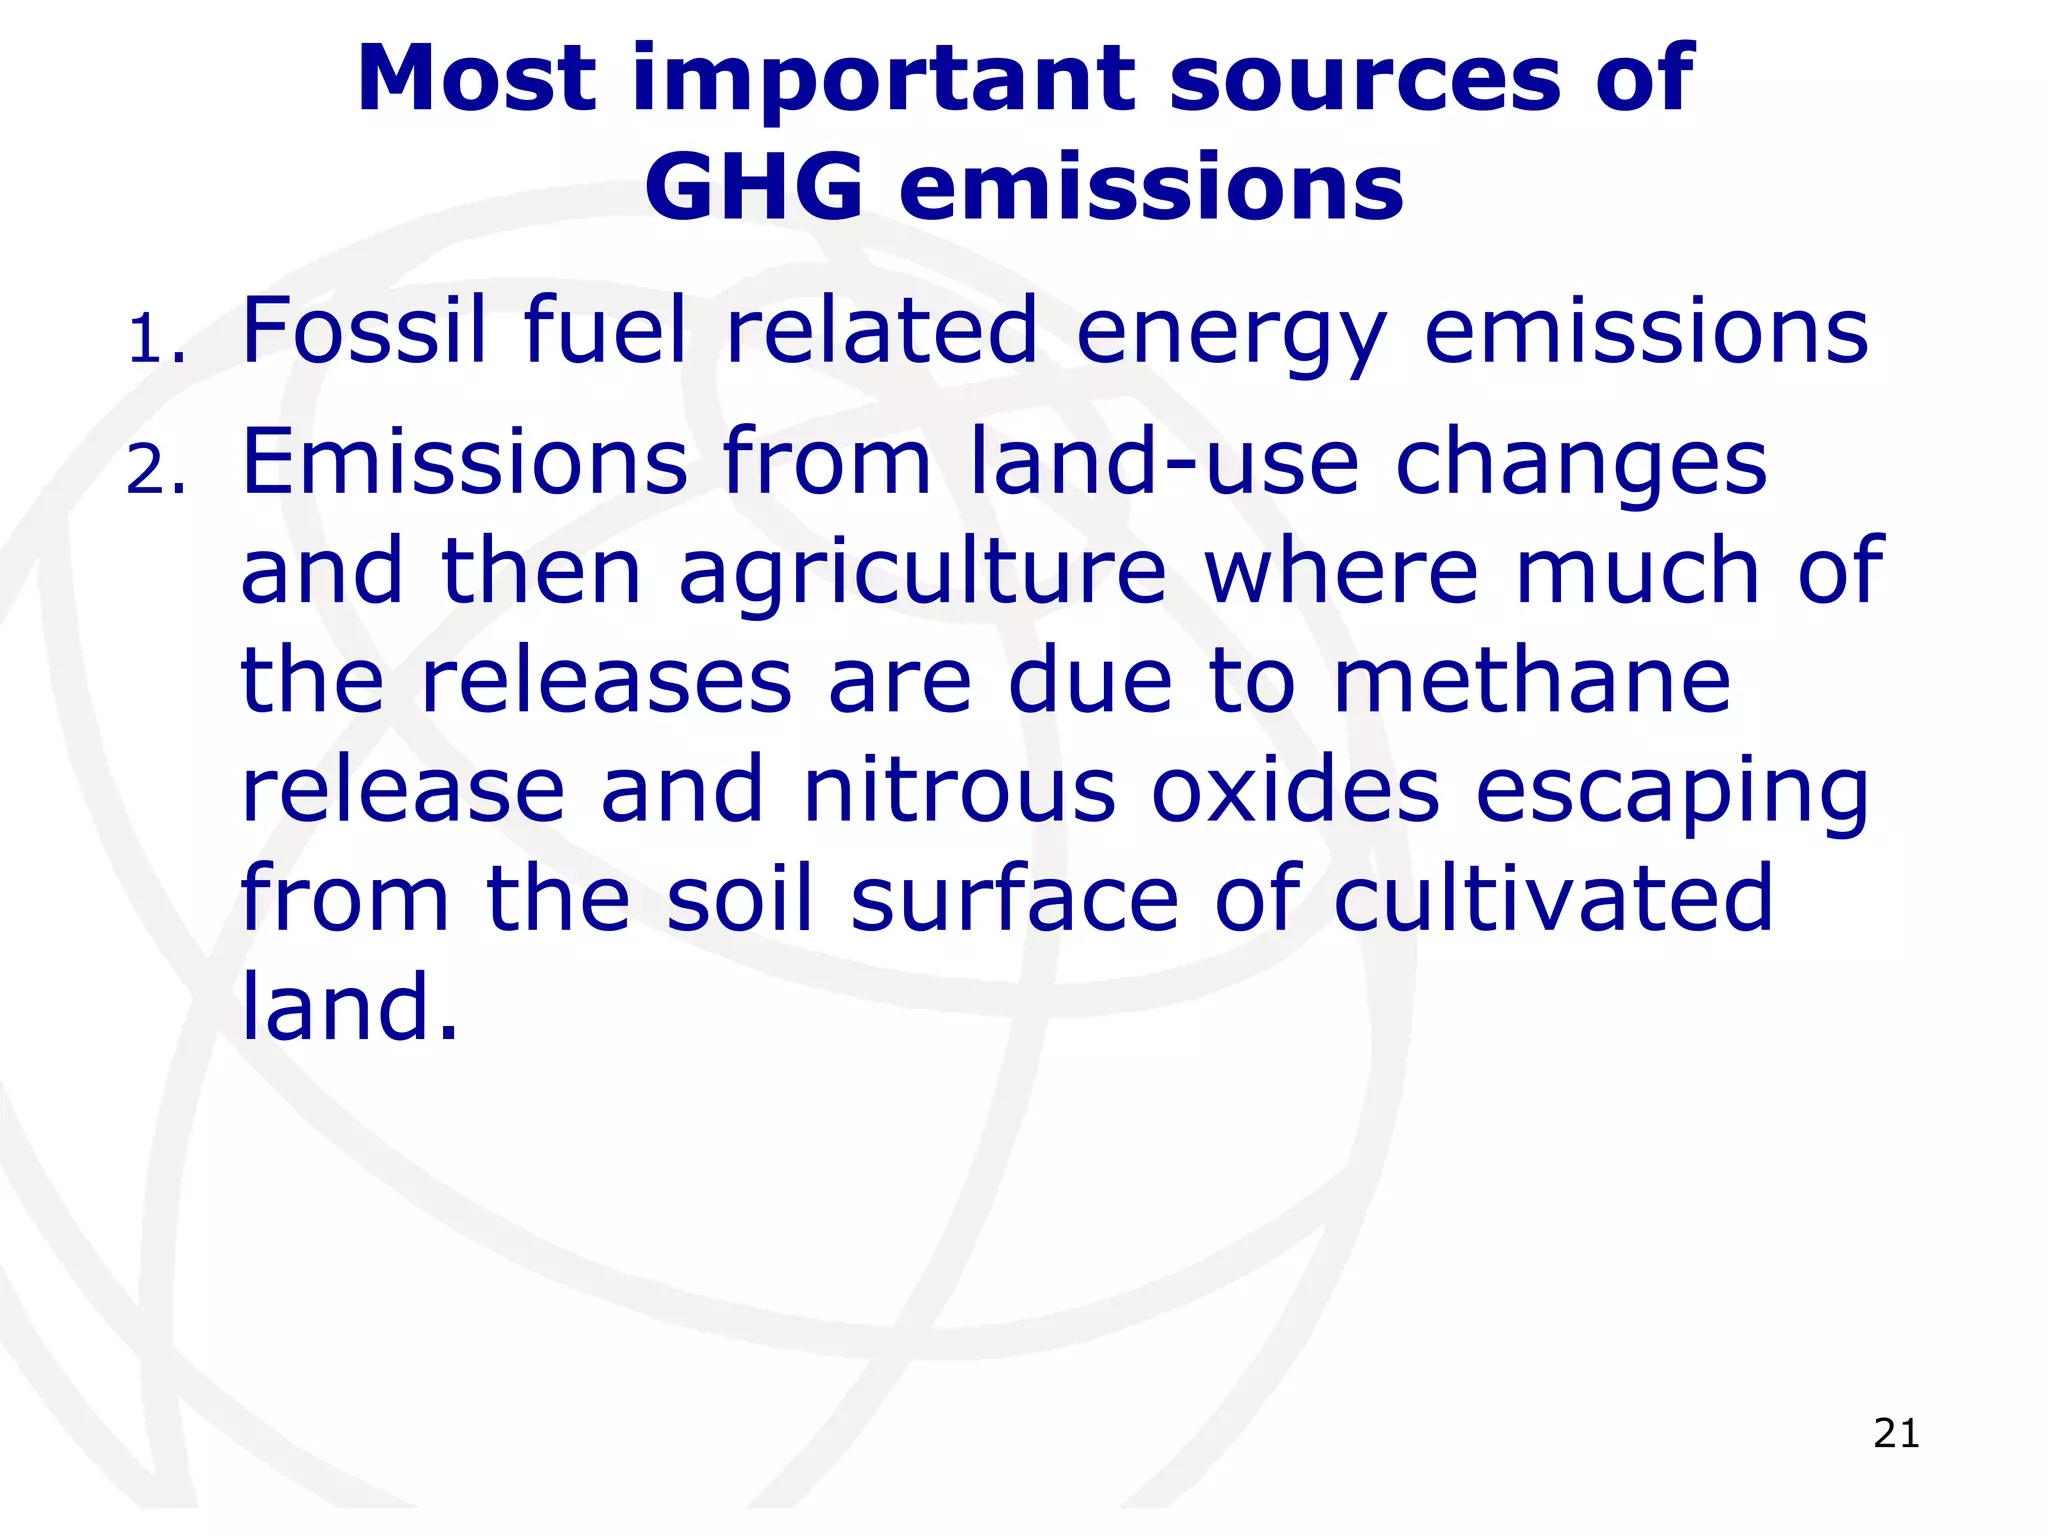
![22Share of different sectors in total anthropogenic GHG emissions in 2004 in terms of CO2-eq. (Forestry includes deforestation)[1]IPCC. 2007. Climate Change 2007: Synthesis Report. Contribution of Working Groups I, II and III to the Fourth Assessment Report of the Intergovernmental Panel on Climate Change. IPCC. Core Writing Team, Pachauri, R.K. and Reisinger, A. (Eds.). IPCC, Geneva, Switzerland. pp 104. http://www.ipcc.ch/publications_and_data/publications_ipcc_fourth_assessment_report_synthesis_report.htm](https://image.slidesharecdn.com/module10-definitioncausesofclimatechangeimpactonapregion-110408024319-phpapp01/75/Module-10-definition-causes-of-climate-change-impact-on-ap-region-22-2048.jpg)
![23[1]World Resources Institute. 2005. Climate Analysis Indicator Tool (CAIT), Navigating the Numbers: Greenhouse Gas Data and International Climate Policy, December 2005. Intergovernmental Panel on Climate Change, 1996 (data for 2000). http://maps.grida.no/go/graphic/world-greenhouse-gas-emissions-by-sector1](https://image.slidesharecdn.com/module10-definitioncausesofclimatechangeimpactonapregion-110408024319-phpapp01/75/Module-10-definition-causes-of-climate-change-impact-on-ap-region-23-2048.jpg)
![25Life Cycle GHG Emissions for Selected Power Generation Technologies[1]IAEA. 2010. Judge Nuclear. IAEA Bulletin51-2, April 2010. Pp. 16.19. http://www.iaea.or.at/OurWork/ST/NE/judge-nuclear.html](https://image.slidesharecdn.com/module10-definitioncausesofclimatechangeimpactonapregion-110408024319-phpapp01/75/Module-10-definition-causes-of-climate-change-impact-on-ap-region-25-2048.jpg)
![26Shares of Non-Fossil Sources in the Electricity Sector and CO2 Intensities for Selected Countries in 2006[1]IAEA. 2010. Judge Nuclear. IAEA Bulletin51-2, April 2010. Pp. 16.19. http://www.iaea.or.at/OurWork/ST/NE/judge-nuclear.htmll](https://image.slidesharecdn.com/module10-definitioncausesofclimatechangeimpactonapregion-110408024319-phpapp01/75/Module-10-definition-causes-of-climate-change-impact-on-ap-region-26-2048.jpg)
![27IPCC Projections of surface warming as a result of increasing GHG emissions[1][IPCC. 2007. Climate Change 2007: Synthesis Report. Contribution of Working Groups I, II and III to the Fourth Assessment Report of the Intergovernmental Panel on Climate Change. IPCC. Core Writing Team, Pachauri, R.K. and Reisinger, A. (Eds.). IPCC, Geneva, Switzerland. pp 104. http://www.ipcc.ch/publications_and_data/publications_ipcc_fourth_assessment_report_synthesis_report.htm](https://image.slidesharecdn.com/module10-definitioncausesofclimatechangeimpactonapregion-110408024319-phpapp01/75/Module-10-definition-causes-of-climate-change-impact-on-ap-region-27-2048.jpg)
![28Fossil fuel emissions: actual vs. IPCC scenarios[1]Global Carbon Project. 2009. Carbon 2008. Budget 08 Released on 17 November 2009. GCP-Global Carbon Budget Consortium. PowerPoint presentation. GCP-Global Carbon Budget Consortium. 38 slides.](https://image.slidesharecdn.com/module10-definitioncausesofclimatechangeimpactonapregion-110408024319-phpapp01/75/Module-10-definition-causes-of-climate-change-impact-on-ap-region-28-2048.jpg)
![33Growth in World primary energy demand to 2035, IEA New Policies Scenario[1]IEA. 2010. World Energy Outlook 2010. N. Tanaka, Executive Director, IEA, Beijing, 17 Nov. 2010. PowerPoint presentation. 35 slides. http://www.energy.eu/publications/weo_2010-China.pdf](https://image.slidesharecdn.com/module10-definitioncausesofclimatechangeimpactonapregion-110408024319-phpapp01/75/Module-10-definition-causes-of-climate-change-impact-on-ap-region-33-2048.jpg)
![36Examples of impacts associated with global average temperature change (Impacts will vary by extent of adaptation, rate of temperature change and socio-economic pathway)[1]IPCC. 2007. Climate Change 2007: Synthesis Report. Contribution of Working Groups I, II and III to the Fourth Assessment Report of the Intergovernmental Panel on Climate Change. IPCC. Core Writing Team, Pachauri, R.K. and Reisinger, A. (Eds.). IPCC, Geneva, Switzerland. pp 104. http://www.ipcc.ch/publications_and_data/publications_ipcc_fourth_assessment_report_synthesis_report.htm](https://image.slidesharecdn.com/module10-definitioncausesofclimatechangeimpactonapregion-110408024319-phpapp01/75/Module-10-definition-causes-of-climate-change-impact-on-ap-region-36-2048.jpg)
![Impacts from increasing GHGs levels in the atmosphere37[1] Stern, N. 2006. Stern Review on the economics of climate change (pre-publication edition). Executive summary. HM Treasury. London. 27 pp. http://www.hm-treasury.gov.uk/sternreview_index.htm](https://image.slidesharecdn.com/module10-definitioncausesofclimatechangeimpactonapregion-110408024319-phpapp01/75/Module-10-definition-causes-of-climate-change-impact-on-ap-region-37-2048.jpg)

![44Predicted global energy use in CMO under 4 different scenarios[1]Crane, H.D., E. M. Kinderman & R. Malhotra. 2010. A cubic mile of oil. Realities and options for averting the looming global energy crisis. Oxford University Press, New York, 297 pp. http://www.oup.com/us/companion.websites/9780195325546/?view=usa](https://image.slidesharecdn.com/module10-definitioncausesofclimatechangeimpactonapregion-110408024319-phpapp01/75/Module-10-definition-causes-of-climate-change-impact-on-ap-region-44-2048.jpg)
![45Proportion of energy expressed in CMO from different primary sources (2006 data)[1]Crane, H.D., E. M. Kinderman & R. Malhotra. 2010. A cubic mile of oil. Realities and options for averting the looming global energy crisis. Oxford University Press, New York, 297 pp. http://www.oup.com/us/companion.websites/9780195325546/?view=usa](https://image.slidesharecdn.com/module10-definitioncausesofclimatechangeimpactonapregion-110408024319-phpapp01/75/Module-10-definition-causes-of-climate-change-impact-on-ap-region-45-2048.jpg)
![46IEA estimate of renewable and other power technology investments for lowest GHG emissions[1][IEA. 2010. Energy Technology Perspectives 2010. Lisbon, 21 October 2010. http://www.renewable.pt/pt/Noticias/Documents/2010_Nobuo_Tanaka.pdf](https://image.slidesharecdn.com/module10-definitioncausesofclimatechangeimpactonapregion-110408024319-phpapp01/75/Module-10-definition-causes-of-climate-change-impact-on-ap-region-46-2048.jpg)
![48The top ten countries leading investment in clean energy technologies [1][Pew Charitable Trusts. 2010. The clean energy economy. China Leads G-20 Members in Clean Energy Finance and Investment. http://www.pewglobalwarming.org/cleanenergyeconomy/pr_24mar2010.html](https://image.slidesharecdn.com/module10-definitioncausesofclimatechangeimpactonapregion-110408024319-phpapp01/75/Module-10-definition-causes-of-climate-change-impact-on-ap-region-48-2048.jpg)
![50The past contribution of energy efficiency[1]Segar, C. 2009. International energy co-operation and global energy security. International Energy Agency (IEA). Session on “Ensuring the sustainability of energy supply chain”, Conference on Strengthening Energy Security in the OSCE area, Bratislava, 6 – 7 July 2009. PowerPoint presentation. http://www.osce.org/documents/eea/2009/07/38666_en.pdf](https://image.slidesharecdn.com/module10-definitioncausesofclimatechangeimpactonapregion-110408024319-phpapp01/75/Module-10-definition-causes-of-climate-change-impact-on-ap-region-50-2048.jpg)
![51Energy efficiency will have major role to play in achieving low C future (IEA)[1]IEA. 2010. World Energy Outlook 2010. N. Tanaka, Executive Director, IEA, Beijing, 17 Nov. 2010. PowerPoint presentation. 35 slides. http://www.energy.eu/publications/weo_2010-China.pdf](https://image.slidesharecdn.com/module10-definitioncausesofclimatechangeimpactonapregion-110408024319-phpapp01/75/Module-10-definition-causes-of-climate-change-impact-on-ap-region-51-2048.jpg)

![55Different measures and technologies will be needed to get the world onto a 2°C path[1][World Bank. 2010. World Development Report. Development and Climate Change. Figure 8. World Bank, Washington, D.C. 439 pp.](https://image.slidesharecdn.com/module10-definitioncausesofclimatechangeimpactonapregion-110408024319-phpapp01/75/Module-10-definition-causes-of-climate-change-impact-on-ap-region-55-2048.jpg)
![56IEA: Key technologies for reducing CO2 emissions under the BLUE Map scenario[1][IEA. 2010. Energy Technology Perspectives 2010. Scenarios & strategies to 2050. Executive Summary. OECD/IEA, Paris, 20 pp. http://www.iea.org/Textbase/npsum/etp2010sum.pdf](https://image.slidesharecdn.com/module10-definitioncausesofclimatechangeimpactonapregion-110408024319-phpapp01/75/Module-10-definition-causes-of-climate-change-impact-on-ap-region-56-2048.jpg)