Download to read offline


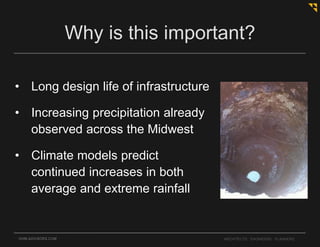

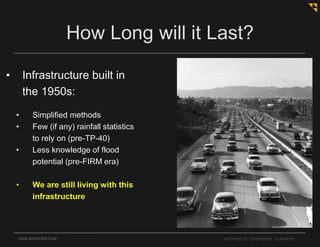
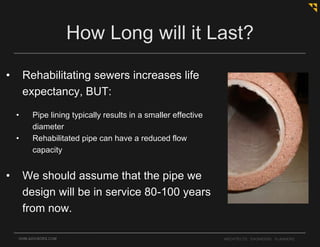

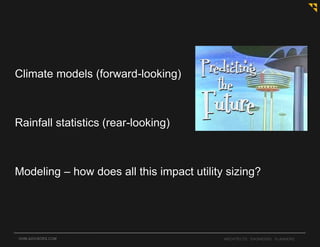
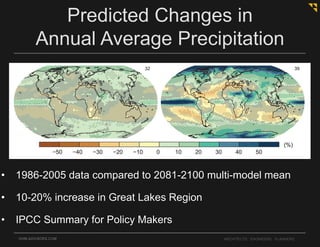
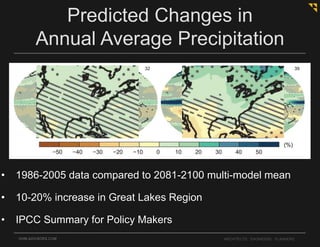


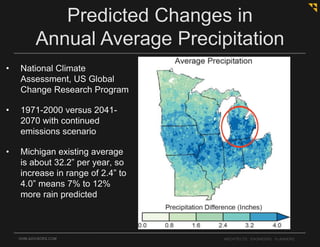
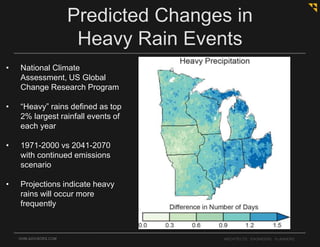

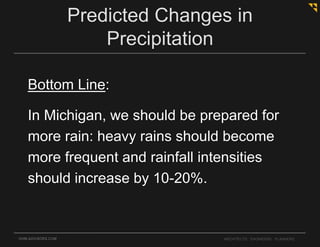
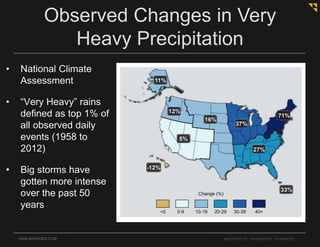
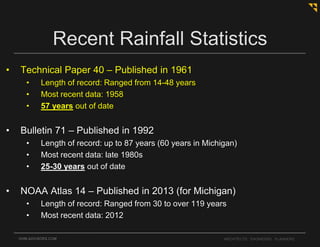
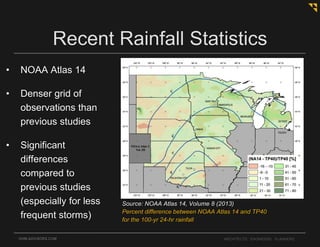
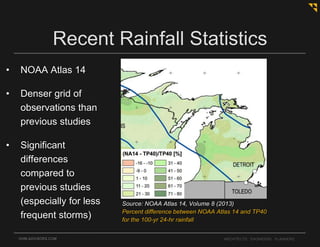
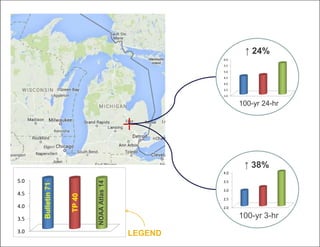
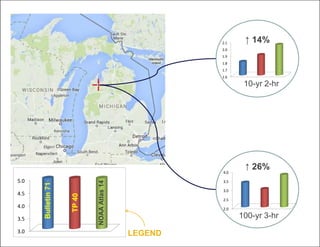
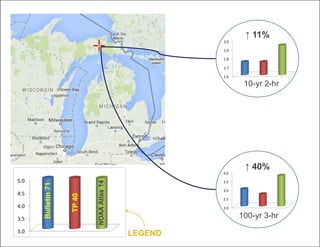
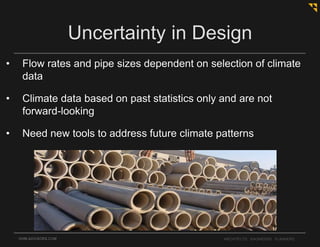
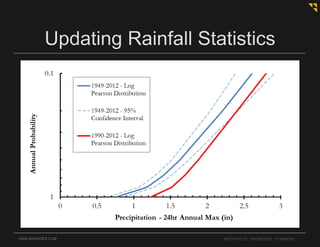
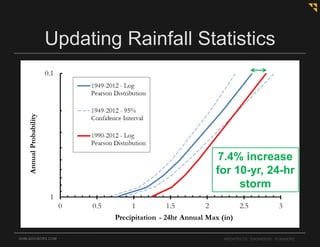

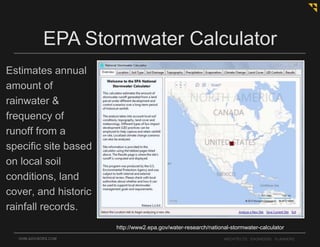
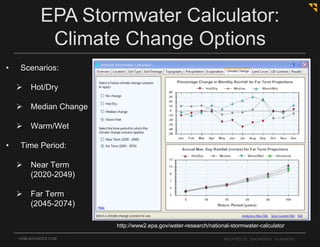
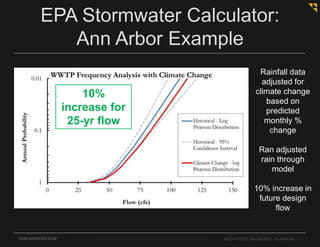
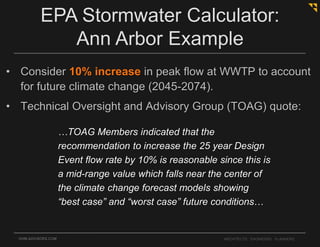

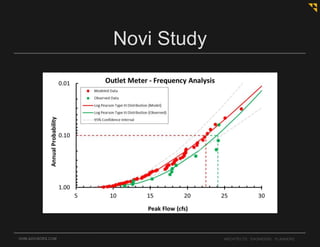
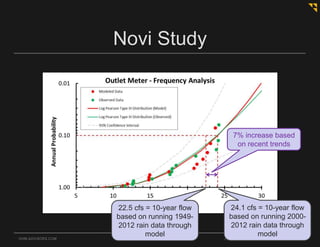
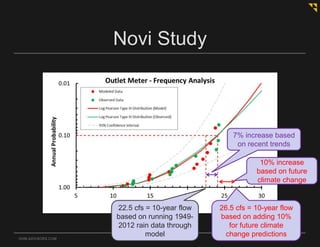
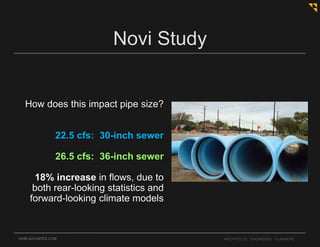
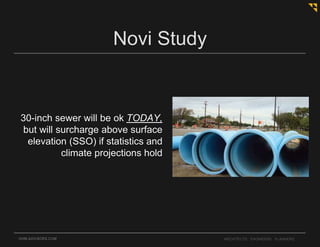
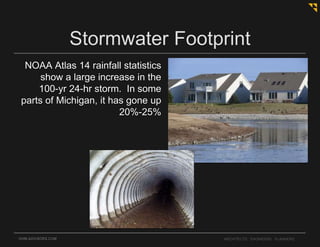


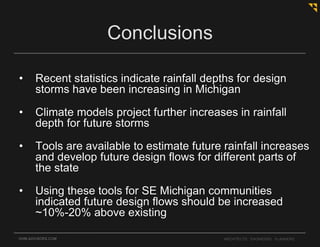
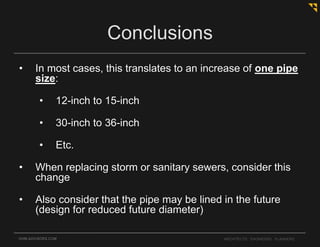

The document discusses the impact of climate change on stormwater and wastewater systems, emphasizing the need to adapt infrastructure due to increased precipitation predicted by climate models. It highlights that existing systems are aging and might not withstand future rainfall patterns, suggesting a 10-20% increase in design flows to accommodate these changes. Various tools and updated rainfall statistics are recommended for utility sizing and planning for future climate conditions.