Download to read offline

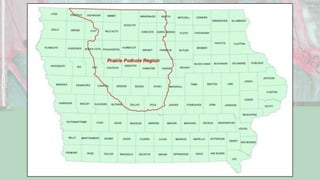
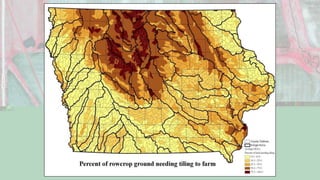
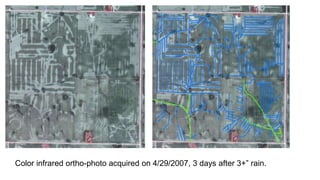
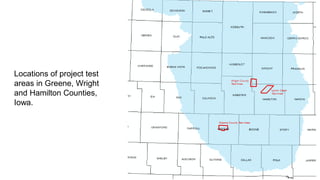
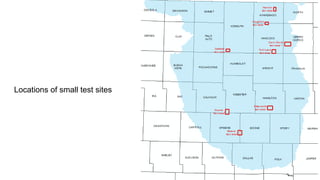
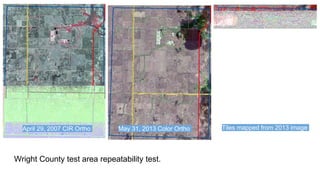
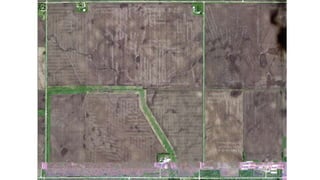
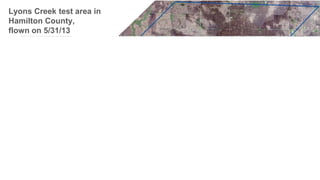
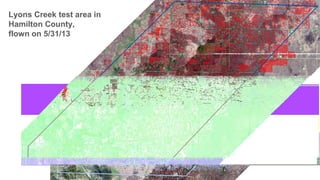
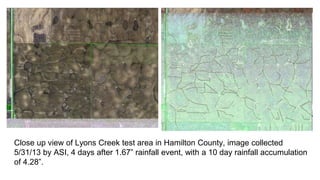
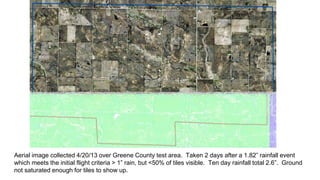
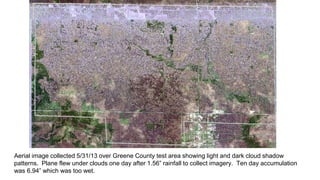
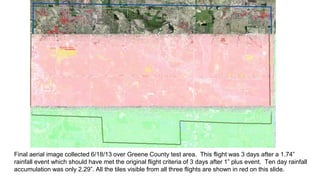
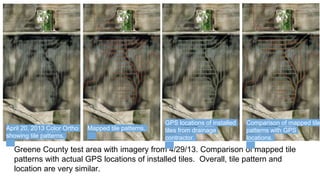
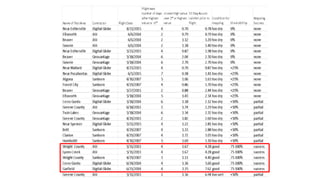
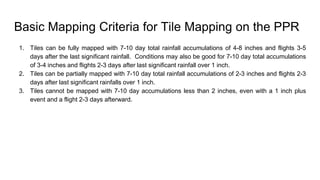
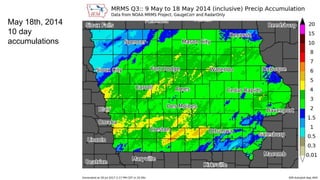
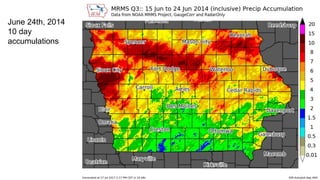
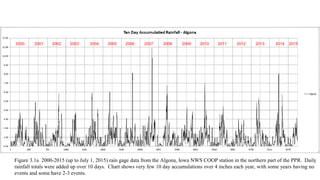
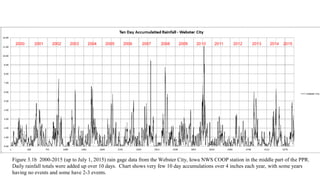
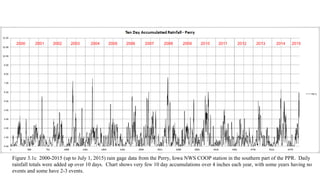
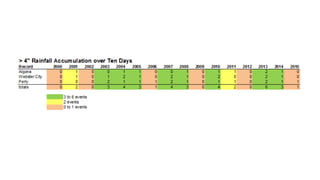


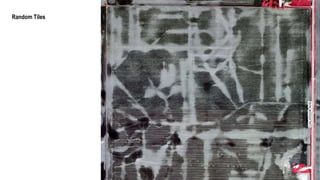
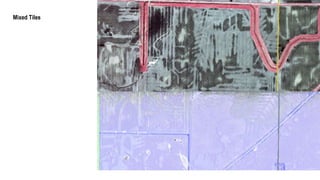
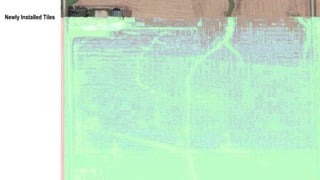
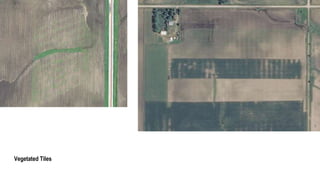

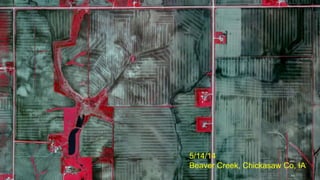


This project tested remote sensing techniques for mapping agricultural drainage tiles in the Prairie Pothole Region of Iowa. Optimal conditions required over 4 inches of rainfall accumulation over 10 days followed by imagery 3-4 days later, when tile drainage effects would be visible. Completely mapping a multi-county area could take 2-5 years due to variability in rainfall patterns and aircraft availability. A photo interpretation guide was created to identify and map tile patterns.


