Download as PDF, PPTX
![CurrentClimate
Futurescenario
City[D=Cityonadelta]
Population in 2005
Exposedpopulation
Exposedassets
Exposedpopulation
Exposedassets
Mumbai,India
18.2
2.8
46
11.4
1598
Guangzhou,China[D]
8.4
2.7
84
10.3
3358
Shanghai,China[D]
14.5
2.4
73
5.5
1771
Miami,USA
5.4
2.0
416
4.8
3513
HoChiMinhCity,Vietnam[D]
5.1
1.9
27
9.2
653
Kolkata,India[D]
14.3
1.9
32
14.0
1961
NewYork-Newark,USA
18.7
1.5
320
2.9
2147
Osaka-Kobe,Japan[D]
11.3
1.4
216
2.0
969
Alexandria,Egypt[D]
3.8
1.3
28
4.4
563
NewOrleans,USA[D]
1.0
1.1
234
1.4
1013
Tokyo,Japan[D]
35.2
1.1
174
2.5
1207
Tianjin,China[D]
7.0
1.0
30
3.8
1231
Bangkok,Thailand[D]
6.6
0.9
39
5.1
1118
Dhaka,Bangladesh[D]
12.4
0.8
8
11.1
544
Amsterdam,Netherlands[D]
1.2
0.8
128
1.4
844
Sea Level Rise: Top 15 world port cities ranked by population exposure under the current climate and future climate scenario.
Population –millions; Exposed Assets: $US billions
Nicholls et al (2008)](https://image.slidesharecdn.com/opening-jamesvoogt-141015104940-conversion-gate01/85/GBF2014-James-Voogt-Climate-Change-Cities-19-320.jpg)
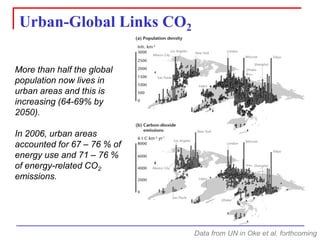
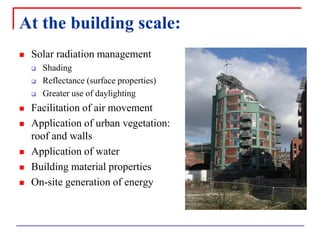
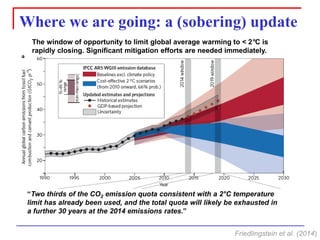
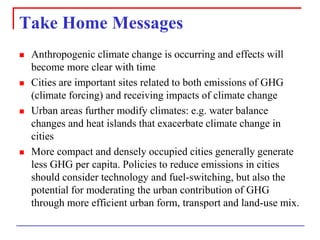
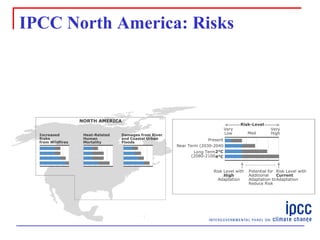
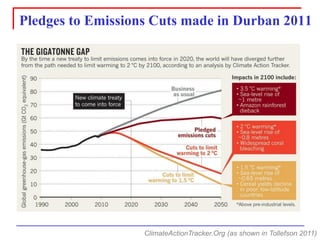
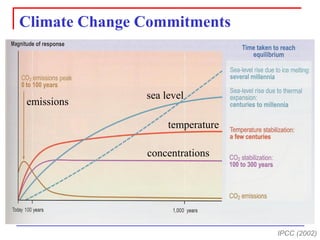
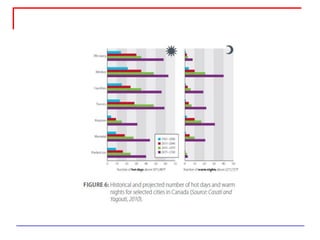
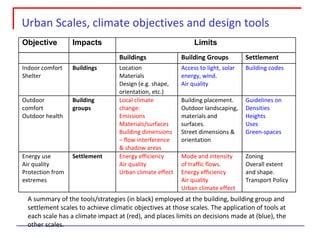

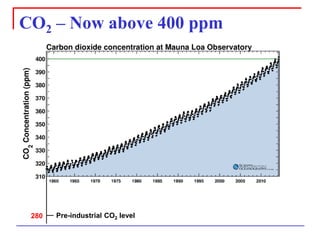
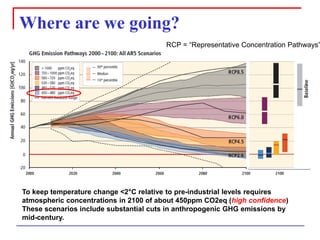
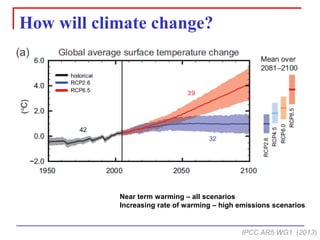
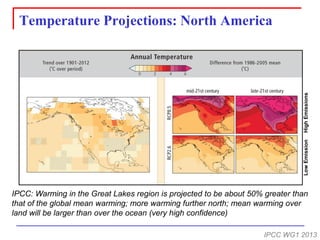
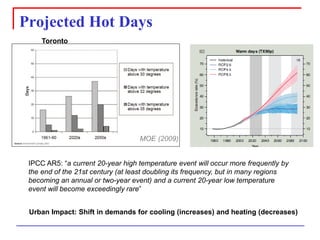
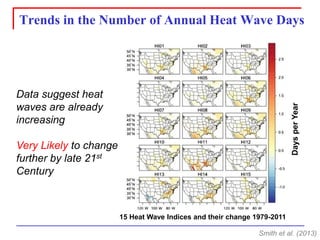
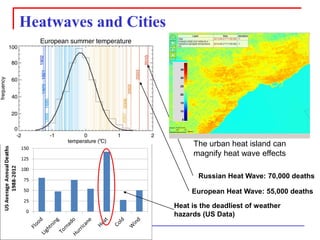
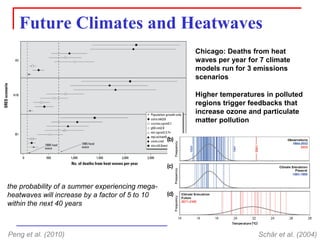
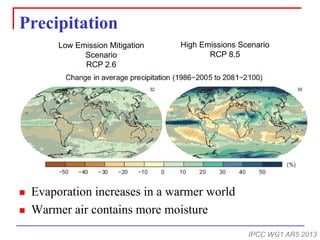
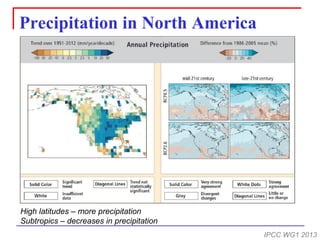
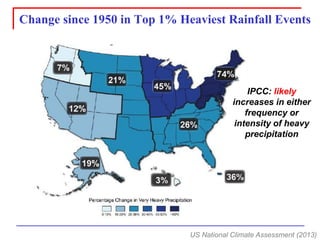
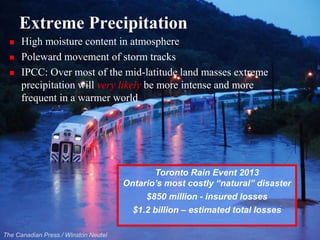
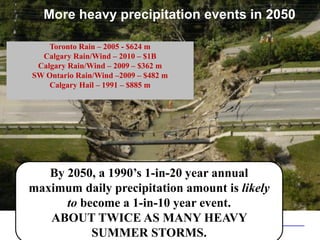
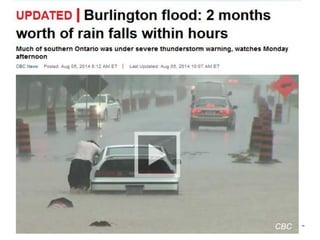
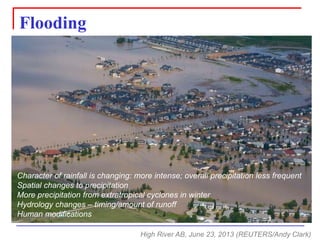
The document discusses how climate change will impact cities through increased temperatures, more extreme precipitation events, and sea level rise. It provides projections for temperature increases and precipitation changes in North America. Cities will experience more heat waves that may be exacerbated by urban heat islands. Coastal cities are particularly at risk from sea level rise. Effective adaptation strategies are needed to reduce risks and increase resilience of cities.


