


![- Hotter, drier summers??
Impacts
- Milder wetter winters
- Reduction in snowfall and frost
- Increased frequency of intense rainfall events
- Decrease groundwater levels
- Increased flooding of low-lying coastal areas
Sea level change (central probability estimate)
Medium emission scenario: 22 cm by 2050
60 High
Medium
Sea level rise (relative 1990) [cm]
50
Low
40
30
20
10
Cardiff % change in flood
0
2000 2010 2020 2030 2040 2050 2060 2070 2080 2090 2095 frequency of 2-year
return period flow](https://image.slidesharecdn.com/walesvickypopedec2012-121214075530-phpapp01/85/Latest-climate-science-implications-for-Wales-13-320.jpg)


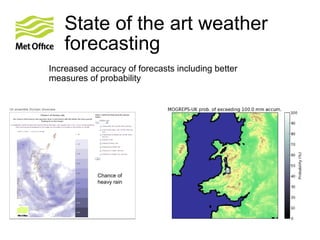
This document discusses the latest climate science and its implications for Wales. It examines what future weather extremes Wales should prepare for, such as increased risk of cold winters and flooding. It explores how climate science can inform future investments through improved weather and climate forecasting from hourly to decadal timescales. It also considers how resilient Wales' assets are to climate change impacts like hotter summers and rising sea levels. The document proposes partnerships to further climate research using high-resolution regional climate models for Wales.


