Downloaded 11 times


![I Also Had an Increased Risk for Ulcerative Colitis,
But a SNP that is Also Associated with Colonic CD
I Have a
33% Increased Risk
for Ulcerative Colitis
HLA-DRA (rs2395185)
I Have the Same Level
of HLA-DRA Increased Risk
as Another Male Who Has Had
Ulcerative Colitis for 20 Years
“Our results suggest that at least for the SNPs investigated
[including HLA-DRA],
colonic CD and UC have common genetic basis.”
-Waterman, et al., IBD 17, 1936-42 (2011)](https://image.slidesharecdn.com/bioengineeringucsdfeb2016-160331182041/85/Supercomputing-Your-Inner-Microbiome-25-320.jpg)

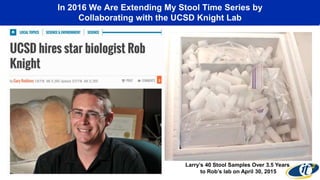
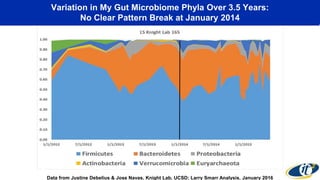
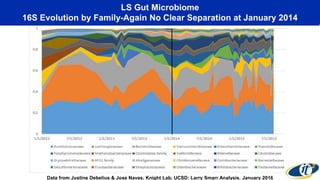
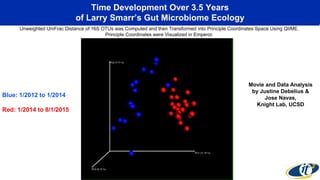
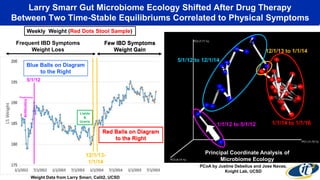


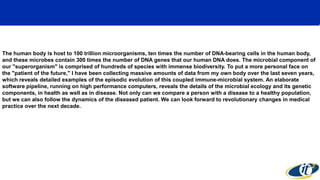
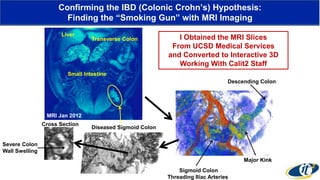
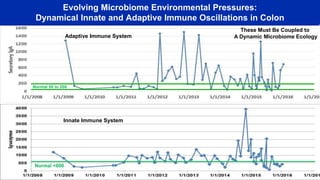
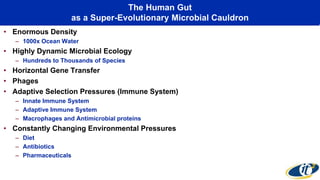
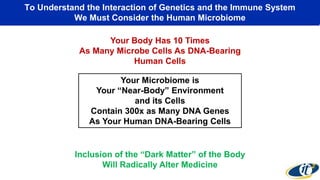
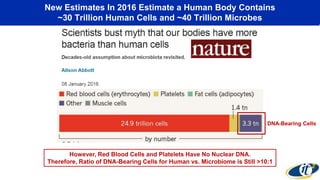
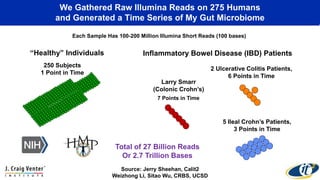
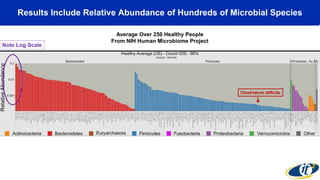
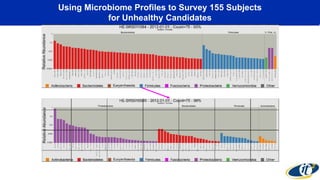
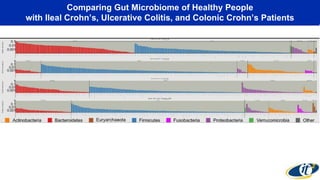
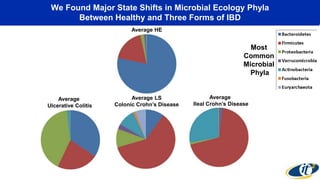
The document summarizes a seminar given by Dr. Larry Smarr on supercomputing the human microbiome. Some key points: - The human microbiome contains 100 trillion microorganisms and their DNA contains 300 times as many genes as human DNA. - Dr. Smarr has been collecting extensive data from his own body over 7 years to study his personal microbiome and immune system interactions using high performance computing. - Analyzing microbiome data requires massive computing resources, such as millions of core hours on supercomputers. This reveals details of microbial ecology and genetics in health and disease. - Computational analysis of microbiome sequencing data from many subjects shows major shifts in microbial populations between healthy and


