Download to read offline
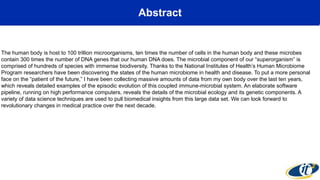
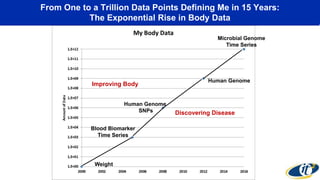
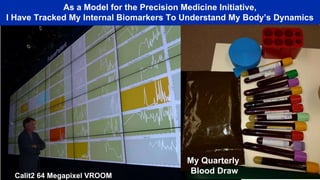
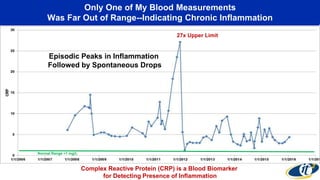
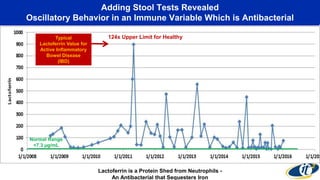
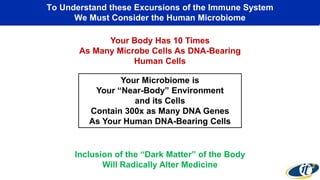
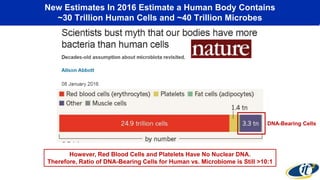
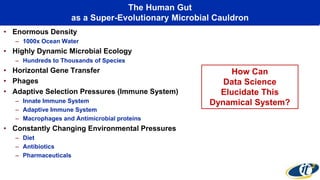
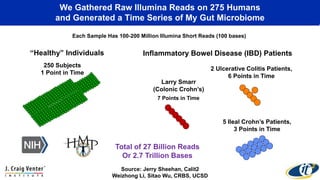
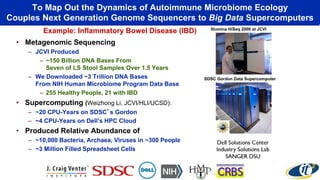
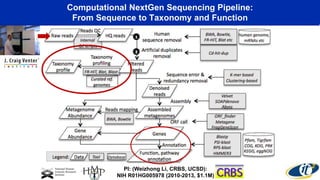
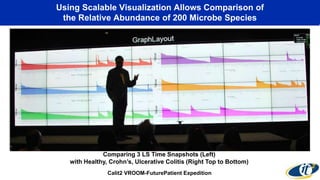
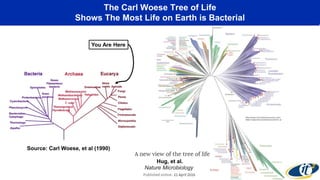
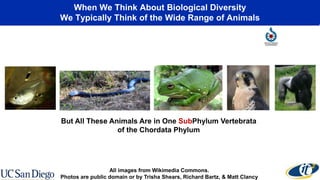

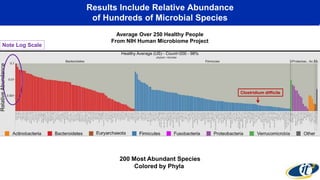
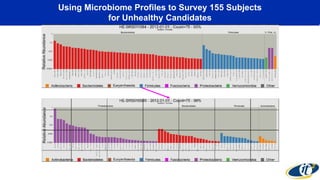
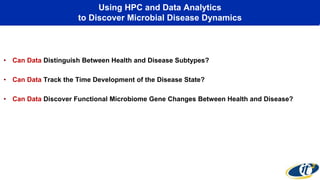
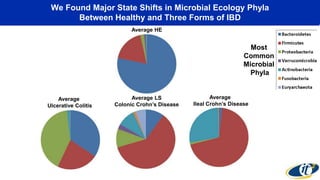
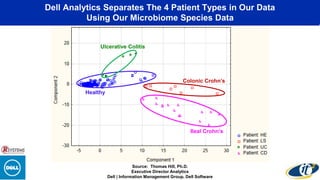
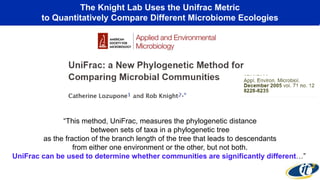


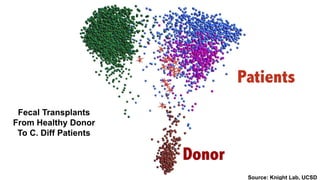
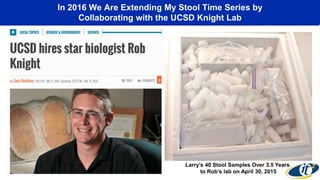
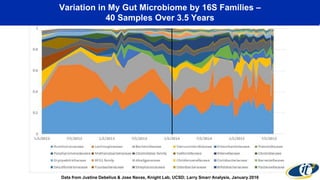
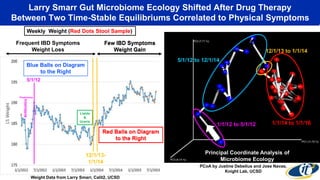
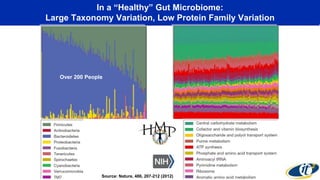
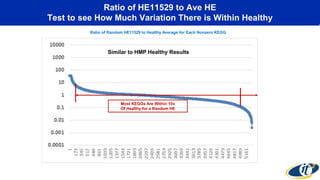


The document discusses the extensive microbial ecosystem within the human body, emphasizing its complexity and potential impact on health and disease, particularly through the lens of Dr. Larry Smarr's personal microbiome research. It details methods employed for analyzing this ecosystem using supercomputers and advanced data science techniques, which allow for tracking changes in gut microbiota and their correlation with conditions such as inflammatory bowel disease. The research aims to define precise microbial profiles that could revolutionize medical practices and enhance our understanding of individual health dynamics.


