Downloaded 10 times
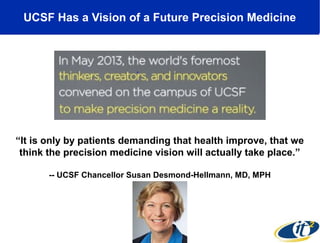

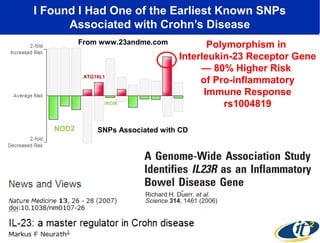
![I Also Had an Increased Risk for Ulcerative Colitis,
But a SNP that is Also Associated with Colonic CD
I Have a
33% Increased Risk
for Ulcerative Colitis
HLA-DRA (rs2395185)
I Have the Same Level
of HLA-DRA Increased Risk
as Another Male Who Has Had
Ulcerative Colitis for 20 Years
“Our results suggest that at least for the SNPs investigated
[including HLA-DRA],
colonic CD and UC have common genetic basis.”
-Waterman, et al., IBD 17, 1936-42 (2011)](https://image.slidesharecdn.com/ucsfdec2013-131204152230-phpapp01/85/Quantifying-the-Time-Progression-of-a-Human-Autoimmune-Disease-using-Genome-Sequencing-and-Supercomputers-18-320.jpg)
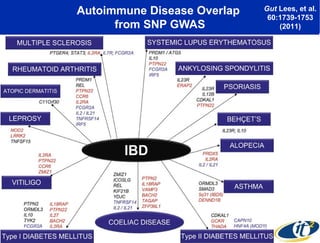


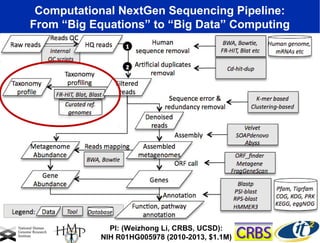


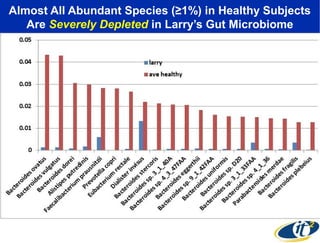
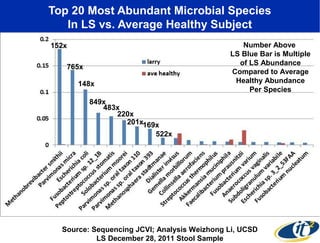
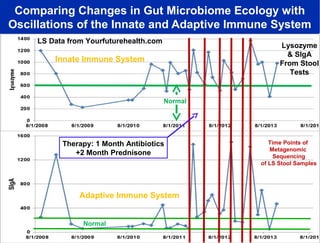
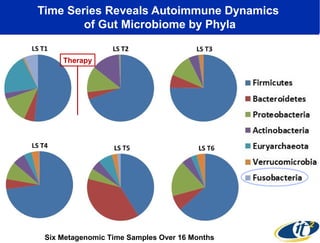
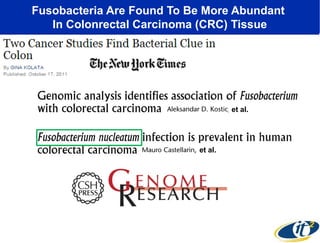
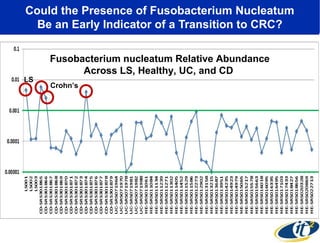
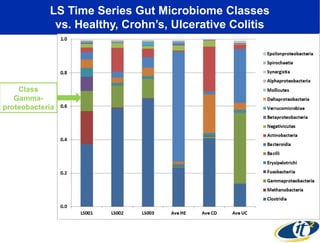
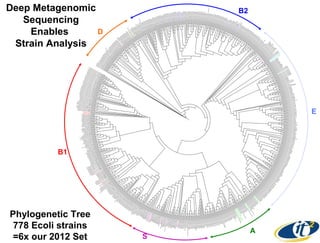
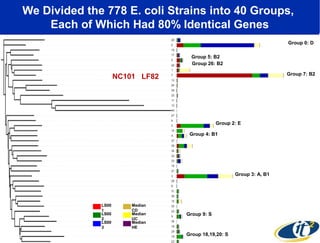
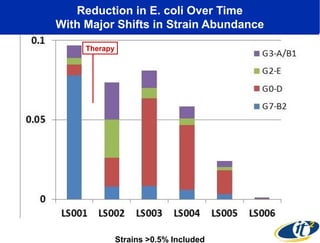
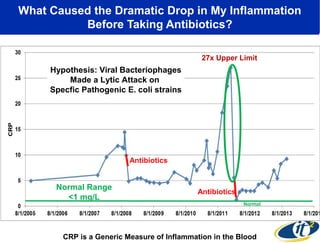
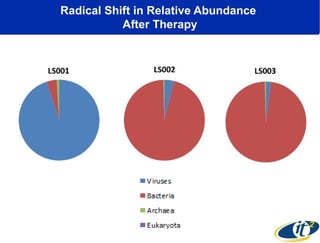


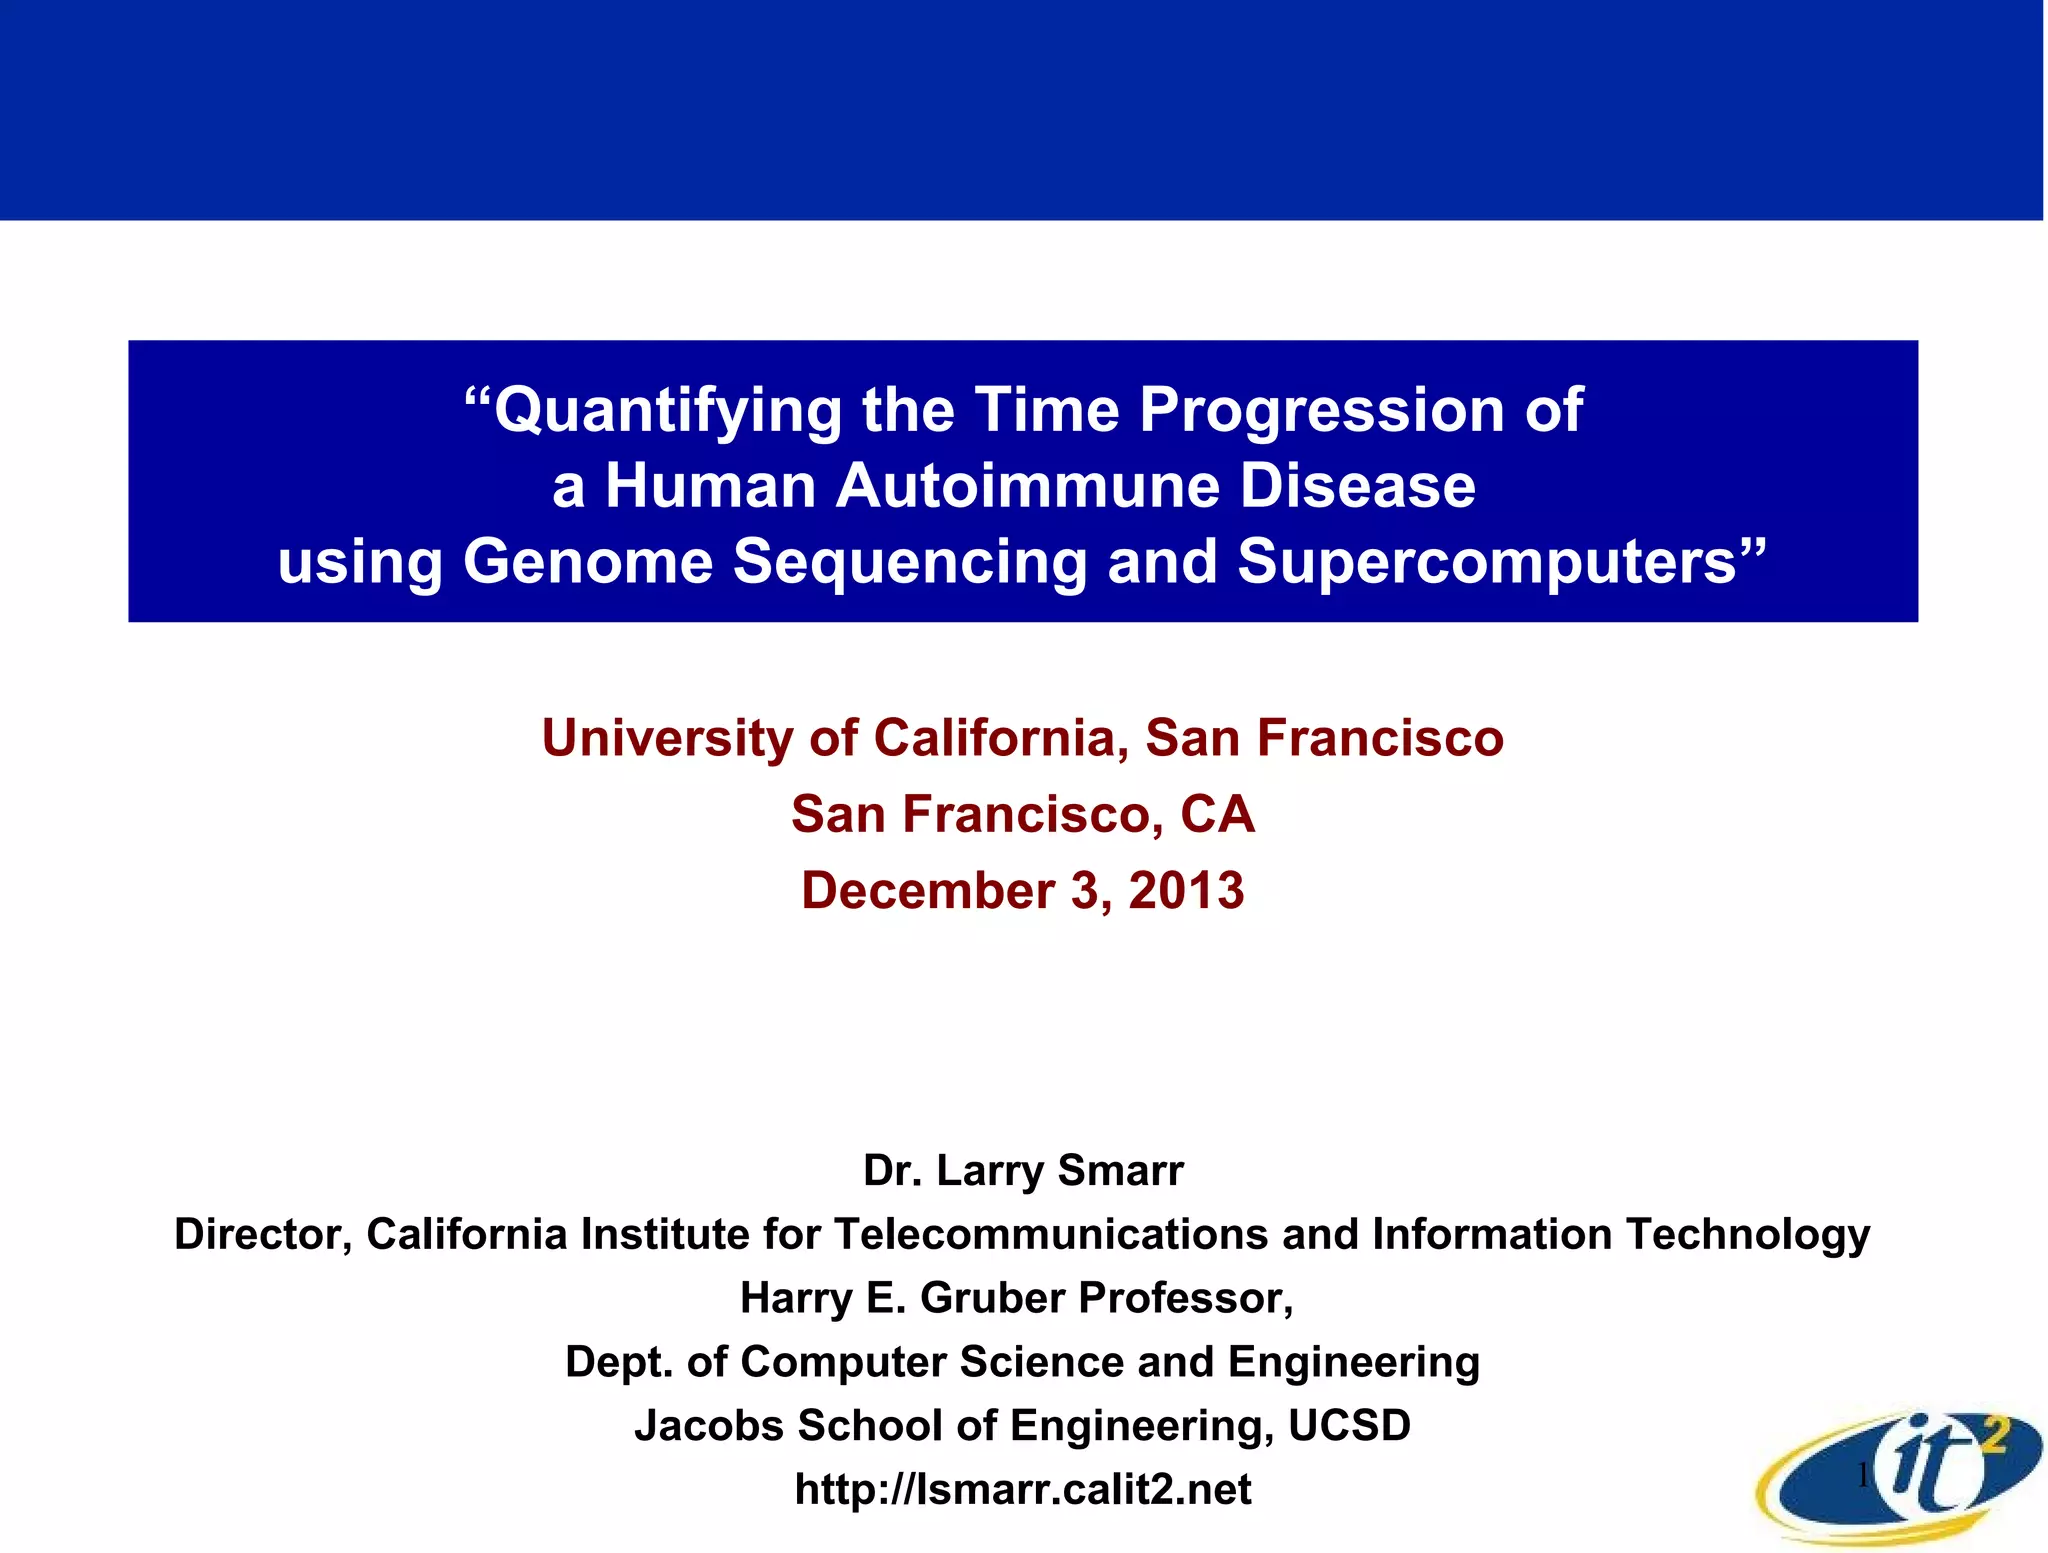
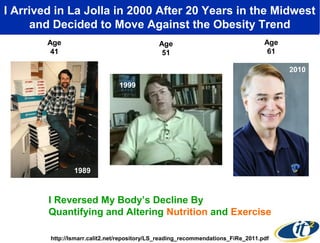
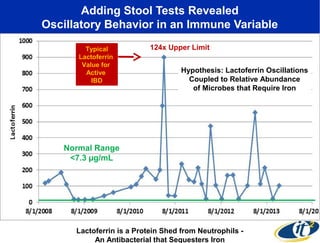
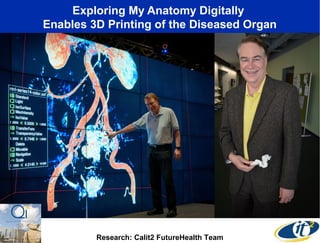
Larry Smarr has been collecting extensive data on his own health for over 5 years to study his diagnosis of Crohn's disease. Analysis of this data using genome sequencing and supercomputers has demonstrated the episodic evolution of his coupled immune-microbial system. High resolution metagenomic sequencing at JCVI and computational analysis with several CPU-decades of supercomputer time at SDSC has revealed the complex time-varying dynamics of Smarr's microbial ecology, shedding light on the autoimmune disease process. Comparisons to data from healthy individuals and those with IBD from the NIH Human Microbiome Project provide insights into how inflammation can alter the gut microbiome.


![PERI-PROSTHETIC FRACTURE NAIL-PLATE CONSTRUCT [NPC].pptx](https://cdn.slidesharecdn.com/ss_thumbnails/drarunkumardrmohamedashrafperiprostheticfrasturenail-plateconstructnpc-260209164459-7e9d15a1-thumbnail.jpg?width=640&height=640&fit=bounds)


