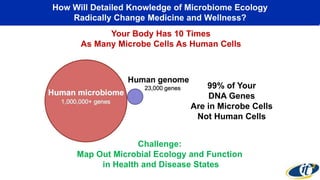
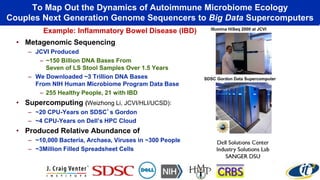
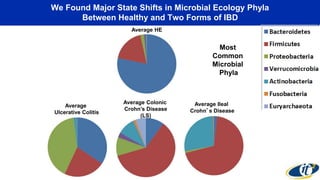
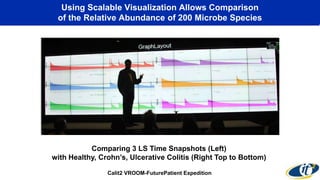
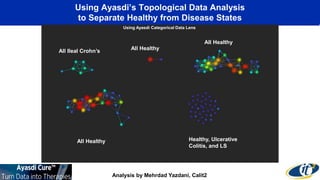
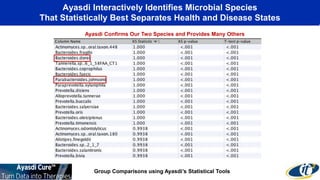
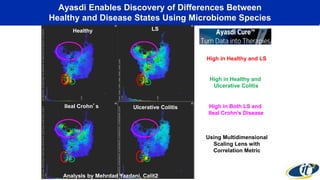
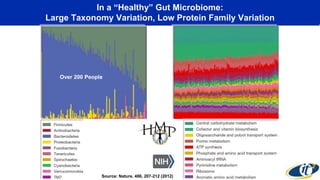
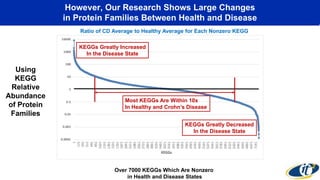
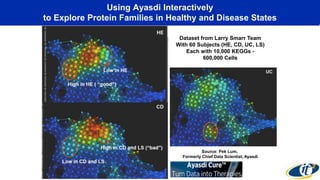
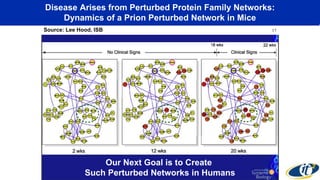
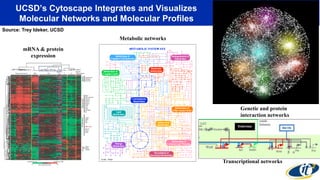
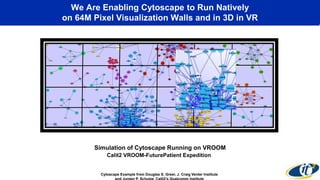
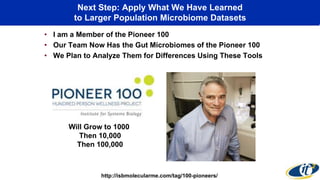
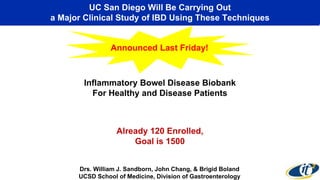
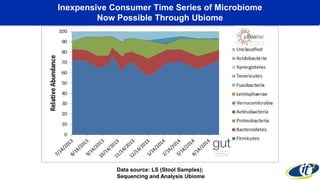
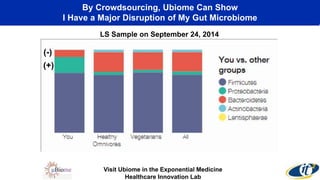
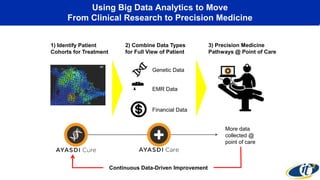
“Finding the Patterns in 
the Big Data From Human Microbiome Ecology” 
Invited Talk 
Exponential Medicine 
November 10, 2014 
Dr. Larry Smarr 
Director, California Institute for Telecommunications and Information Technology 
Harry E. Gruber Professor, 
Dept. of Computer Science and Engineering 
Jacobs School of Engineering, UCSD 
http://lsmarr.calit2.net 
1
How Will Detailed Knowledge of Microbiome Ecology 
Radically Change Medicine and Wellness? 
Your Body Has 10 Times 
As Many Microbe Cells As Human Cells 
99% of Your 
DNA Genes 
Are in Microbe Cells 
Not Human Cells 
Challenge: 
Map Out Microbial Ecology and Function 
in Health and Disease States
To Map Out the Dynamics of Autoimmune Microbiome Ecology 
Couples Next Generation Genome Sequencers to Big Data Supercomputers 
• Metagenomic Sequencing 
– JCVI Produced 
– ~150 Billion DNA Bases From 
Seven of LS Stool Samples Over 1.5 Years 
– We Downloaded ~3 Trillion DNA Bases 
From NIH Human Microbiome Program Data Base 
– 255 Healthy People, 21 with IBD 
• Supercomputing (Weizhong Li, JCVI/HLI/UCSD): 
– ~20 CPU-Years on SDSC’s Gordon 
– ~4 CPU-Years on Dell’s HPC Cloud 
• Produced Relative Abundance of 
– ~10,000 Bacteria, Archaea, Viruses in ~300 People 
– ~3Million Filled Spreadsheet Cells 
Illumina HiSeq 2000 at JCVI 
SDSC Gordon Data Supercomputer 
Example: Inflammatory Bowel Disease (IBD)
How Best to Analyze The Microbiome Datasets 
to Discover Patterns in Health and Disease? 
Can We Find New Noninvasive Diagnostics 
In Microbiome Ecologies?
When We Think About Biological Diversity 
We Typically Think of the Wide Range of Animals 
But All These Animals Are in 
One SubPhylum Vertebrata 
of the Chordata Phylum 
All images from Wikimedia Commons. 
Photos are public domain or by Trisha Shears & Richard Bartz
But You Need to Think of All These Phyla of Animals 
When You Consider the Biodiversity of Microbes Inside You 
Phylum 
Annelida 
All images from WikiMedia Commons. 
Phylum 
Echinodermata 
Photos are public domain or by Dan Hershman, Michael Linnenbach, Manuae, B_cool 
Phylum 
Cnidaria 
Phylum 
Mollusca 
Phylum 
Arthropoda 
Phylum 
Chordata
We Found Major State Shifts in Microbial Ecology Phyla 
Between Healthy and Two Forms of IBD 
Most 
Common 
Microbial 
Phyla 
Average HE 
Average 
Ulcerative Colitis 
Average Colonic 
Crohn’s Disease 
(LS) 
Average Ileal 
Crohn’s Disease
Using Scalable Visualization Allows Comparison 
of the Relative Abundance of 200 Microbe Species 
Comparing 3 LS Time Snapshots (Left) 
with Healthy, Crohn’s, Ulcerative Colitis (Right Top to Bottom) 
Calit2 VROOM-FuturePatient Expedition
Our Scalable Visualization Analysis Found That 
Some Species Can Differentiate IBD vs. Healthy Subjects 
Each Bar is a Person
Using Ayasdi Advanced Analytics 
to Interactively Discover Hidden Patterns in Our Data 
topological data analysis 
Visit Ayasdi in the Exponential Medicine 
Healthcare Innovation Lab
Using Ayasdi’s Topological Data Analysis 
to Separate Healthy from Disease States 
All Healthy 
All Healthy 
All Ileal Crohn’s 
Using Ayasdi Categorical Data Lens 
Healthy, Ulcerative 
Colitis, and LS 
All Healthy 
Analysis by Mehrdad Yazdani, Calit2
Ayasdi Interactively Identifies Microbial Species 
That Statistically Best Separates Health and Disease States 
Ayasdi Confirms Our Two Species and Provides Many Others 
Group Comparisons using Ayasdi’s Statistical Tools
Ayasdi Enables Discovery of Differences Between 
Healthy and Disease States Using Microbiome Species 
Healthy LS 
Ileal Crohn’s Ulcerative Colitis 
High in Healthy and LS 
High in Healthy and 
Ulcerative Colitis 
High in Both LS and 
Ileal Crohn’s Disease 
Using Multidimensional 
Scaling Lens with 
Correlation Metric 
Analysis by Mehrdad Yazdani, Calit2
In a “Healthy” Gut Microbiome: 
Large Taxonomy Variation, Low Protein Family Variation 
Over 200 People 
Source: Nature, 486, 207-212 (2012)
However, Our Research Shows Large Changes 
in Protein Families Between Health and Disease 
Ratio of CD Average to Healthy Average for Each Nonzero KEGG 
KEGGs Greatly Increased 
In the Disease State 
Most KEGGs Are Within 10x 
In Healthy and Crohn’s Disease 
KEGGs Greatly Decreased 
In the Disease State 
Over 7000 KEGGs Which Are Nonzero 
in Health and Disease States 
Using 
KEGG 
Relative 
Abundance 
of Protein 
Families
Using Ayasdi Interactively 
to Explore Protein Families in Healthy and Disease States 
Dataset from Larry Smarr Team 
With 60 Subjects (HE, CD, UC, LS) 
Each with 10,000 KEGGs - 
600,000 Cells 
Source: Pek Lum, 
Formerly Chief Data Scientist, Ayasdi
Disease Arises from Perturbed Protein Family Networks: 
Dynamics of a Prion Perturbed Network in Mice 
Source: Lee Hood, ISB 17 
Our Next Goal is to Create 
Such Perturbed Networks in Humans
Genetic and protein 
interaction networks 
Transcriptional networks 
UCSD’s Cytoscape Integrates and Visualizes 
Molecular Networks and Molecular Profiles 
Metabolic networks 
Source: Trey Ideker, UCSD 
mRNA & protein 
expression
We Are Enabling Cytoscape to Run Natively 
on 64M Pixel Visualization Walls and in 3D in VR 
Simulation of Cytoscape Running on VROOM 
Calit2 VROOM-FuturePatient Expedition 
Cytoscape Example from Douglas S. Greer, J. Craig Venter Institute 
and Jurgen P. Schulze, Calit2’s Qualcomm Institute
Next Step: Apply What We Have Learned 
to Larger Population Microbiome Datasets 
• I am a Member of the Pioneer 100 
• Our Team Now Has the Gut Microbiomes of the Pioneer 100 
• We Plan to Analyze Them for Differences Using These Tools 
Will Grow to 1000 
Then 10,000 
Then 100,000 
http://isbmolecularme.com/tag/100-pioneers/
UC San Diego Will Be Carrying Out 
a Major Clinical Study of IBD Using These Techniques 
Announced Last Friday! 
Inflammatory Bowel Disease Biobank 
For Healthy and Disease Patients 
Already 120 Enrolled, 
Goal is 1500 
Drs. William J. Sandborn, John Chang, & Brigid Boland 
UCSD School of Medicine, Division of Gastroenterology
Inexpensive Consumer Time Series of Microbiome 
Now Possible Through Ubiome 
Data source: LS (Stool Samples); 
Sequencing and Analysis Ubiome
By Crowdsourcing, Ubiome Can Show 
I Have a Major Disruption of My Gut Microbiome 
(-) 
(+) 
LS Sample on September 24, 2014 
Visit Ubiome in the Exponential Medicine 
Healthcare Innovation Lab
Using Big Data Analytics to Move 
From Clinical Research to Precision Medicine 
1) Identify Patient 
Cohorts for Treatment 
2) Combine Data Types 
for Full View of Patient 
Genetic Data 
EMR Data 
Financial Data 
3) Precision Medicine 
Pathways @ Point of Care 
More data 
collected @ 
point of care 
Continuous Data-Driven Improvement
Thanks to Our Great Team! 
UCSD Metagenomics Team 
Weizhong Li 
Sitao Wu 
Calit2@UCSD 
Future Patient Team 
Jerry Sheehan 
Tom DeFanti 
Kevin Patrick 
Jurgen Schulze 
Andrew Prudhomme 
Philip Weber 
Fred Raab 
Joe Keefe 
Ernesto Ramirez 
Ayasdi 
Devi 
Sanjnan 
Pek 
JCVI Team 
Karen Nelson 
Shibu Yooseph 
Manolito Torralba 
SDSC Team 
Michael Norman 
Mahidhar Tatineni 
Robert Sinkovits 
UCSD Health Sciences Team 
William J. Sandborn 
Elisabeth Evans 
John Chang 
Brigid Boland 
David Brenner
This Talk Builds on My Two Prior Future Med Presentations 
Download Them From: 
http://lsmarr.calit2.net/presentations?slideshow=28247009 
http://lsmarr.calit2.net/presentations?slideshow=16384993

Finding the Patterns in the Big Data From Human Microbiome Ecology

  • 1.
    “Finding the Patternsin the Big Data From Human Microbiome Ecology” Invited Talk Exponential Medicine November 10, 2014 Dr. Larry Smarr Director, California Institute for Telecommunications and Information Technology Harry E. Gruber Professor, Dept. of Computer Science and Engineering Jacobs School of Engineering, UCSD http://lsmarr.calit2.net 1
  • 2.
    How Will DetailedKnowledge of Microbiome Ecology Radically Change Medicine and Wellness? Your Body Has 10 Times As Many Microbe Cells As Human Cells 99% of Your DNA Genes Are in Microbe Cells Not Human Cells Challenge: Map Out Microbial Ecology and Function in Health and Disease States
  • 3.
    To Map Outthe Dynamics of Autoimmune Microbiome Ecology Couples Next Generation Genome Sequencers to Big Data Supercomputers • Metagenomic Sequencing – JCVI Produced – ~150 Billion DNA Bases From Seven of LS Stool Samples Over 1.5 Years – We Downloaded ~3 Trillion DNA Bases From NIH Human Microbiome Program Data Base – 255 Healthy People, 21 with IBD • Supercomputing (Weizhong Li, JCVI/HLI/UCSD): – ~20 CPU-Years on SDSC’s Gordon – ~4 CPU-Years on Dell’s HPC Cloud • Produced Relative Abundance of – ~10,000 Bacteria, Archaea, Viruses in ~300 People – ~3Million Filled Spreadsheet Cells Illumina HiSeq 2000 at JCVI SDSC Gordon Data Supercomputer Example: Inflammatory Bowel Disease (IBD)
  • 4.
    How Best toAnalyze The Microbiome Datasets to Discover Patterns in Health and Disease? Can We Find New Noninvasive Diagnostics In Microbiome Ecologies?
  • 5.
    When We ThinkAbout Biological Diversity We Typically Think of the Wide Range of Animals But All These Animals Are in One SubPhylum Vertebrata of the Chordata Phylum All images from Wikimedia Commons. Photos are public domain or by Trisha Shears & Richard Bartz
  • 6.
    But You Needto Think of All These Phyla of Animals When You Consider the Biodiversity of Microbes Inside You Phylum Annelida All images from WikiMedia Commons. Phylum Echinodermata Photos are public domain or by Dan Hershman, Michael Linnenbach, Manuae, B_cool Phylum Cnidaria Phylum Mollusca Phylum Arthropoda Phylum Chordata
  • 7.
    We Found MajorState Shifts in Microbial Ecology Phyla Between Healthy and Two Forms of IBD Most Common Microbial Phyla Average HE Average Ulcerative Colitis Average Colonic Crohn’s Disease (LS) Average Ileal Crohn’s Disease
  • 8.
    Using Scalable VisualizationAllows Comparison of the Relative Abundance of 200 Microbe Species Comparing 3 LS Time Snapshots (Left) with Healthy, Crohn’s, Ulcerative Colitis (Right Top to Bottom) Calit2 VROOM-FuturePatient Expedition
  • 9.
    Our Scalable VisualizationAnalysis Found That Some Species Can Differentiate IBD vs. Healthy Subjects Each Bar is a Person
  • 10.
    Using Ayasdi AdvancedAnalytics to Interactively Discover Hidden Patterns in Our Data topological data analysis Visit Ayasdi in the Exponential Medicine Healthcare Innovation Lab
  • 11.
    Using Ayasdi’s TopologicalData Analysis to Separate Healthy from Disease States All Healthy All Healthy All Ileal Crohn’s Using Ayasdi Categorical Data Lens Healthy, Ulcerative Colitis, and LS All Healthy Analysis by Mehrdad Yazdani, Calit2
  • 12.
    Ayasdi Interactively IdentifiesMicrobial Species That Statistically Best Separates Health and Disease States Ayasdi Confirms Our Two Species and Provides Many Others Group Comparisons using Ayasdi’s Statistical Tools
  • 13.
    Ayasdi Enables Discoveryof Differences Between Healthy and Disease States Using Microbiome Species Healthy LS Ileal Crohn’s Ulcerative Colitis High in Healthy and LS High in Healthy and Ulcerative Colitis High in Both LS and Ileal Crohn’s Disease Using Multidimensional Scaling Lens with Correlation Metric Analysis by Mehrdad Yazdani, Calit2
  • 14.
    In a “Healthy”Gut Microbiome: Large Taxonomy Variation, Low Protein Family Variation Over 200 People Source: Nature, 486, 207-212 (2012)
  • 15.
    However, Our ResearchShows Large Changes in Protein Families Between Health and Disease Ratio of CD Average to Healthy Average for Each Nonzero KEGG KEGGs Greatly Increased In the Disease State Most KEGGs Are Within 10x In Healthy and Crohn’s Disease KEGGs Greatly Decreased In the Disease State Over 7000 KEGGs Which Are Nonzero in Health and Disease States Using KEGG Relative Abundance of Protein Families
  • 16.
    Using Ayasdi Interactively to Explore Protein Families in Healthy and Disease States Dataset from Larry Smarr Team With 60 Subjects (HE, CD, UC, LS) Each with 10,000 KEGGs - 600,000 Cells Source: Pek Lum, Formerly Chief Data Scientist, Ayasdi
  • 17.
    Disease Arises fromPerturbed Protein Family Networks: Dynamics of a Prion Perturbed Network in Mice Source: Lee Hood, ISB 17 Our Next Goal is to Create Such Perturbed Networks in Humans
  • 18.
    Genetic and protein interaction networks Transcriptional networks UCSD’s Cytoscape Integrates and Visualizes Molecular Networks and Molecular Profiles Metabolic networks Source: Trey Ideker, UCSD mRNA & protein expression
  • 19.
    We Are EnablingCytoscape to Run Natively on 64M Pixel Visualization Walls and in 3D in VR Simulation of Cytoscape Running on VROOM Calit2 VROOM-FuturePatient Expedition Cytoscape Example from Douglas S. Greer, J. Craig Venter Institute and Jurgen P. Schulze, Calit2’s Qualcomm Institute
  • 20.
    Next Step: ApplyWhat We Have Learned to Larger Population Microbiome Datasets • I am a Member of the Pioneer 100 • Our Team Now Has the Gut Microbiomes of the Pioneer 100 • We Plan to Analyze Them for Differences Using These Tools Will Grow to 1000 Then 10,000 Then 100,000 http://isbmolecularme.com/tag/100-pioneers/
  • 21.
    UC San DiegoWill Be Carrying Out a Major Clinical Study of IBD Using These Techniques Announced Last Friday! Inflammatory Bowel Disease Biobank For Healthy and Disease Patients Already 120 Enrolled, Goal is 1500 Drs. William J. Sandborn, John Chang, & Brigid Boland UCSD School of Medicine, Division of Gastroenterology
  • 22.
    Inexpensive Consumer TimeSeries of Microbiome Now Possible Through Ubiome Data source: LS (Stool Samples); Sequencing and Analysis Ubiome
  • 23.
    By Crowdsourcing, UbiomeCan Show I Have a Major Disruption of My Gut Microbiome (-) (+) LS Sample on September 24, 2014 Visit Ubiome in the Exponential Medicine Healthcare Innovation Lab
  • 24.
    Using Big DataAnalytics to Move From Clinical Research to Precision Medicine 1) Identify Patient Cohorts for Treatment 2) Combine Data Types for Full View of Patient Genetic Data EMR Data Financial Data 3) Precision Medicine Pathways @ Point of Care More data collected @ point of care Continuous Data-Driven Improvement
  • 25.
    Thanks to OurGreat Team! UCSD Metagenomics Team Weizhong Li Sitao Wu Calit2@UCSD Future Patient Team Jerry Sheehan Tom DeFanti Kevin Patrick Jurgen Schulze Andrew Prudhomme Philip Weber Fred Raab Joe Keefe Ernesto Ramirez Ayasdi Devi Sanjnan Pek JCVI Team Karen Nelson Shibu Yooseph Manolito Torralba SDSC Team Michael Norman Mahidhar Tatineni Robert Sinkovits UCSD Health Sciences Team William J. Sandborn Elisabeth Evans John Chang Brigid Boland David Brenner
  • 26.
    This Talk Buildson My Two Prior Future Med Presentations Download Them From: http://lsmarr.calit2.net/presentations?slideshow=28247009 http://lsmarr.calit2.net/presentations?slideshow=16384993

Editor's Notes

  • #11 Lab
  • #25 Adding data: Genetic data EMR data Financial data Precision medicine pathways Pathways across the care continuum