Download to read offline


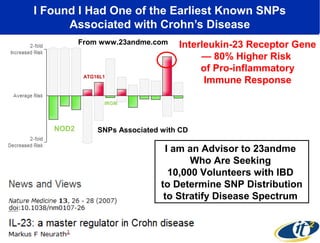
![I Also Had an Increased Risk for Ulcerative Colitis,
But a SNP that is Also Associated with Colonic CD
I Have a
33% Increased Risk
for Ulcerative Colitis
HLA-DRA (rs2395185)
I Have the Same Level
of HLA-DRA Increased Risk
as Another Male Who Has Had
Ulcerative Colitis for 20 Years
“Our results suggest that at least for the SNPs investigated
[including HLA-DRA],
colonic CD and UC have common genetic basis.”
-Waterman, et al., IBD 17, 1936-42 (2011)](https://image.slidesharecdn.com/bdlssept2014-140925122614-phpapp01/85/Quantifying-Your-Superorganism-Body-Using-Big-Data-Supercomputing-14-320.jpg)


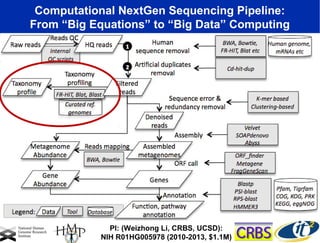

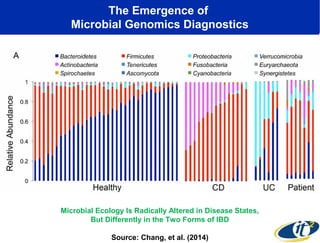
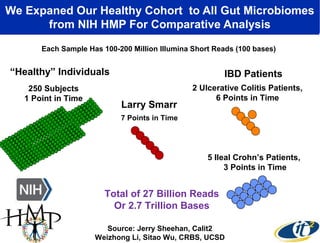

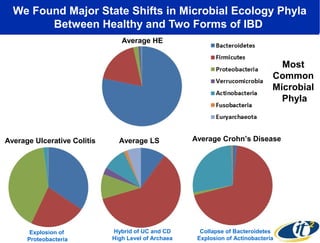
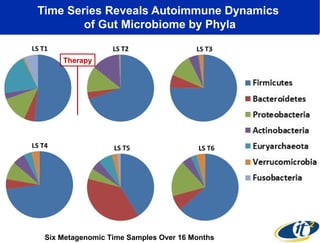


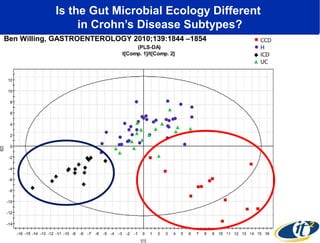
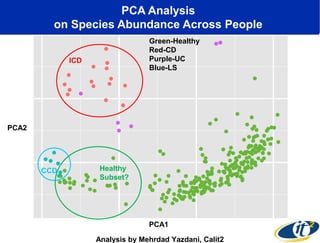
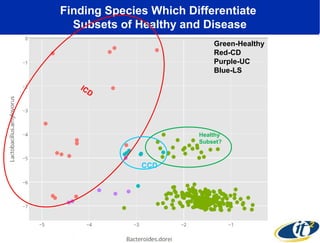
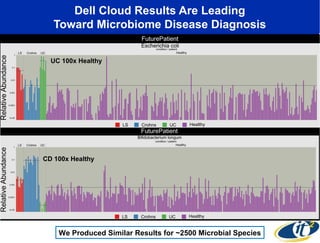
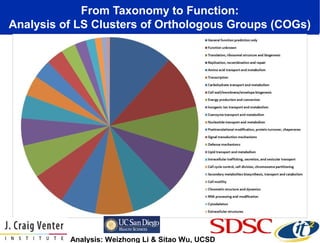
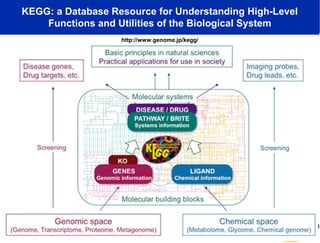
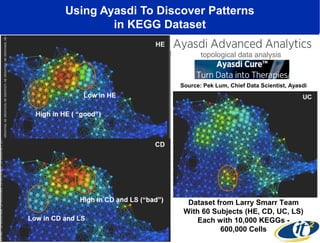


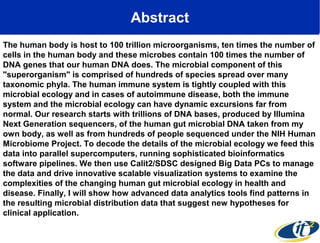
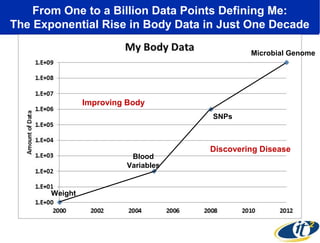
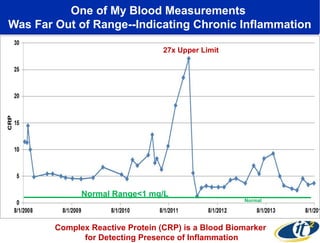
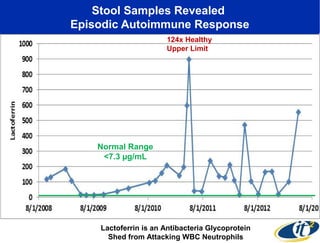
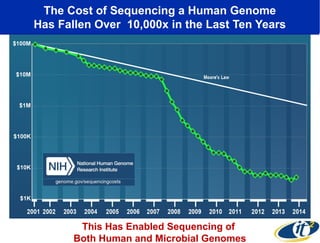
The document discusses the integration of big data and supercomputing in understanding the human microbiome, emphasizing the role of microorganisms in autoimmune diseases like inflammatory bowel disease (IBD). It outlines the research methodologies used, including DNA sequencing and data analytics to identify microbial patterns correlated with health and disease. The conclusion highlights the potential for personalized medicine through the quantification and analysis of microbiome data.


![PERI-PROSTHETIC FRACTURE NAIL-PLATE CONSTRUCT [NPC].pptx](https://cdn.slidesharecdn.com/ss_thumbnails/drarunkumardrmohamedashrafperiprostheticfrasturenail-plateconstructnpc-260209164459-7e9d15a1-thumbnail.jpg?width=640&height=640&fit=bounds)


