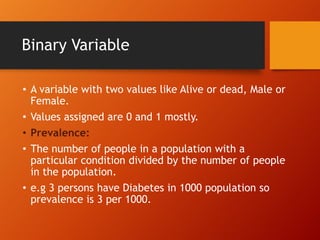
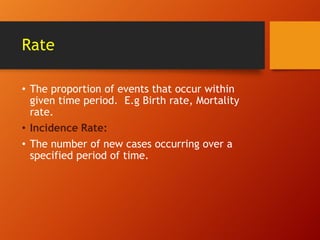
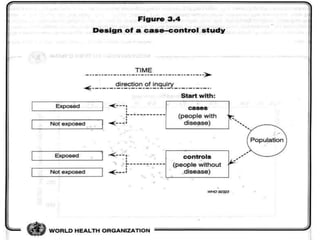
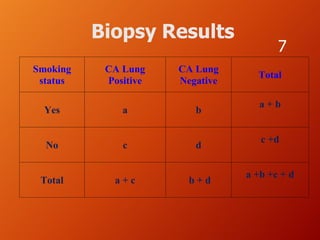
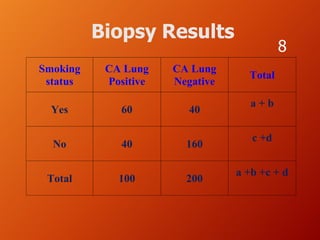
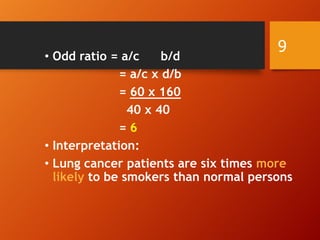
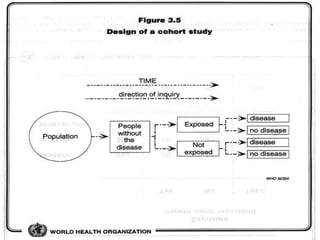
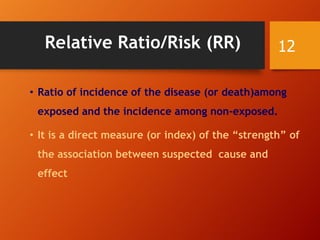
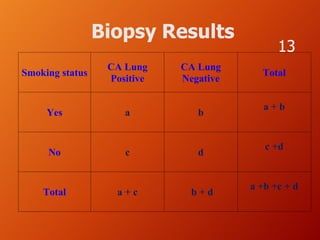
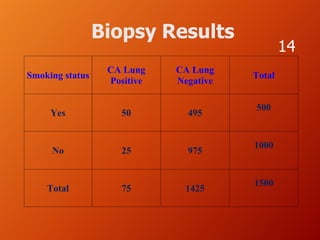
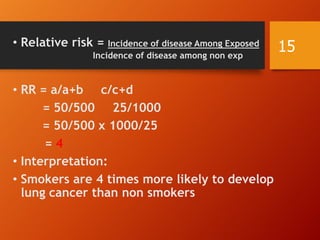
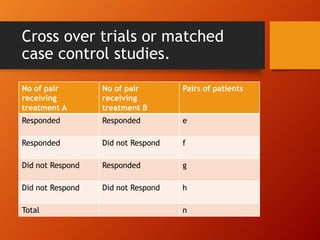
Summary statistics for Binary
Data
By Dr Zahid Khan

Senior Lecturer King Faisal
University
Binary Variable
• A variable with two values like Alive or dead, Male or
Female.
• Values assigned are 0 and 1 mostly.
• Prevalence:
• The number of people in a population with a
particular condition divided by the number of people
in the population.
• e.g 3 persons have Diabetes in 1000 population so
prevalence is 3 per 1000.
Rate
• The proportion of events that occur within
given time period. E.g Birth rate, Mortality
rate.
• Incidence Rate:
• The number of new cases occurring over a
specified period of time.
Case Control Studies

4

• In a CASE-CONTROL STUDY, the investigator
compares one group among whom a problem is
(e.g., malnutrition) with another group, called a
control or comparison group, where the problem is
absent to find out what factors have contributed to
the problem.
5
Case Control Studies

6

• A study was conducted to find out the association
of smoking to lung cancer. 100 cases of lung cancer
were interviewed about their smoking status and
60 of them were smokers. 200 Normal people
were also interviewed and 40 of them were
smokers. Find the odd ratio in the given scenario
and interpret your result as well.
Biopsy Results
Smoking
status

CA Lung
Positive

CA Lung
Negative

Yes

a

b

No

c

d

Total

a+c

b+d

7
Total
a+b

c +d

a +b +c + d
Biopsy Results
Smoking
status

CA Lung
Positive

CA Lung
Negative

Yes

60

40

No

40

160

Total

100

200

8
Total
a+b
c +d
a +b +c + d
9

• Odd ratio = a/c
b/d
= a/c x d/b
= 60 x 160
40 x 40
=6
• Interpretation:
• Lung cancer patients are six times more
likely to be smokers than normal persons
Cohort Studies

10

• In a COHORT STUDY, a group of individuals that is
exposed to a risk factor (study group) is compared
with a group of individuals not exposed to the risk
factor (control group).
• The researcher follows both groups over time and
compares the occurrence of the problem that he or
she expects to be related to the risk factor in the
two groups to determine whether a greater
proportion of those with the risk factor are indeed
affected.
11
Relative Ratio/Risk (RR)

12

• Ratio of incidence of the disease (or death)among
exposed and the incidence among non-exposed.

• It is a direct measure (or index) of the “strength” of
the association between suspected cause and
effect
Biopsy Results
Smoking status

CA Lung
Positive

CA Lung
Negative

Yes

a

b

No

c

d

Total

a+c

b+d

13
Total
a+b

c +d

a +b +c + d
Biopsy Results
Smoking status

CA Lung
Positive

CA Lung
Negative

Yes

50

495

No

25

975

Total

75

1425

14
Total
500

1000

1500
• Relative risk = Incidence of disease Among Exposed
Incidence of disease among non exp

• RR = a/a+b c/c+d
= 50/500 25/1000
= 50/500 x 1000/25
=4
• Interpretation:
• Smokers are 4 times more likely to develop
lung cancer than non smokers

15
NNT & Absolute Risk Difference
•
•
•
•
•
•
•
•

ARD is also known as Absolute Risk Reduction.
Number Needed to Treat (NNT)= 1/ ARD or
NNT = 1/P2-P1
ARD = P2 – P1
P1 = a/(a+b) & P2 = c/(c+d)
P1= 50/500 & P2 = 250/1000
P1= 0.1 & P2= 0.25 => P2-P1 = 0.15
NNT = 1/0.15 = 6.66 or 7
Cross over trials or matched case
control studies.
• Cross over trials or Matched case-control
studies are those trials in which the results of
a test or treatment can be recorded as one of
the two alternatives.
• Two treatments or tests carried out on pair
obtained by matching individuals or pair might
consists of successive treatment of same
individual and result can be recorded as
responded or did not respond, improved or did
not improve, test positive or negative.
Cross over trials or matched
case control studies.
No of pair
receiving
treatment A

No of pair
receiving
treatment B

Pairs of patients

Responded

Responded

e

Responded

Did not Respond

f

Did not Respond

Responded

g

Did not Respond

Did not Respond

h

Total

n
Cross over trials or matched
case control studies.
Subject Getting B

Positive

Subject
Getting A
Total

Negative

Total

Positive

e

f

e+f

Negative

g

h

g+h

e+g

f+h

n
Cross over trials or matched
case control studies.
• Proportion responding to treatment A pA =
(e+f)/n
• Proportion responding to treatment B pB =
(e+g)/n
• Difference = pA-pB = ( f-g)/n
• OR paired = f/g
Questions !!!!!!

•

Thank You.

Summary statistics for binary data lecture

  • 1.
    Summary statistics forBinary Data By Dr Zahid Khan Senior Lecturer King Faisal University
  • 2.
    Binary Variable • Avariable with two values like Alive or dead, Male or Female. • Values assigned are 0 and 1 mostly. • Prevalence: • The number of people in a population with a particular condition divided by the number of people in the population. • e.g 3 persons have Diabetes in 1000 population so prevalence is 3 per 1000.
  • 3.
    Rate • The proportionof events that occur within given time period. E.g Birth rate, Mortality rate. • Incidence Rate: • The number of new cases occurring over a specified period of time.
  • 4.
    Case Control Studies 4 •In a CASE-CONTROL STUDY, the investigator compares one group among whom a problem is (e.g., malnutrition) with another group, called a control or comparison group, where the problem is absent to find out what factors have contributed to the problem.
  • 5.
  • 6.
    Case Control Studies 6 •A study was conducted to find out the association of smoking to lung cancer. 100 cases of lung cancer were interviewed about their smoking status and 60 of them were smokers. 200 Normal people were also interviewed and 40 of them were smokers. Find the odd ratio in the given scenario and interpret your result as well.
  • 7.
    Biopsy Results Smoking status CA Lung Positive CALung Negative Yes a b No c d Total a+c b+d 7 Total a+b c +d a +b +c + d
  • 8.
    Biopsy Results Smoking status CA Lung Positive CALung Negative Yes 60 40 No 40 160 Total 100 200 8 Total a+b c +d a +b +c + d
  • 9.
    9 • Odd ratio= a/c b/d = a/c x d/b = 60 x 160 40 x 40 =6 • Interpretation: • Lung cancer patients are six times more likely to be smokers than normal persons
  • 10.
    Cohort Studies 10 • Ina COHORT STUDY, a group of individuals that is exposed to a risk factor (study group) is compared with a group of individuals not exposed to the risk factor (control group). • The researcher follows both groups over time and compares the occurrence of the problem that he or she expects to be related to the risk factor in the two groups to determine whether a greater proportion of those with the risk factor are indeed affected.
  • 11.
  • 12.
    Relative Ratio/Risk (RR) 12 •Ratio of incidence of the disease (or death)among exposed and the incidence among non-exposed. • It is a direct measure (or index) of the “strength” of the association between suspected cause and effect
  • 13.
    Biopsy Results Smoking status CALung Positive CA Lung Negative Yes a b No c d Total a+c b+d 13 Total a+b c +d a +b +c + d
  • 14.
    Biopsy Results Smoking status CALung Positive CA Lung Negative Yes 50 495 No 25 975 Total 75 1425 14 Total 500 1000 1500
  • 15.
    • Relative risk= Incidence of disease Among Exposed Incidence of disease among non exp • RR = a/a+b c/c+d = 50/500 25/1000 = 50/500 x 1000/25 =4 • Interpretation: • Smokers are 4 times more likely to develop lung cancer than non smokers 15
  • 16.
    NNT & AbsoluteRisk Difference • • • • • • • • ARD is also known as Absolute Risk Reduction. Number Needed to Treat (NNT)= 1/ ARD or NNT = 1/P2-P1 ARD = P2 – P1 P1 = a/(a+b) & P2 = c/(c+d) P1= 50/500 & P2 = 250/1000 P1= 0.1 & P2= 0.25 => P2-P1 = 0.15 NNT = 1/0.15 = 6.66 or 7
  • 17.
    Cross over trialsor matched case control studies. • Cross over trials or Matched case-control studies are those trials in which the results of a test or treatment can be recorded as one of the two alternatives. • Two treatments or tests carried out on pair obtained by matching individuals or pair might consists of successive treatment of same individual and result can be recorded as responded or did not respond, improved or did not improve, test positive or negative.
  • 18.
    Cross over trialsor matched case control studies. No of pair receiving treatment A No of pair receiving treatment B Pairs of patients Responded Responded e Responded Did not Respond f Did not Respond Responded g Did not Respond Did not Respond h Total n
  • 19.
    Cross over trialsor matched case control studies. Subject Getting B Positive Subject Getting A Total Negative Total Positive e f e+f Negative g h g+h e+g f+h n
  • 20.
    Cross over trialsor matched case control studies. • Proportion responding to treatment A pA = (e+f)/n • Proportion responding to treatment B pB = (e+g)/n • Difference = pA-pB = ( f-g)/n • OR paired = f/g
  • 21.