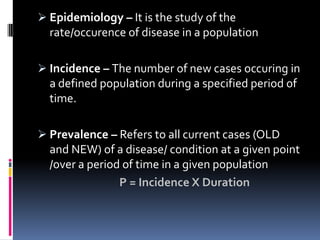
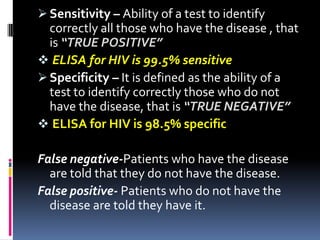
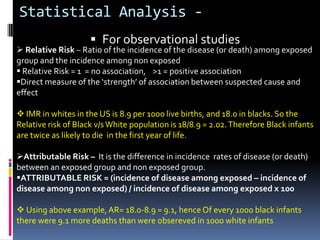
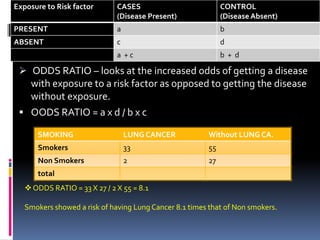
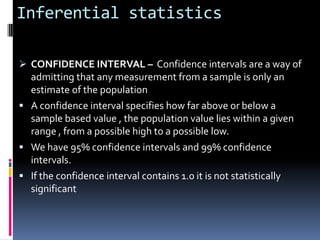
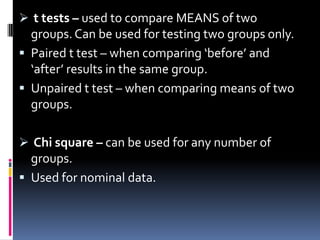
An introduction to some commonly used
terms of significance for all clinicians
EPIDEMIOLOGICAL
STATISTICS


MODERATOR: Prof Kakkar and Prof. R M Kaushik

PRESENTER- Dr.Garima Aggarwal
 Epidemiology – It is the study of the
  rate/occurence of disease in a population

 Incidence – The number of new cases occuring in
  a defined population during a specified period of
  time.

 Prevalence – Refers to all current cases (OLD
  and NEW) of a disease/ condition at a given point
  /over a period of time in a given population
                P = Incidence X Duration
 Sensitivity – Ability of a test to identify
  correctly all those who have the disease , that
  is “TRUE POSITIVE”
 ELISA for HIV is 99.5% sensitive
 Specificity – It is defined as the ability of a
  test to identify correctly those who do not
  have the disease, that is “TRUE NEGATIVE”
 ELISA for HIV is 98.5% specific

False negative-Patients who have the disease
  are told that they do not have the disease.
False positive- Patients who do not have the
  disease are told they have it.
Statistical Averages
 MEAN – individual observations are added
  together and then divided by the number of
  observations
 MEDIAN – data is first arranged in an
  ascending or descending order of magnitude
  and then the value of the middle observation is
  located
 MODE- most frequently occurring observation
  in a series of observations
 STANDARD DEVIATION-
EPIDEMIOLOGICALSTUDY


     OBSERVATIONAL                 EXPERIMENTAL


DESCRIPTIVE   ANALYTICAL    RCTs        FIELD     COMMUNITY
                                       TRIALS      TRIALS
Observational
 studies-
 CASE   REPORT – clinical characteristic or outcome from a
single clinical subject
 CROSS SECTIONAL STUDY        – study based on a single
examination of a cross section of population at ONE
POINT IN TIME , where cross section is such that the
results can be projected on the entire study population

 CASE CONTROL STUDY – study of a group of people
with the disease and compares them with a suitable
comparison group without the disease , i.e. CASES and
CONTROLS. Retrospective study.
 COHORT STUDY – population group of those who
 have been exposed to risk factor is identified and
 followed over time and compared with a group not
 exposed to the risk factor. Prospective study.


 CASE CONTROL                            COHORT


                     CROSS SECTIONAL
Experimental
 studies -

  RANDOMISED CONTROLLED TRIALS – subjects in
  the study are randomly allocated into “intervention”
  and “control” groups to receive or not to receive an
  experimental preventive or therapeutic procedure or
  intervention.Most scientifically rigorous studies.


              Select    RAND   Experiment
  Select                          al V/S
population
             suitable    O-      control    Manipulation   Blinding   ASSESSMENT

             sample     MISE      group
Statistical Analysis -
                      For observational studies
 Relative Risk – Ratio of the incidence of the disease (or death) among exposed
group and the incidence among non exposed
 Relative Risk = 1 = no association, >1 = positive association
Direct measure of the ‘strength’ of association between suspected cause and
effect

 IMR in whites in the US is 8.9 per 1000 live births, and 18.0 in blacks. So the
Relative risk of Black v/s White population is 18/8.9 = 2.02. Therefore Black infants
are twice as likely to die in the first year of life.

Attributable Risk – It is the difference in incidence rates of disease (or death)
between an exposed group and non exposed group.
ATTRIBUTABLE RISK = (incidence of disease among exposed – incidence of
disease among non exposed) / incidence of disease among exposed x 100

 Using above example, AR= 18.0-8.9 = 9.1, hence Of every 1000 black infants
there were 9.1 more deaths than were obsereved in 1000 white infants
Exposure to Risk factor       CASES                          CONTROL
                              (Disease Present)              (Disease Absent)
PRESENT                       a                              b
ABSENT                        c                              d
                              a +c                           b+ d

  ODDS RATIO – looks at the increased odds of getting a disease
   with exposure to a risk factor as opposed to getting the disease
   without exposure.
  OODS RATIO = a x d / b x c

      SMOKING                     LUNG CANCER           Without LUNG CA.
      Smokers                     33                    55
      Non Smokers                 2                     27
      total
    ODDS RATIO = 33 X 27 / 2 X 55 = 8.1

   Smokers showed a risk of having Lung Cancer 8.1 times that of Non smokers.
Inferential statistics

 CONFIDENCE INTERVAL – Confidence intervals are a way of
  admitting that any measurement from a sample is only an
  estimate of the population
 A confidence interval specifies how far above or below a
  sample based value , the population value lies within a given
  range , from a possible high to a possible low.
 We have 95% confidence intervals and 99% confidence
  intervals.
 If the confidence interval contains 1.0 it is not statistically
  significant
What is the ‘p value’???
 With scientific methods – we put forward a
    research question eg. Smokers more likely to get
    lung cancer!
   Null hypothesis – says that all findings are a result
    of chance or random factors i.e. smoking has no
    real relation with lung cancer
   Hypothesis testing – ‘p value’ – helps to interpret
    output from a statistical test. It is the standard
    against which we compare our results.
   If p value < or = 0.05 - the results are statistically
    significant, i.e. REJECT NULL HYPOTHESIS
   If p value > 0.05 – statistically insignificant, i.e. DO
    NOT REJECT NULL HYPOTHESIS
Statistical tests -
 META-ANALYSIS- A statistical way of combining
 results of many studies to produce one overall
 conclusion.

 Correlation coefficient – It indicates the degree to
  which two measures are related
 It ranges from -1.o to +1.0
 Medical school grades and various factors affecting it.
Positive value – two variables go together in the same
  direction. IQ has a positive corelation with medical
  grades.
Negative value – presence of one variable is associated
  with absence of another. Time spent on outdoor
  activities negative correlation with grades.
 t tests – used to compare MEANS of two
  groups. Can be used for testing two groups only.
 Paired t test – when comparing ‘before’ and
  ‘after’ results in the same group.
 Unpaired t test – when comparing means of two
  groups.

 Chi square – can be used for any number of
 groups.
 Used for nominal data.
Thank you for your
     patience.

Epidemiological statistics

  • 1.
    An introduction tosome commonly used terms of significance for all clinicians EPIDEMIOLOGICAL STATISTICS MODERATOR: Prof Kakkar and Prof. R M Kaushik PRESENTER- Dr.Garima Aggarwal
  • 2.
     Epidemiology –It is the study of the rate/occurence of disease in a population  Incidence – The number of new cases occuring in a defined population during a specified period of time.  Prevalence – Refers to all current cases (OLD and NEW) of a disease/ condition at a given point /over a period of time in a given population P = Incidence X Duration
  • 3.
     Sensitivity –Ability of a test to identify correctly all those who have the disease , that is “TRUE POSITIVE”  ELISA for HIV is 99.5% sensitive  Specificity – It is defined as the ability of a test to identify correctly those who do not have the disease, that is “TRUE NEGATIVE”  ELISA for HIV is 98.5% specific False negative-Patients who have the disease are told that they do not have the disease. False positive- Patients who do not have the disease are told they have it.
  • 4.
    Statistical Averages  MEAN– individual observations are added together and then divided by the number of observations  MEDIAN – data is first arranged in an ascending or descending order of magnitude and then the value of the middle observation is located  MODE- most frequently occurring observation in a series of observations  STANDARD DEVIATION-
  • 6.
    EPIDEMIOLOGICALSTUDY OBSERVATIONAL EXPERIMENTAL DESCRIPTIVE ANALYTICAL RCTs FIELD COMMUNITY TRIALS TRIALS
  • 7.
    Observational studies-  CASE REPORT – clinical characteristic or outcome from a single clinical subject  CROSS SECTIONAL STUDY – study based on a single examination of a cross section of population at ONE POINT IN TIME , where cross section is such that the results can be projected on the entire study population  CASE CONTROL STUDY – study of a group of people with the disease and compares them with a suitable comparison group without the disease , i.e. CASES and CONTROLS. Retrospective study.
  • 8.
     COHORT STUDY– population group of those who have been exposed to risk factor is identified and followed over time and compared with a group not exposed to the risk factor. Prospective study. CASE CONTROL COHORT CROSS SECTIONAL
  • 9.
    Experimental studies - RANDOMISED CONTROLLED TRIALS – subjects in the study are randomly allocated into “intervention” and “control” groups to receive or not to receive an experimental preventive or therapeutic procedure or intervention.Most scientifically rigorous studies. Select RAND Experiment Select al V/S population suitable O- control Manipulation Blinding ASSESSMENT sample MISE group
  • 10.
    Statistical Analysis -  For observational studies  Relative Risk – Ratio of the incidence of the disease (or death) among exposed group and the incidence among non exposed  Relative Risk = 1 = no association, >1 = positive association Direct measure of the ‘strength’ of association between suspected cause and effect  IMR in whites in the US is 8.9 per 1000 live births, and 18.0 in blacks. So the Relative risk of Black v/s White population is 18/8.9 = 2.02. Therefore Black infants are twice as likely to die in the first year of life. Attributable Risk – It is the difference in incidence rates of disease (or death) between an exposed group and non exposed group. ATTRIBUTABLE RISK = (incidence of disease among exposed – incidence of disease among non exposed) / incidence of disease among exposed x 100  Using above example, AR= 18.0-8.9 = 9.1, hence Of every 1000 black infants there were 9.1 more deaths than were obsereved in 1000 white infants
  • 11.
    Exposure to Riskfactor CASES CONTROL (Disease Present) (Disease Absent) PRESENT a b ABSENT c d a +c b+ d  ODDS RATIO – looks at the increased odds of getting a disease with exposure to a risk factor as opposed to getting the disease without exposure.  OODS RATIO = a x d / b x c SMOKING LUNG CANCER Without LUNG CA. Smokers 33 55 Non Smokers 2 27 total  ODDS RATIO = 33 X 27 / 2 X 55 = 8.1 Smokers showed a risk of having Lung Cancer 8.1 times that of Non smokers.
  • 12.
    Inferential statistics  CONFIDENCEINTERVAL – Confidence intervals are a way of admitting that any measurement from a sample is only an estimate of the population  A confidence interval specifies how far above or below a sample based value , the population value lies within a given range , from a possible high to a possible low.  We have 95% confidence intervals and 99% confidence intervals.  If the confidence interval contains 1.0 it is not statistically significant
  • 13.
    What is the‘p value’???  With scientific methods – we put forward a research question eg. Smokers more likely to get lung cancer!  Null hypothesis – says that all findings are a result of chance or random factors i.e. smoking has no real relation with lung cancer  Hypothesis testing – ‘p value’ – helps to interpret output from a statistical test. It is the standard against which we compare our results.  If p value < or = 0.05 - the results are statistically significant, i.e. REJECT NULL HYPOTHESIS  If p value > 0.05 – statistically insignificant, i.e. DO NOT REJECT NULL HYPOTHESIS
  • 14.
    Statistical tests - META-ANALYSIS- A statistical way of combining results of many studies to produce one overall conclusion.  Correlation coefficient – It indicates the degree to which two measures are related  It ranges from -1.o to +1.0  Medical school grades and various factors affecting it. Positive value – two variables go together in the same direction. IQ has a positive corelation with medical grades. Negative value – presence of one variable is associated with absence of another. Time spent on outdoor activities negative correlation with grades.
  • 15.
     t tests– used to compare MEANS of two groups. Can be used for testing two groups only.  Paired t test – when comparing ‘before’ and ‘after’ results in the same group.  Unpaired t test – when comparing means of two groups.  Chi square – can be used for any number of groups.  Used for nominal data.
  • 16.
    Thank you foryour patience.