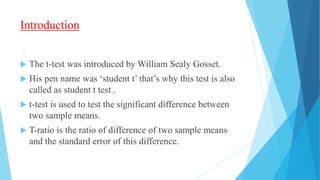
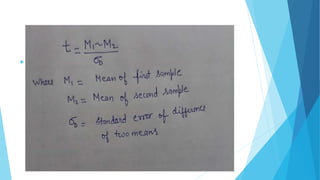
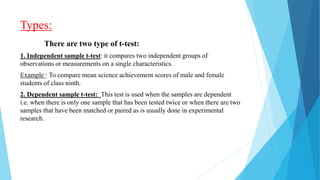
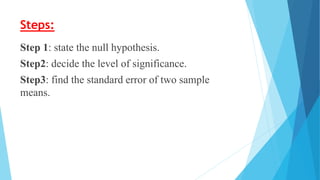
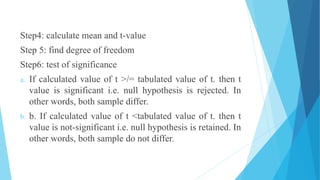
t-test
Priyanka Maurya,
Assistant Professor,
Department of Education, C.S.J.M. University,
Kanpur
Email: priyanka@csjmu.ac.in
Introduction
 The t-test was introduced by William Sealy Gosset.
 His pen name was ‘student t’ that’s why this test is also
called as student t test .
 t-test is used to test the significant difference between
two sample means.
 T-ratio is the ratio of difference of two sample means
and the standard error of this difference.
 Yahan t test k formule ki pic lagani h
Assumptions :
 Random observations.
 The sample must be drawn from a normally distributed
population.
 The sample drawn from a population must have equal ( nearly
equal) variances, this condition is known as homogeneity of
variance i.e. there should not be significant difference among the
variances of different samples.
 The data must be expressed in interval or ratio scales.
Types:
There are two type of t-test:
1. Independent sample t-test: it compares two independent groups of
observations or measurements on a single characteristics.
Example : To compare mean science achievement scores of male and female
students of class ninth.
2. Dependent sample t-test: This test is used when the samples are dependent
i.e. when there is only one sample that has been tested twice or when there are two
samples that have been matched or paired as is usually done in experimental
research.
Steps:
Step 1: state the null hypothesis.
Step2: decide the level of significance.
Step3: find the standard error of two sample
means.
Step4: calculate mean and t-value
Step 5: find degree of freedom
Step6: test of significance
a. If calculated value of t >/= tabulated value of t. then t
value is significant i.e. null hypothesis is rejected. In
other words, both sample differ.
b. b. If calculated value of t <tabulated value of t. then t
value is not-significant i.e. null hypothesis is retained. In
other words, both sample do not differ.
Step 7: summary of t- value
Step 8: interpretation
a. Significant or not
b. Accept or retained null hypothesis
c. Both group are same or different.
t test.pptx

t test.pptx

  • 1.
    t-test Priyanka Maurya, Assistant Professor, Departmentof Education, C.S.J.M. University, Kanpur Email: priyanka@csjmu.ac.in
  • 2.
    Introduction  The t-testwas introduced by William Sealy Gosset.  His pen name was ‘student t’ that’s why this test is also called as student t test .  t-test is used to test the significant difference between two sample means.  T-ratio is the ratio of difference of two sample means and the standard error of this difference.
  • 3.
     Yahan ttest k formule ki pic lagani h
  • 4.
    Assumptions :  Randomobservations.  The sample must be drawn from a normally distributed population.  The sample drawn from a population must have equal ( nearly equal) variances, this condition is known as homogeneity of variance i.e. there should not be significant difference among the variances of different samples.  The data must be expressed in interval or ratio scales.
  • 5.
    Types: There are twotype of t-test: 1. Independent sample t-test: it compares two independent groups of observations or measurements on a single characteristics. Example : To compare mean science achievement scores of male and female students of class ninth. 2. Dependent sample t-test: This test is used when the samples are dependent i.e. when there is only one sample that has been tested twice or when there are two samples that have been matched or paired as is usually done in experimental research.
  • 6.
    Steps: Step 1: statethe null hypothesis. Step2: decide the level of significance. Step3: find the standard error of two sample means.
  • 9.
    Step4: calculate meanand t-value Step 5: find degree of freedom Step6: test of significance a. If calculated value of t >/= tabulated value of t. then t value is significant i.e. null hypothesis is rejected. In other words, both sample differ. b. b. If calculated value of t <tabulated value of t. then t value is not-significant i.e. null hypothesis is retained. In other words, both sample do not differ.
  • 10.
    Step 7: summaryof t- value Step 8: interpretation a. Significant or not b. Accept or retained null hypothesis c. Both group are same or different.