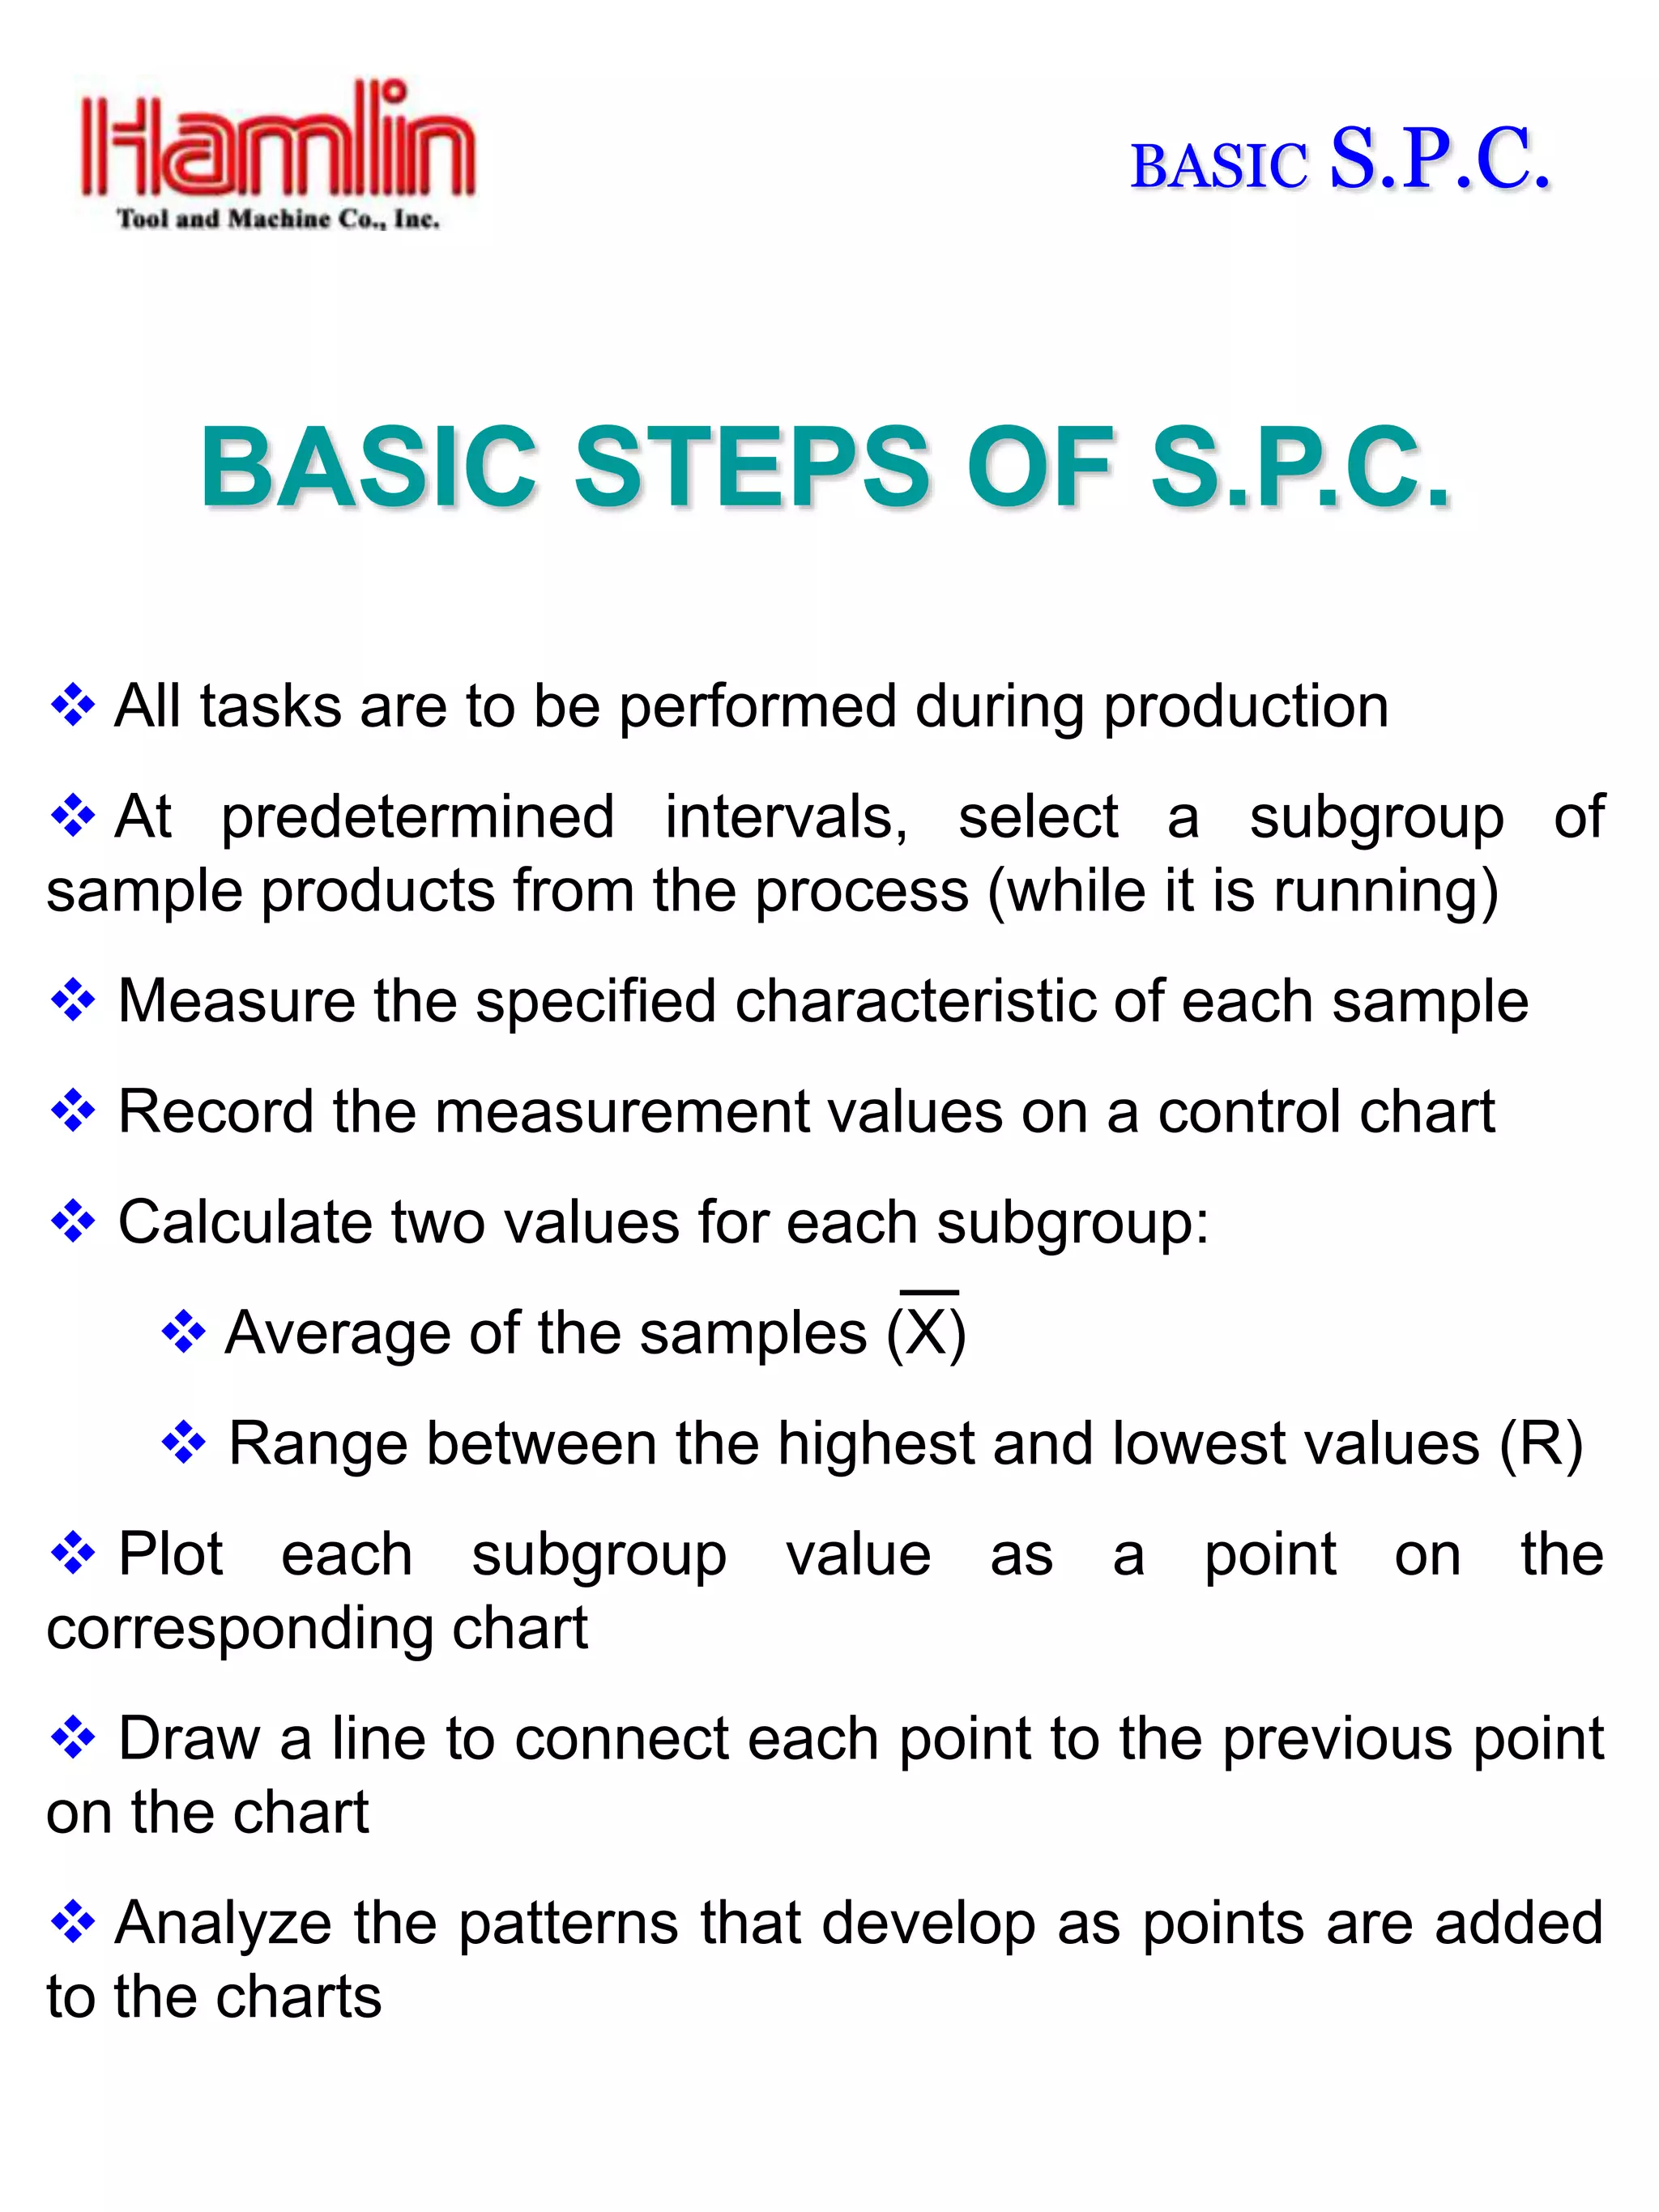
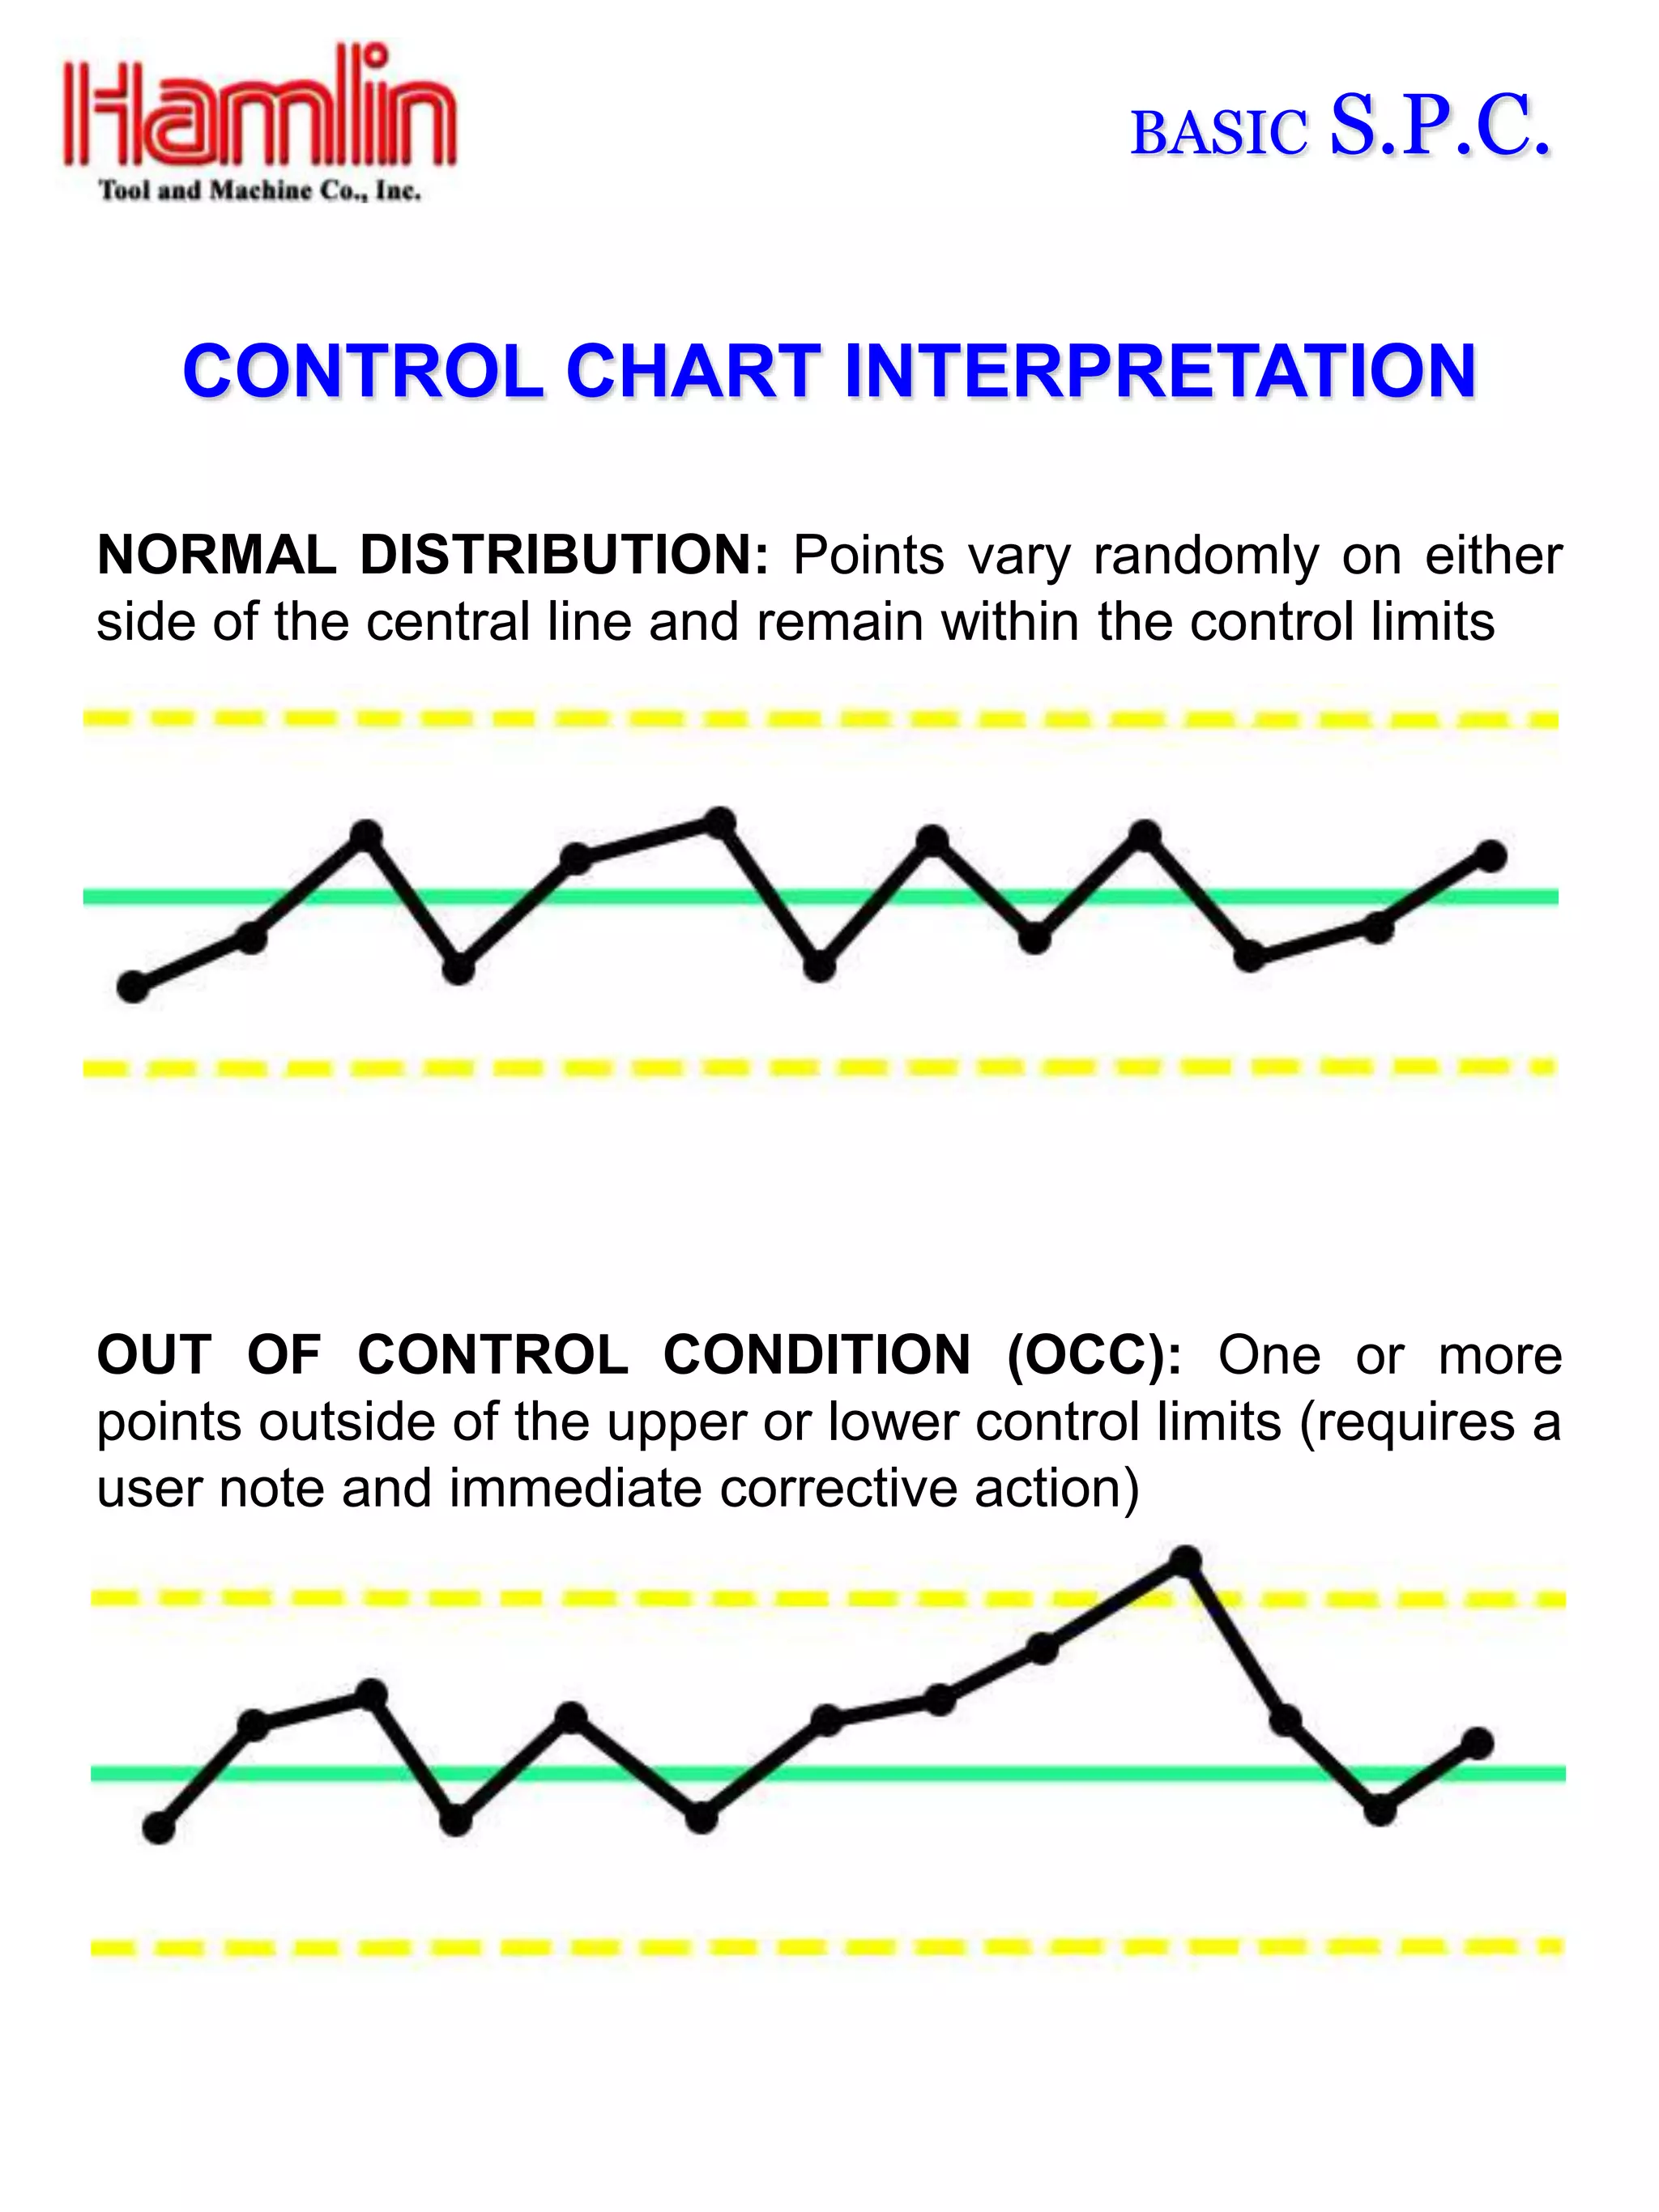
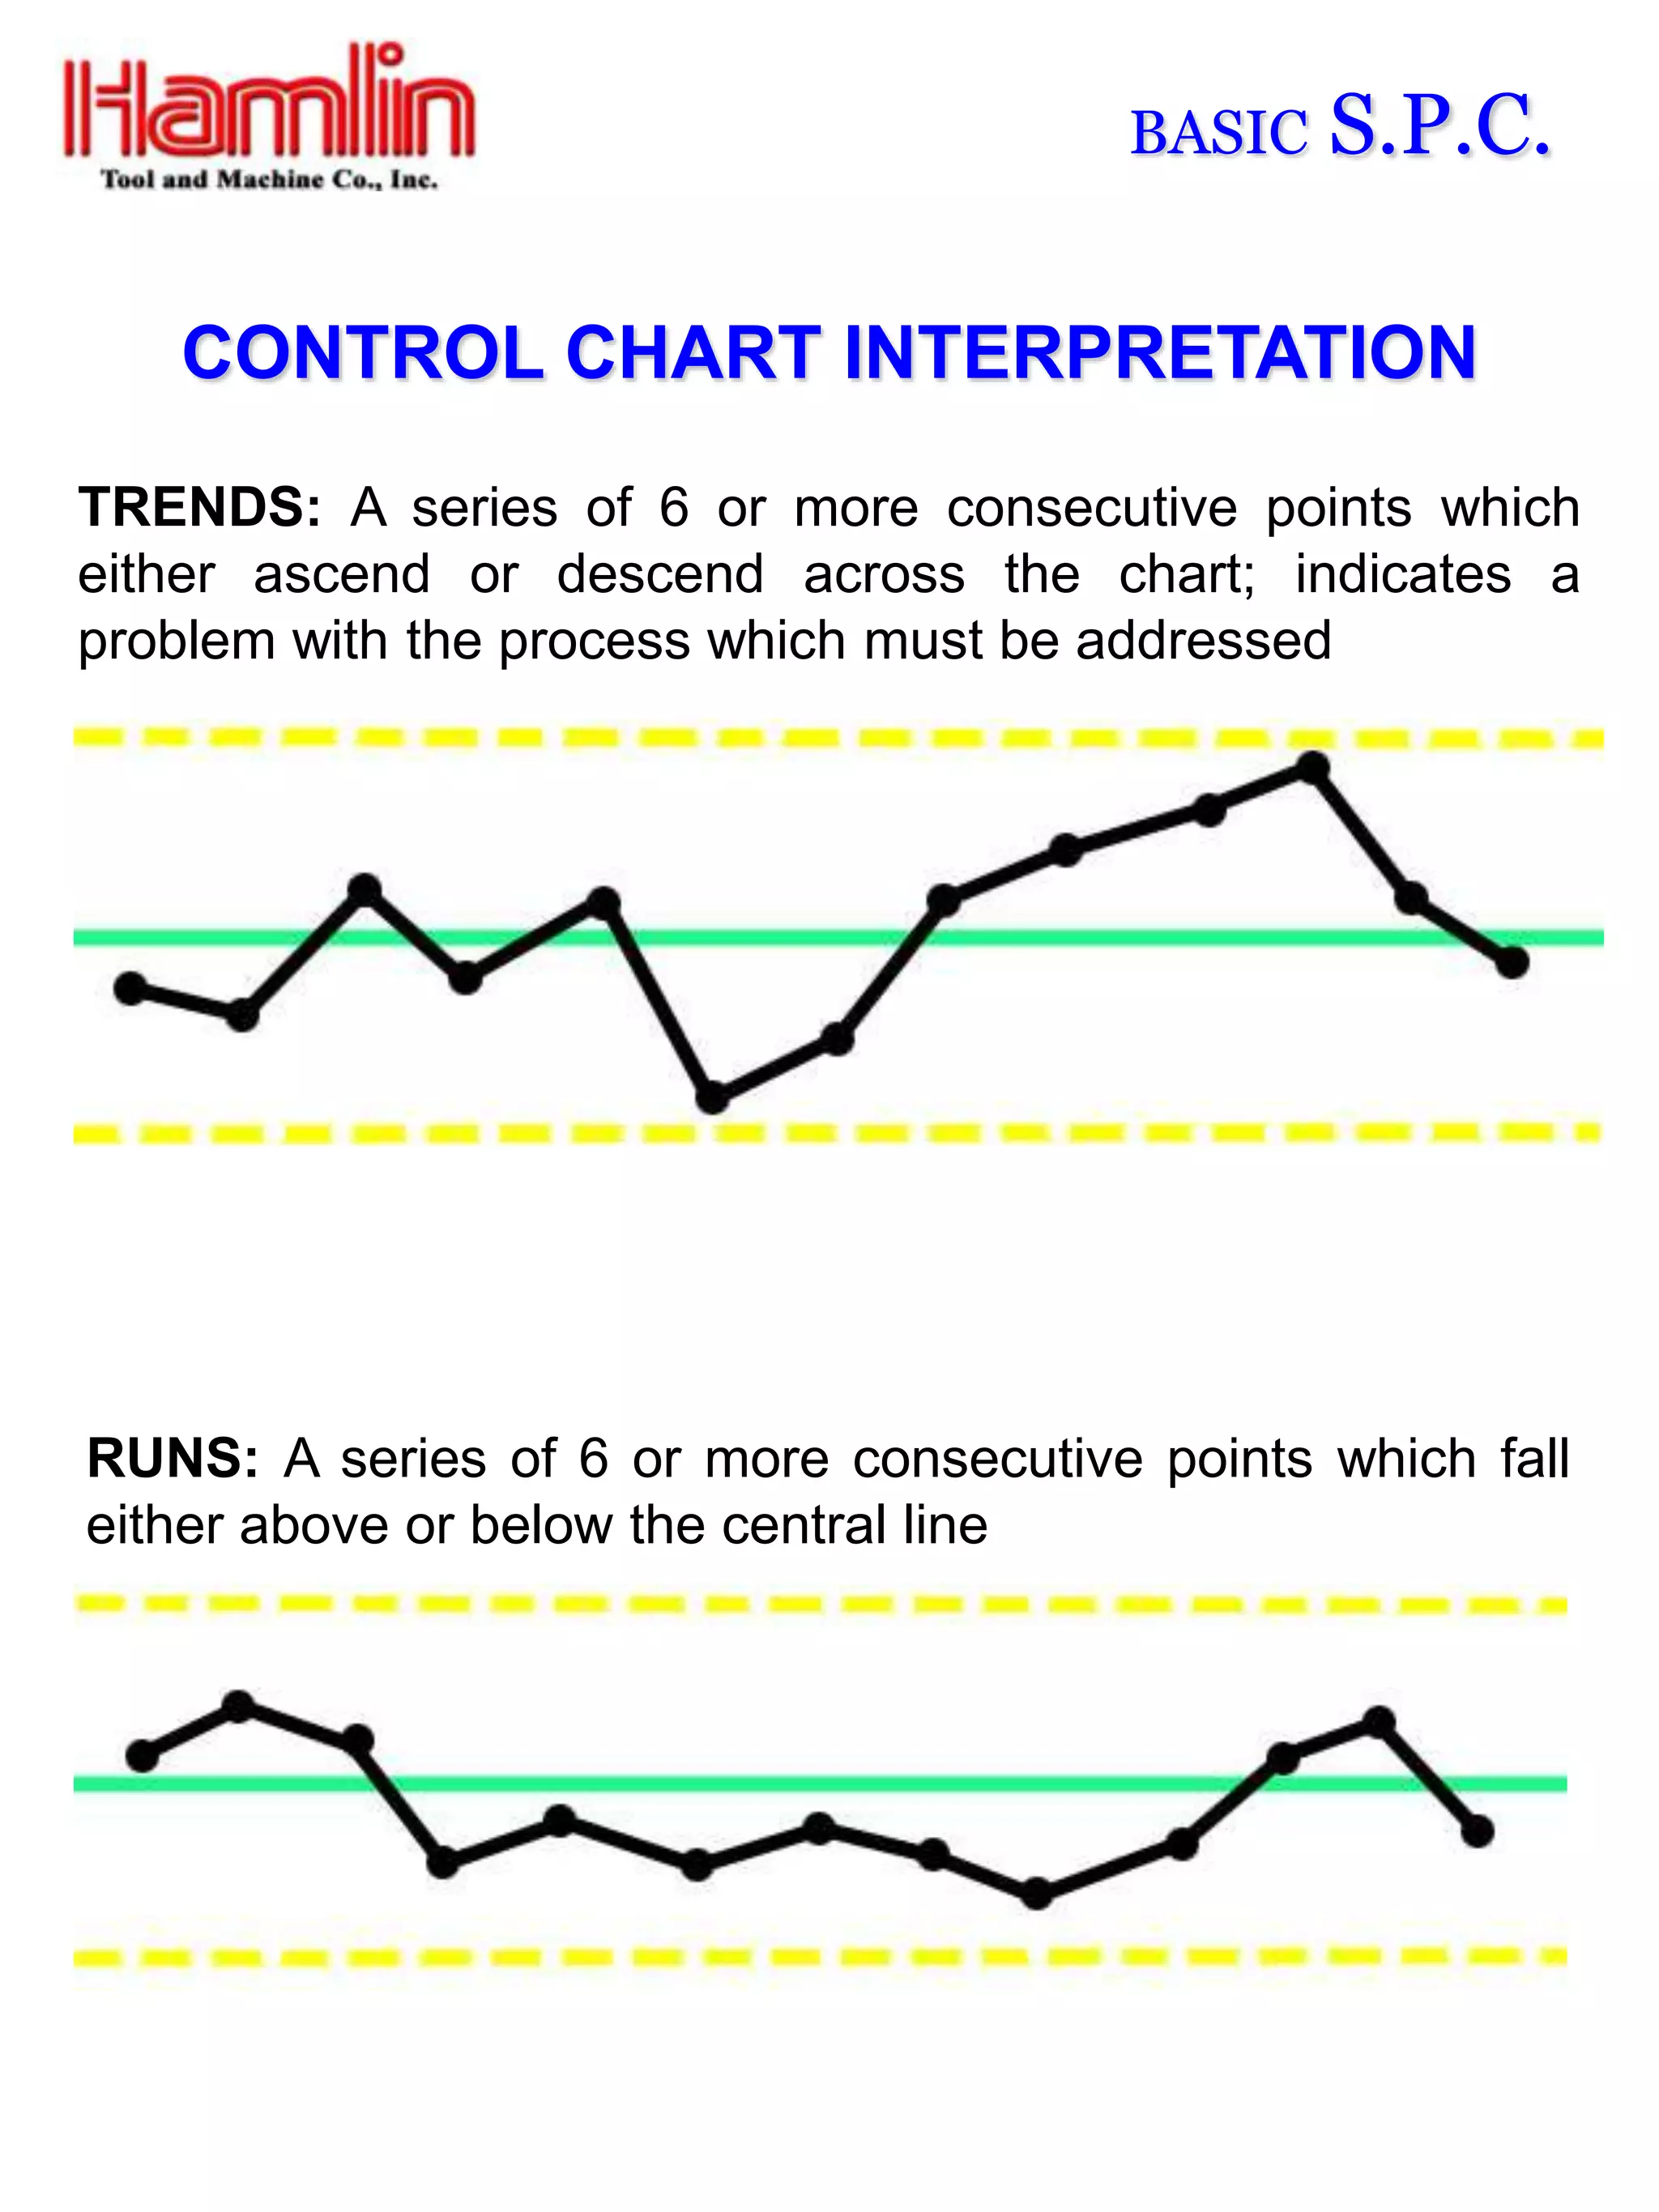
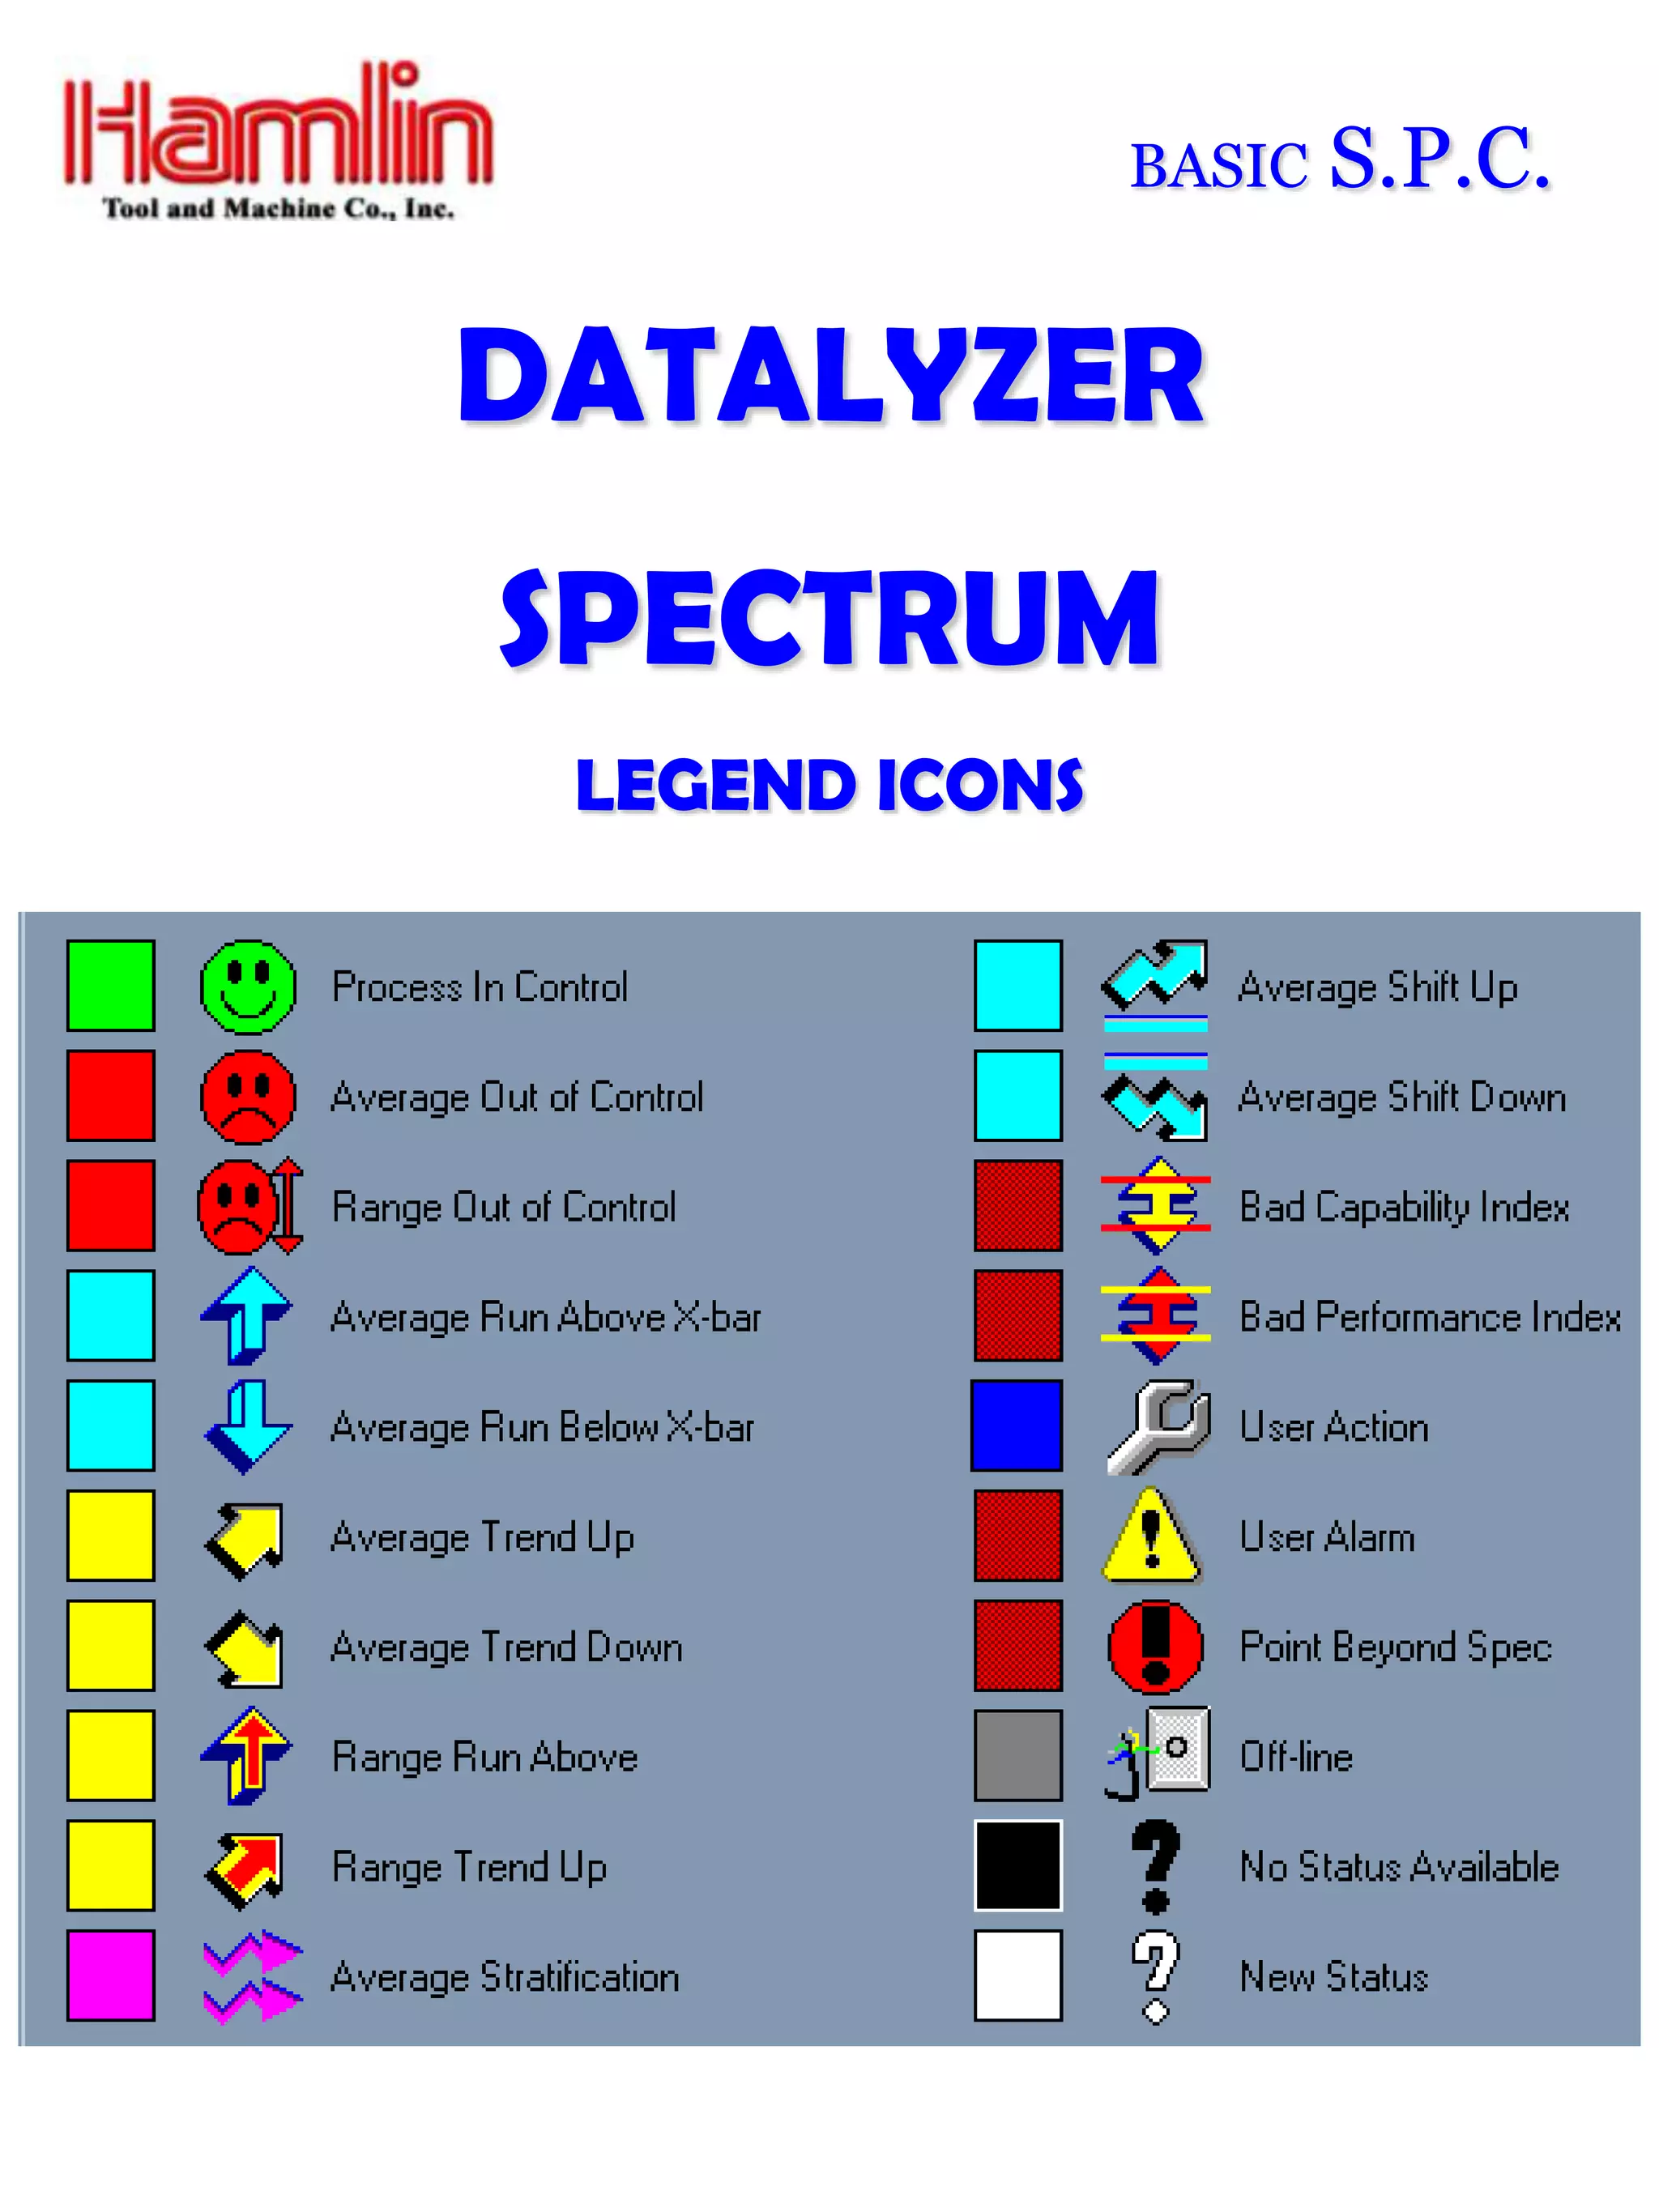
BASIC
S.P.C.
BASIC   S.P.C.

                    WHAT IS S.P.C.?
STATISTICAL PROCESS CONTROL
    IS THE USE OF STATISTICAL TECHNIQUES
         (SUCH AS CONTROL CHARTS) TO
       ANALYZE A PROCESS OR ITS OUTPUT.

S.P.C. HELPS MAINTAIN QUALITY WITHIN A
              PROCESS BY:
   Increasing customer satisfaction by reducing the amount of
       variation, producing a more trouble free product .
            Decreases scrap, rework, and inspection costs by
                        controlling the product.
    Decreases operating costs by optimizing the frequency of
                 tool adjustments and changes.
   Maximizes productivity by identifying and eliminating the
             causes of out of control conditions.
       Establishes a predictable and consistent level of quality.
   Eliminates or reduces the need for receiving inspection by
                        the customer.
BASIC   S.P.C.
All production processes have inherent variation. That is, no
two pieces produced are exactly alike if measured with
enough precision.

Variation can be categorized in terms of "common" and
"special" causes:

•Common cause variation occurs where a stable process
makes products that vary within a predictable range.

•Special cause variation results from unpredictable events
such as nonconforming raw material, a broken tool, or a
power sag.

SPC gives us the tools to measure the degree of both types of
variation with the goal being to eliminate special causes
altogether, and systematically attack common causes to reduce
them over time.

Control charts and capability studies are the main tools used to
describe processes graphically. Control charts are composed
of sampling results taken over time that are plotted as points
on special graphs. Different kinds of control charts
accommodate variable or attribute sampling.
BASIC   S.P.C.

 VARIABLE & ATTRIBUTE CHARACTERISTICS


A variable characteristic is a measurable feature such
              as height, width, or weight.
Variable control charts are composed of two graphs. The
top graph monitors process statistical location. It
measures      whether     the  process    is   adjusted
properly, comparing the calculated process average to
the print nominal or target value. The bottom graph
monitors process variation.


**********************************************************

An attribute characteristic is a countable feature such
 as go/no-go, present/not present or number of defects.
Attribute control charts are composed of only one graph
that monitors lot-to-lot variations in terms of percent or
number      nonconforming.      While    the   target  for
nonconformities is always zero, many unrefined
processes exhibit common-cause variation causing a
"predicted" nonconforming level above zero.
BASIC   S.P.C.


     BASIC STEPS OF S.P.C.

 All tasks are to be performed during production
 At predetermined intervals, select a subgroup of
sample products from the process (while it is running)
 Measure the specified characteristic of each sample
 Record the measurement values on a control chart
 Calculate two values for each subgroup:
     Average of the samples (X)
     Range between the highest and lowest values (R)
 Plot each subgroup value as a point on the
corresponding chart
 Draw a line to connect each point to the previous point
on the chart
 Analyze the patterns that develop as points are added
to the charts
BASIC    S.P.C.

X – R CHART
The X & R chart is actually two charts, and is the most
commonly used method of tracking variable characteristics.
Only one characteristic can be recorded on each chart.
       The X chart monitors subgroup averages
       The R chart monitors subgroup ranges


 A central line, which is a solid line across each
chart, represents the average of the subgroup values
     On an X chart, it’s labeled X, and represents the
    average of all the subgroup averages
     On an R chart, it’s labeled R, and represents the
    average of all of the subgroup ranges


 Control limits, which appear as dashed lines across each
chart, represent the expected range of variation for the
subgroup values
     The upper control limits is typically labeled UCL
     The lower control limit is typically labeled LCL
     The LCL on the R chart is often zero, and is
    represented by the bottom edge of the graph
BASIC   S.P.C.


      DIFFERENCE BETWEEN CONTROL LIMITS AND
               SPECIFICATION LIMITS
 Specification limits define an allowable amount of variation
for a characteristic. These limits are determined when a product
is designed.
 Control limits identify the expected range of variation for a
characteristic. These limits are based on the actual
measurements of the characteristic, as found during processing.


            CALCULATING SUBGROUP VALUES
 To find the X value for a subgroup:
     • Add the values of all the sample measurements taken
     • Divide this sum by the number of samples
 To find the R value for a subgroup:
      • Find the largest and smallest values in the subgroup
      • Subtract the smaller value from the larger value
BASIC     S.P.C.

                         1      2      3      4      5      6      7      8      9     10
                        38     31     30     32     32     33     33     33     33     30
                        35     31     30     33     34     38     34     33     36     35
DATA FROM EACH
                        34     34     32     33     37     31     36     36     35     37
  SUBGROUP
                        34     31     29     32     37     33     31     35     34     32
                        29     32     32     37     35     33     30     36     31     29
   TOTAL                170    159    153    167    175    168    164    173    169    163
   AVERAGE ( X )        34.0   31.8   30.6   33.4   35.0   33.6   32.8   34.6   33.8   32.6
   RANGE ( R )           9      3      3      5      5      7      6      3      5      8


                   37                        UPPER CONTROL LIMIT

                   36

CHART OF           35

   THE             34

AVERAGES           33                                                                         X
                   32
   (X)             31
                   30
                                             LOWER CONTROL LIMIT
                   29

                         1      2      3      4      5      6      7      8      9      10
                                                    SUBGROUPS


                   18
                   16

CHART OF           14

   THE             12                        UPPER CONTROL LIMIT
 RANGES            10
                   8
   (R)             6                                                                          R
                   4
                   2

                         1      2      3      4      5      6      7      8      9      10
                                                    SUBGROUPS
BASIC    S.P.C.
      PROCESS CAPABILITY AND PERFORMANCE
Process capability is a measure of the ability of a process to
produce products that meet required specifications. It is
measured by taking variable measurements over TIME from a
process that is statistically stable (only common cause variation
present). Process capability is typically reported as a measurable
referred to as the CpK value.
Cpk attempts to answer the question “will my process continue
to meet specifications in the long run?" Process capability
evaluation can only be done after the process is brought into
statistical control. The reason is simple: Cpk is a prediction based on
variation within a subgroup, and one can only predict something that
is stable. Think of the Cpk as the potential performance, or the
potential capability. Cpk is the CAPABILITY of your process if all
instability (special causes) were removed (or ignored).


Process performance is the actual state of the process at some
moment in time. In essence, a snap shot of the process now. In a
minute, hour, day, or week later it probably will be different. Process
performance is typically reported as a measurable referred to as the
PpK value.
Ppk attempts to answer the question "does my current
production sample meet specification?“ Ppk is how the process is
actually performing at the time you made the measurements. Think of
Ppk     as    being    the    actual   PERFORMANCE           of   your
process, incorporating all observed variation within the subgroups.
STOGRAM             6
                    5

                                                                                                   S.P.C.
                    4
                    3                                                          BASIC
                    2
                    1
                    CAPABILITY31 32 33 34 HISTOGRAMS
                        29 30
                               ANALYSIS: 35 36 37 38
                   10
                    9                                      X
                    8                                      X
                    7                              X       X
STOGRAM             6                       X      X       X      X
                    5                       X      X       X      X       X
                    4               X       X      X       X      X       X         X
                    3        X      X       X      X       X      X       X         X        X
      HISTOGRAMS


                    2        X      X       X      X       X      X       X         X        X          X
                    1        X      X       X      X       X      X       X         X        X          X
                             29     30      31     32     33      34     35      36          37        38

                   10
                    9                                      X
                    8                                      X
                    7                              X       X
                    6                       X      X       X      X
                    5                       X      X       X      X       X
                    4               X       X      X       X      X       X         X
                    3        X      X       X      X       X      X       X         X        X
                    2        X      X       X      X       X      X       X         X        X          X
                    1        X      X       X      X       X      X       X         X        X          X
                             29     30      31     32     33      34     35      36          37        38

                                    VARIABLE DATA - NORMAL CURVE

                                        1    2      3      4      5      6      7        8         9        10
                                     38     31     30     32     32     33     33       33        33        30
                                     35     31     30     33     34     38     34       33        36        35
           DATA FROM EACH
                                     34     34     32     33     37     31     36       36        35        37
             SUBGROUP
                                     34     31     29     32     37     33     31       35        34        32
                                     29     32     32     37     35     33     30       36        31        29
                    TOTAL           170     159    153    167    175    168    164      173       169       163
                    AVERAGE ( X )   34.0    31.8   30.6   33.4   35.0   33.6   32.8     34.6      33.8      32.6
                    RANGE ( R )         9    3      3      5      5      7      6        3         5         8
BASIC       S.P.C.
      Cpk > 1.33 (Capable )                 Cpk = 1 to 1.33 (Barely Capable)
   This process should produce                 This process will produce
         less than 64 PPM                      >64 PPM but < 2700 PPM


 A Highly Capable Process : Voice of the   A Barely Capable Process : Voice of the
         Process < Specification              Process = Customer Specification

********************************************
                                                 Cpk < 1 (Not Capable )
     Cpk < 1 (Not Capable )
                                              This process will also produce
    This process will produce
                                                  more than 2700 PPM
      more than 2700 PPM


 A Non-Capable Process : Voice of the        A Non-Capable Process : Voice of the
  Process > Customer Specification            Process > Customer Specification
BASIC   S.P.C.
        CONTROL CHART INTERPRETATION
NATURAL PATTERNS:
• Points remain within the control limits and vary randomly on both sides
of the central line
     • Most points fall near the central line
     • Some points fall closer to both control limits
     • No points should fall beyond either control limit
•The process is:
     • In statistical control
     • Producing products within the expected limits of variation
     • Operating as well as possible without adjustments
     • Stable and predictable
• Variation is due to common causes – normal factors not easily identified
or eliminated from a process
• Represents a normal distribution
UNNATURAL PATTERNS:
• The process is:
     • Out of statistical control
     •Unstable and unpredictable
     •Producing unexpected variation among products

• Variation may be due to assignable causes – unusual factors that can be
identified and eliminated from a process
•Common types are outliers, trends, runs or sudden changes in level
BASIC   S.P.C.

   CONTROL CHART INTERPRETATION

NORMAL DISTRIBUTION: Points vary randomly on either
side of the central line and remain within the control limits


OUT OF CONTROL CONDITION (OCC): One or more
points outside of the upper or lower control limits (requires a
user note and immediate corrective action)
BASIC   S.P.C.

   CONTROL CHART INTERPRETATION

TRENDS: A series of 6 or more consecutive points which
either ascend or descend across the chart; indicates a
problem with the process which must be addressed


RUNS: A series of 6 or more consecutive points which fall
either above or below the central line
BASIC   S.P.C.

DATALYZER
SPECTRUM
 LEGEND ICONS

Basic spc class

  • 1.
  • 2.
    BASIC S.P.C. WHAT IS S.P.C.? STATISTICAL PROCESS CONTROL IS THE USE OF STATISTICAL TECHNIQUES (SUCH AS CONTROL CHARTS) TO ANALYZE A PROCESS OR ITS OUTPUT. S.P.C. HELPS MAINTAIN QUALITY WITHIN A PROCESS BY:  Increasing customer satisfaction by reducing the amount of variation, producing a more trouble free product .  Decreases scrap, rework, and inspection costs by controlling the product.  Decreases operating costs by optimizing the frequency of tool adjustments and changes.  Maximizes productivity by identifying and eliminating the causes of out of control conditions.  Establishes a predictable and consistent level of quality.  Eliminates or reduces the need for receiving inspection by the customer.
  • 3.
    BASIC S.P.C. All production processes have inherent variation. That is, no two pieces produced are exactly alike if measured with enough precision. Variation can be categorized in terms of "common" and "special" causes: •Common cause variation occurs where a stable process makes products that vary within a predictable range. •Special cause variation results from unpredictable events such as nonconforming raw material, a broken tool, or a power sag. SPC gives us the tools to measure the degree of both types of variation with the goal being to eliminate special causes altogether, and systematically attack common causes to reduce them over time. Control charts and capability studies are the main tools used to describe processes graphically. Control charts are composed of sampling results taken over time that are plotted as points on special graphs. Different kinds of control charts accommodate variable or attribute sampling.
  • 4.
    BASIC S.P.C. VARIABLE & ATTRIBUTE CHARACTERISTICS A variable characteristic is a measurable feature such as height, width, or weight. Variable control charts are composed of two graphs. The top graph monitors process statistical location. It measures whether the process is adjusted properly, comparing the calculated process average to the print nominal or target value. The bottom graph monitors process variation. ********************************************************** An attribute characteristic is a countable feature such as go/no-go, present/not present or number of defects. Attribute control charts are composed of only one graph that monitors lot-to-lot variations in terms of percent or number nonconforming. While the target for nonconformities is always zero, many unrefined processes exhibit common-cause variation causing a "predicted" nonconforming level above zero.
  • 5.
    BASIC S.P.C. BASIC STEPS OF S.P.C.  All tasks are to be performed during production  At predetermined intervals, select a subgroup of sample products from the process (while it is running)  Measure the specified characteristic of each sample  Record the measurement values on a control chart  Calculate two values for each subgroup:  Average of the samples (X)  Range between the highest and lowest values (R)  Plot each subgroup value as a point on the corresponding chart  Draw a line to connect each point to the previous point on the chart  Analyze the patterns that develop as points are added to the charts
  • 6.
    BASIC S.P.C. X – R CHART The X & R chart is actually two charts, and is the most commonly used method of tracking variable characteristics. Only one characteristic can be recorded on each chart.  The X chart monitors subgroup averages  The R chart monitors subgroup ranges  A central line, which is a solid line across each chart, represents the average of the subgroup values  On an X chart, it’s labeled X, and represents the average of all the subgroup averages  On an R chart, it’s labeled R, and represents the average of all of the subgroup ranges  Control limits, which appear as dashed lines across each chart, represent the expected range of variation for the subgroup values  The upper control limits is typically labeled UCL  The lower control limit is typically labeled LCL  The LCL on the R chart is often zero, and is represented by the bottom edge of the graph
  • 7.
    BASIC S.P.C. DIFFERENCE BETWEEN CONTROL LIMITS AND SPECIFICATION LIMITS  Specification limits define an allowable amount of variation for a characteristic. These limits are determined when a product is designed.  Control limits identify the expected range of variation for a characteristic. These limits are based on the actual measurements of the characteristic, as found during processing. CALCULATING SUBGROUP VALUES To find the X value for a subgroup: • Add the values of all the sample measurements taken • Divide this sum by the number of samples To find the R value for a subgroup: • Find the largest and smallest values in the subgroup • Subtract the smaller value from the larger value
  • 8.
    BASIC S.P.C. 1 2 3 4 5 6 7 8 9 10 38 31 30 32 32 33 33 33 33 30 35 31 30 33 34 38 34 33 36 35 DATA FROM EACH 34 34 32 33 37 31 36 36 35 37 SUBGROUP 34 31 29 32 37 33 31 35 34 32 29 32 32 37 35 33 30 36 31 29 TOTAL 170 159 153 167 175 168 164 173 169 163 AVERAGE ( X ) 34.0 31.8 30.6 33.4 35.0 33.6 32.8 34.6 33.8 32.6 RANGE ( R ) 9 3 3 5 5 7 6 3 5 8 37 UPPER CONTROL LIMIT 36 CHART OF 35 THE 34 AVERAGES 33 X 32 (X) 31 30 LOWER CONTROL LIMIT 29 1 2 3 4 5 6 7 8 9 10 SUBGROUPS 18 16 CHART OF 14 THE 12 UPPER CONTROL LIMIT RANGES 10 8 (R) 6 R 4 2 1 2 3 4 5 6 7 8 9 10 SUBGROUPS
  • 9.
    BASIC S.P.C. PROCESS CAPABILITY AND PERFORMANCE Process capability is a measure of the ability of a process to produce products that meet required specifications. It is measured by taking variable measurements over TIME from a process that is statistically stable (only common cause variation present). Process capability is typically reported as a measurable referred to as the CpK value. Cpk attempts to answer the question “will my process continue to meet specifications in the long run?" Process capability evaluation can only be done after the process is brought into statistical control. The reason is simple: Cpk is a prediction based on variation within a subgroup, and one can only predict something that is stable. Think of the Cpk as the potential performance, or the potential capability. Cpk is the CAPABILITY of your process if all instability (special causes) were removed (or ignored). Process performance is the actual state of the process at some moment in time. In essence, a snap shot of the process now. In a minute, hour, day, or week later it probably will be different. Process performance is typically reported as a measurable referred to as the PpK value. Ppk attempts to answer the question "does my current production sample meet specification?“ Ppk is how the process is actually performing at the time you made the measurements. Think of Ppk as being the actual PERFORMANCE of your process, incorporating all observed variation within the subgroups.
  • 10.
    STOGRAM 6 5 S.P.C. 4 3 BASIC 2 1 CAPABILITY31 32 33 34 HISTOGRAMS 29 30 ANALYSIS: 35 36 37 38 10 9 X 8 X 7 X X STOGRAM 6 X X X X 5 X X X X X 4 X X X X X X X 3 X X X X X X X X X HISTOGRAMS 2 X X X X X X X X X X 1 X X X X X X X X X X 29 30 31 32 33 34 35 36 37 38 10 9 X 8 X 7 X X 6 X X X X 5 X X X X X 4 X X X X X X X 3 X X X X X X X X X 2 X X X X X X X X X X 1 X X X X X X X X X X 29 30 31 32 33 34 35 36 37 38 VARIABLE DATA - NORMAL CURVE 1 2 3 4 5 6 7 8 9 10 38 31 30 32 32 33 33 33 33 30 35 31 30 33 34 38 34 33 36 35 DATA FROM EACH 34 34 32 33 37 31 36 36 35 37 SUBGROUP 34 31 29 32 37 33 31 35 34 32 29 32 32 37 35 33 30 36 31 29 TOTAL 170 159 153 167 175 168 164 173 169 163 AVERAGE ( X ) 34.0 31.8 30.6 33.4 35.0 33.6 32.8 34.6 33.8 32.6 RANGE ( R ) 9 3 3 5 5 7 6 3 5 8
  • 11.
    BASIC S.P.C. Cpk > 1.33 (Capable ) Cpk = 1 to 1.33 (Barely Capable) This process should produce This process will produce less than 64 PPM >64 PPM but < 2700 PPM A Highly Capable Process : Voice of the A Barely Capable Process : Voice of the Process < Specification Process = Customer Specification ******************************************** Cpk < 1 (Not Capable ) Cpk < 1 (Not Capable ) This process will also produce This process will produce more than 2700 PPM more than 2700 PPM A Non-Capable Process : Voice of the A Non-Capable Process : Voice of the Process > Customer Specification Process > Customer Specification
  • 12.
    BASIC S.P.C. CONTROL CHART INTERPRETATION NATURAL PATTERNS: • Points remain within the control limits and vary randomly on both sides of the central line • Most points fall near the central line • Some points fall closer to both control limits • No points should fall beyond either control limit •The process is: • In statistical control • Producing products within the expected limits of variation • Operating as well as possible without adjustments • Stable and predictable • Variation is due to common causes – normal factors not easily identified or eliminated from a process • Represents a normal distribution UNNATURAL PATTERNS: • The process is: • Out of statistical control •Unstable and unpredictable •Producing unexpected variation among products • Variation may be due to assignable causes – unusual factors that can be identified and eliminated from a process •Common types are outliers, trends, runs or sudden changes in level
  • 13.
    BASIC S.P.C. CONTROL CHART INTERPRETATION NORMAL DISTRIBUTION: Points vary randomly on either side of the central line and remain within the control limits OUT OF CONTROL CONDITION (OCC): One or more points outside of the upper or lower control limits (requires a user note and immediate corrective action)
  • 14.
    BASIC S.P.C. CONTROL CHART INTERPRETATION TRENDS: A series of 6 or more consecutive points which either ascend or descend across the chart; indicates a problem with the process which must be addressed RUNS: A series of 6 or more consecutive points which fall either above or below the central line
  • 15.
    BASIC S.P.C. DATALYZER SPECTRUM LEGEND ICONS