Downloaded 40 times
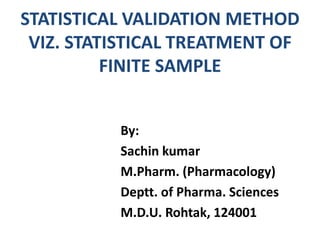
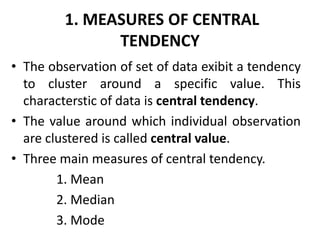
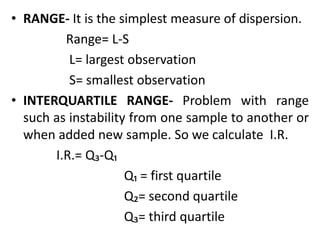
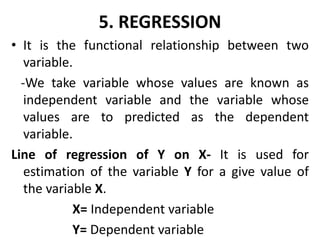
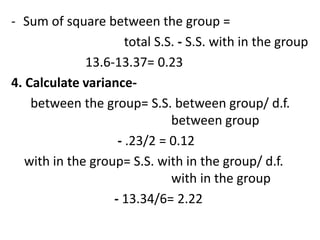
![• Median- Central value when arranging in ascending
or descending order. Denoted by ‘M’.
for ungrouped data-
n is odd→ M = [(n+1)/2]th value
n is even →
M = [ (n/2)th value + (n/2 +1)th value ] /2
for grouped data-
M = L+ [ (n/2-F)/f ] x c
L= lower limit of median class
F= frequency of the class preceding
the median class
c= width of the median interval](https://image.slidesharecdn.com/biostat-170331172433/85/Biostat-8-320.jpg)
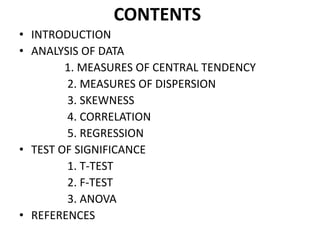
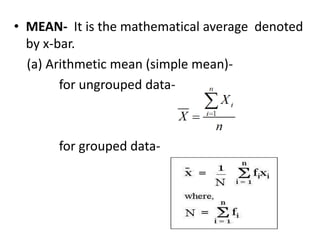
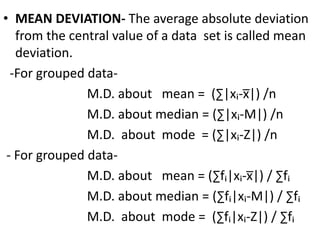
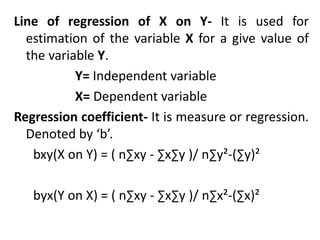
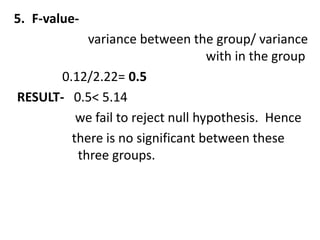
![MODE- Most commonly occuring value
-for ungrouped data-
which occurs maximum no. of times
-for grouped data-
mode= L+ [( f₁-f₀) / 2f₁- f₀-f₂]x c
L= lower limit of mode class
f₀= frequency of class preceding the m.c.
f₁ = frequency of class succeeding the m.c.
f₂= frequency of mode class
c= width of mode class
mode class= class which have maximum frequency](https://image.slidesharecdn.com/biostat-170331172433/85/Biostat-9-320.jpg)


This document describes various statistical validation methods used to analyze finite sample data, including measures of central tendency, dispersion, skewness, correlation, and regression. It also discusses different types of statistical tests like the t-test, F-test, and ANOVA that are used to test hypotheses and determine statistical significance. The document provides examples and formulas for calculating various statistical measures and performing tests on sample data sets.


