STD Mukesh - Ambient Air Quality Criteria
•
2 likes•386 views

The document discusses proposed revisions to ambient air quality criteria and standards in India. It reviews the health effects and dose-response relationships of several key air pollutants including benzene, carbon monoxide, formaldehyde, polycyclic aromatic hydrocarbons, arsenic, lead, mercury, nickel, vanadium, and oxides of nitrogen. For each pollutant, it discusses current levels in India, existing standards, rationale for proposed new standards based on health risks, and comparisons with standards in other countries. The approach focuses on establishing standards to protect human health based on toxicological data and risk assessments.

Recommended
Recommended
More Related Content
What's hot
What's hot (20)
Similar to STD Mukesh - Ambient Air Quality Criteria
Similar to STD Mukesh - Ambient Air Quality Criteria (20)
More from ECRD IN
More from ECRD IN (20)
Recently uploaded
Recently uploaded (20)
STD Mukesh - Ambient Air Quality Criteria
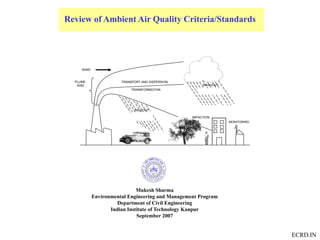
- 1. ECRD.IN Review of Ambient Air Quality Criteria/Standards MONITORING FALLOUT PLUME RISE WIND TRANSPORT AND DISPERSION IMPACTION WASHOUT TRANSFORMATION Mukesh Sharma Environmental Engineering and Management Program Department of Civil Engineering Indian Institute of Technology Kanpur September 2007
- 2. ECRD.IN
- 3. ECRD.IN 1 n i i NOAEL RfD UF MF 1 n i i LOAEL RfD UF MF UF = 10H x 10A x 10S Long-term Effects
- 4. ECRD.IN
- 5. ECRD.IN Slope factor, Cancer Potency factor or Unit Risk factor Slope factor = risk/(mg/kg-day) Unit Risk Factor = risk/(µg/m3)
- 6. ECRD.IN • For comparison, Table 5-2 summarizes the risk of dying from some causes of death. 2 x 10⁻⁶, or 1/500,000Air Travel: 1 transcontinental trip/year 10-5, or 1/100,0001,000Bicycling 1.2 x 10⁻⁵, or 1/83,33325,000Home accidents 4 x 10⁻⁵, or 1/25,000Football (averaged over participants) 7.7 x 10⁻⁵, or 1/13,00016,339Falls 10-4, or 1/10,000400Truck driving 2.2 x 10⁻⁴, or 1/4,54546,000Motor vehicle 3 x 10⁻⁴, or 1/3,333--Fire fighting 1.3 x 10⁻³, or 1/770180Coal mining accident 2.0 x 10⁻³, or 1/500541,532Cancer 2.7 x 10⁻³, or 1/370724,859Heart attack 8 x 10⁻³, or 1/1251,135Black lung disease Individual Risk per Year# of Deaths in Rep. YearCause of Death
- 7. ECRD.IN Example Acceptable Air Concentration = Target Risk /(Unit risk factor) Target risk = 1x 10⁻⁵ ; URF = 1 x10⁻³ (µg/m3)-1 Concentration = 1x 10⁻⁵ / 1 x10⁻³ (µg/m3)-1 = 0.01 µg/m3
- 8. ECRD.IN S.No. Pollutant 1 Carbon Monoxide (CO) 2 Lead (Pb) 3 Oxides of Nitrogen (NOx) 4 Ozone (O3) 5 Sulphur Dioxide (SO2) 6 PM10 7 PM2.5 8 Benzene Soluble Fraction (BSF) 9 Formaldehyde (HCHO) 10 Poly-aromatic Hydrocarbons (PAH) 11 Arsenic 12 Nickel 13 Mercury 14 Vanadium 15 Benzene Pollutants for Standard Formulation
- 9. ECRD.IN •general description of the pollutant, •dose-response based health risk evaluation, •current levels in the country, •current standards, •basis for new standards and associated risk •comparison ______________________________________________________________ • dose-response relationship developed/published in Indian •others and WHO. ______________________________________________________________ •cost of implementation of the standards •implication to development projects •primary criterion for suggesting the standard is human health. Approach
- 10. ECRD.IN Benzene
- 12. ECRD.IN Current Levels at Kanpur Industrial Area Commercial area Average 30 ug/m3
- 13. ECRD.IN Current Levels at Kolkota
- 14. ECRD.IN
- 15. ECRD.IN Unit Risk Factor = 6 x10⁻⁶ S.no Risk Concentration 1 1/10000 17 ug/m3 2 1/00000 1.7 ug/m3 3 1000000 0.17 ug/m3 proposed annual average standard for the benzene 7.0µg/m3.
- 16. ECRD.IN
- 19. ECRD.IN Current Levels Significant Violation but decreasing trend
- 20. ECRD.IN
- 21. ECRD.IN COHb level is not to exceeded, 2% The proposed standards are with factor of safety of 2: · 20.0 mg/m3 (17 ppm) for 1 hour · 6.0 mg/m3 (5 ppm) for 8 hours.
- 22. ECRD.IN Carbon Monoxide Standards (1 hour) of Different Countries 0 5 10 15 20 25 30 35 40 45 European Union Standards United States Standards WHO guideline Bangkok China South Korea Sri Lanka Bangladesh Indonesia Seoul Surabaya Japan Vietnam Hong Kong Philippines Australia Brazil Canada New Zealand Norway Sweden India (Proposed) Countries conc. (mg/m3)
- 23. ECRD.IN Carbon Monoxide Standards (8 hour) of Different Countries 0 5 10 15 20 25 European Union Standards United States Standards WHO guideline Bangkok China South Korea Sri Lanka Bangladesh Indonesia Seoul Surabaya Japan Vietnam Hong Kong Philippines Australia Brazil Canada New Zealand Norway Sweden India (Proposed) Countries conc. (mg/m3)
- 25. ECRD.IN Cancer Risk: Based on a dose–response model developed by CIIT, the additional risk of respiratory cancer associated with a lifelong exposure ranging from 1.23 and 123 μg/m3 in non-smokers ranged from 2.3 × 10⁻¹⁰ to 2.7 × 10⁻⁸. The risk of cancer associated with formaldehyde level is negligible. Non-Cancer LOAEL for Eye irritation: 1,230 μg/m3 and the NOAEL was 615 μg/m3. Another study found a subclinical inflammatory response at 615 μg/m3 Health Canada established for short-term (1-hour averaged) exposures at 123 μg/m3 (100 ppb) (one-tenth of LOAEL). guideline for long-term (8-hour averaged) exposure based on NOAEL 50 μg/m3 (40 ppb). WHO guideline value is 100 µg/m3 for 30 minutes. Significant increases in signs of irritation occur at levels above 0.1 mg/m3
- 26. ECRD.IN proposed standards: · 80 µg/m3 for 1-hour average · 45 µg/m3 for 8-hours average The current measured values are: 10 –90 µg/m3
- 27. ECRD.IN POLYCYCLIC AROMATIC HYDROCARBON (PAH)
- 28. ECRD.IN BaP Is most studied and critical PAH species
- 29. ECRD.IN
- 30. ECRD.IN
- 31. ECRD.IN A unit risk for BaP is 8.7 × 10⁻⁵ (ng/m3)-1 (WHO 1987) 1 1/10000 1.2 ng/m3 2 1/00000 0.12 ng/m3 3 1000000 0.012ng/m3 Air Toxic Pollutants Standard upto 2010 Ambient Air Quality Standard After 2010 Benzo(a) Pyrene, 5 ng/m3 1 ng/m3 Compound Limit value Guide value Measuring Period Netherlands PAH 5 ng/m3 .0.5 ng/m3 annual WHO-AQG PAH 1.0 ng/m3 annual Proposed new EU PAH indicator parameter i.e. Benzo(a)pyrene Std. is 6.0 ng/m3.
- 32. ECRD.IN ARSENIC At an air concentration of 1 μg/m3 an estimate of lifetime risk is 1.5 x10⁻³. S.no Risk Concentration 1 1/10000 66 ng/m3 2 1/00000 6.6 ng/m3 3 1000000 0.66 ng/m3 NIOSH has recommended air levels c should not exceed 2 µg/m3 during any part of the workday. Ontario MOE adopted an Ambient Air Quality Criterion (AAQC) of 0.3 μg/m3 as a 24-hour guideline Proposed annual standard Annual- 6.6 ng/m3 and 24- hr- 0.2 μg/m3
- 34. ECRD.IN 1. It appears that 1 μg lead per m3 air directly contributes approximately 19 μg lead per litre blood in children and about 16 μg per litre blood in adults, although it is accepted that the relative contribution from air is less significant in children than in adults. 2. It must be taken into account that, in typical situations, an increase of lead in air also contributes to increased lead uptake by indirect environmental pathways. To correct for uptake by other routes as well, it is assumed that 1 μg lead per m3 air would contribute to 50 μg lead per litre blood. 3. It is recommended that efforts be made to ensure that at least 98% of an exposed population, including preschool children, has blood lead levels that do not exceed 100 μg/l. In this case, the median blood lead level would not exceed 54 μg/l. On this basis, the annual average lead level in air should not exceed 0.5 μg/m3 . This proposal is based on the assumption that the upper limit of non-anthropogenic lead in blood is 30 μg/l.
- 35. ECRD.IN In view of points 1, 2, and 3 – Proposed Standard •1.0 µg/m3 for 24-hour average •0.5 µg/m3 for annual average
- 36. ECRD.IN Mercury The LOAELs for mercury vapour are around 15-30 µg/m3. Applying an uncertainty factor of 20 (10 for uncertainty due to variable sensitivities in higher risk populations and, on the basis of dose-response information, a factor of 2 to extrapolate from a LOAEL to a likely NOAEL), a guideline for inorganic mercury vapour of 1 µg/m3 as an annual average has been established. An increase in ambient air levels of mercury will result in an increase in deposition in natural bodies of water, possibly leading to elevated concentrations of methylmercury in freshwater fish. Such a contingency might have an important bearing on acceptable levels of mercury in the atmosphere
- 37. ECRD.IN Proposed standard (annual): 1 µg/m3 Levels observed in Singurali area was 10 ng/m3 REVISION?
- 38. ECRD.IN Nickel On the basis of one inhalation study, the US Environmental Protection Agency (EPA) classified nickel subsulfide as a class A carcinogen and estimated the maximum likelihood incremental unit risk to be 1.8–4.1 × 10⁻³ (ug/m3)-1. However, this study involves only exposure to nickel subsulfide. It is not known whether this compound is present in ambient air, but since it is probably one of the most nickel potent compounds, this risk estimate may represent an upper limit. WHO estimated an incremental unit risk of 4 × 10⁻⁴ (μg/m3)-1 calculated from epidemiological results.
- 39. ECRD.IN S.no Risk Concentration 1 1/10000 250 ng/m3 2 1/00000 25 ng/m3 3 1000000 2.5 ng/m3 With unit risk of 4 × 10⁻⁴ (μg/m3)-1 Proposed Standard is : 20 ng/m3 EU fixed annual limit as 20 ng/m3.
- 40. ECRD.IN VANADIUM Chronic exposure to vanadium compounds revealed a continuum in the respiratory effects, ranging from slight changes in the upper respiratory tract, with irritation, coughing and injection of pharynx, detectable at 20 μg/m3, to more serious effects such as chronic bronchitis and pneumonitis, which occurred at levels above 1 mg/m3. LOAEL for Vanadium can be taken as 20 μg/m3 and taking a safety factor of 20, the prposed 24-hr standard is 1 μg/m3
- 42. ECRD.IN
- 43. ECRD.IN Summer PM10 Variation Summer NOx Variation Time Series : 1998-2004 New Delhi Average PM10: 400 ug/m3 d[NOx]/dt = 10 ug/m3-yr NOx , SO2and PM10 Interlinked
- 44. ECRD.IN WHO has published Air Quality Guidelines for Europe (WHO 2000, 2003, 2005) as basis for fixing AQS. The lowest observable acute effect level for NO2 was near 0.2 to 0.3 ppm based on clinical studies showing increased airway responsiveness in asthmatics. WHO propose a 50% margin of safety because of additional evidence of possible effects below 0.2 ppm. These include a statistically significant increase in response to a bronchoconstrictor (increased airway responsiveness) with exposure to 190 μg/m3 (0.1 ppm) in one study (Orehek et al. 1976) and a pooled analysis suggested changes in airway responsiveness in asthmatics below 365 μg/m3 (0.2 ppm). On the basis of these human clinical data, the WHO (2000) proposed a 1-hour guideline of 200 μg/m3 (0.106 ppm). The WHO 2000 report stated, “Outdoor epidemiological studies have found qualitative evidence of ambient exposures being associated with increased respiratory symptoms and lung function decreases in children (annual average concentrations of 50–75 μg/m3 (0.026– 0.040 ppm or higher)
- 45. ECRD.IN Proposed Standards: No 1-hr level has exceeded 300 μg/m3 even at ITO 24-hr average : 80 μg/m3 These standards are to provide safety to mild/moderate asthmatics and children. Healthy individuals have reported no short-term effects up to 2-4 ppm NO2 annual average ambient air quality standard CARB establish a new annual average standard for NO2 at 0.030 ppm (57 μg/m3) , not to be exceeded. The earlier standard was 100 μg/m3. Proposed Standard: 60 μg/m3 (CPCB current standard is adequate).
- 46. ECRD.IN
- 47. ECRD.IN Ozone
- 48. ECRD.IN Exercise ~ Vol/min has significant bearing
- 49. ECRD.IN
- 50. ECRD.IN Reduction in FEV1 and Ozone Concentration ( <2hr Exposure) 0 5 10 15 20 0 0.2 0.4 0.6 Ozone Concntraton, ppm ReductioninFEV1,% Durng Exercise At Rest Alexis et al (2000) Blomberg et al (1997) Montuschi et al (2002) McDounell et al (2002) Proposed Standard (1-hr) = 0.1 ppm or 100 ppb = 180 ug/m3 This also prevents ill effects during exercise and it is conservative enough as it will be 1-hr standard.
- 51. ECRD.IN Reduction in FEV1 and Ozone Concentration ( 6-8 hr Exposure) 0 5 10 15 20 25 0 0.05 0.1 0.15 0.2 0.25 Ozone Concntraton, ppm ReductioninFEV1,% Proposed Standard (8-hr) = 0.05 ppm = 90 ug/m3
- 52. ECRD.IN
- 53. ECRD.IN
- 55. ECRD.IN
- 56. ECRD.IN
- 57. ECRD.IN
- 58. ECRD.IN
- 59. ECRD.IN
- 60. ECRD.IN PEF = C1 + a1PM10; a1=-.031 at PM10 = 100 PEF will be less than 5%
- 61. ECRD.IN WHO (2000) has not suggested any safe level annual averages. WHO report indicates that there is no threshold for particulate concentration below which there is no harmful effect. Considering that background levels of annual PM10 levels itself is 35 µg/m3, the standard should be much above 35 µg/m3. It is suggested that all efforts must be made to bring down the annual PM10 levels at least by a factor which should be more than 2. Therefore an annual standard of 60 µg/m3 is proposed. Proposed PM10 Standards 24-hr Average: 100 µg/m3 Annual Average: 60 µg/m3
- 62. ECRD.IN PM2.5 There are only a few studies in India that have measure PM2.5 (e.g. Sharma and Maloo 2005). Since measurements of PM2.5 are too few to draw any meaningful conclusion, it was decided to use the data set of PM2.5 and take 0.8 fraction of PM10 as PM2.5. The annual background level of PM2.5 for northern cities is estimated as 28 µg/m3 and for southern cities as 17 µg/m3
- 63. ECRD.IN WHO (2000) has not suggested no safe level PM2.5. Considering that background levels of annual PM2.5 levels itself is 28 µg/m3, the standard should be much above 28 µg/m3. If we examine Figure 12.5 carefully, we find that at a concentration of PM2.5 as 60 µg/m3, the average deficit (of about 2 percent) in PEFR is 5 L/min. Taking average PEFR as 250 L/min for healthy adult this reduction is only about 2 percent. Further from model (based on 39 persons) given in Table 12.2, the average deficit in PEFR is about 1.8 L/min at PM2.5 concentration of 60 µg/m3. It is therefore, proposed that 24-hr standard for PM2.5 is set at 60 µg/m3. PM2.5, PEFvs Time (Cohort - JC Site) 0.00 30.00 60.00 90.00 120.00 150.00 180.00 1 2 3 4 5 6 7 8 9 10 11 12 13 14 15 Time (Days) PM2.5(mg/m3 ) -15.00 -5.00 5.00 15.00 25.00 35.00 45.00 PEF(L/min) PM2.5 dPEF
- 64. ECRD.IN Relative Risk of Cardiopulmonary mortality for North Zone 0.8 0.9 1.0 1.1 1.2 1.3 1.4 1.5 1.6 1.7 1.8 Patna Chandigarh Bhilai Raipur Korba Delhi Ahmedabad Ankaleshwar Surat Vadodara Vapi Rajkot Jamnagar Faridabad YamunaNagar Jamshedpur Bhopal Indore Jabalpur Nagda Satna Talcher Rourkela Rayagada Ludhiana Jalandhar MandiGobindgarh Kota Alwar Jodhpur Udaipur Jaipur Anpara Varanasi Lucknow Gajraula Kanpur Noida Dehradun Kolkata Howrah Haldia City RelativeRisk Mean Relative Risk Aceptable Relative Risk To bring mean RR down to 1.05 across all cites for Cardiopulmonary Mortality Required PM2.5 (annual) = 40 ug/m3 … this also ensures RR for lung cancer at 1.08 Cardiopulmonary mortality is about 15 times higher than Lung cancer mortality
- 65. ECRD.IN Proposed Annual standard PM2.5 = 40 ug/m3
- 66. ECRD.IN PM 2.5 for India 0 50 100 150 200 250 1 2 3 4 5 6 7 8 9 10 11 12 13 14 15 16 17 18 19 20 21 22 23 24 25 26 27 28 29 30 31 32 33 34 35 36 37 38 39 40 41 42 43 44 45 46 47 48 49 50 51 52 53 54 55 56 57 58 59 60 61 62 City PM2.5µg/m^3 Mean PM 2.5 Aceptable PM 2.5 1. Salem …47. Delhi… 63. Jalandhar
- 67. ECRD.IN
- 68. ECRD.IN Mortality Model for PM2.5 (annual) Pope et al. (2002) Relative Risk (RR) Cardiopulmonary mortality RR = [(x+1)/(xo+1)]β β = 0.15515 (0.0562 – 0.2541) Lung-cancer mortality RR = [(x+1)/(xo+1)]β β = 0.2321 (0.08563 – 0.37873) x = PM2.5 (annual) xo= Background PM2.5 ug/m3
- 69. ECRD.IN Overall Death prevention and Deaths Prevented from PM2.5 Std 0 20 40 60 80 100 0 1 2 3 4 5 6 7 8 9 10 11 12 13 14 15 16 17 18 19 20 21 22 23 24 25 26 27 28 29 30 31 32 33 34 35 36 37 38 39 40 41 42 43 44 45 46 47 48 49 50 51 52 53 54 55 56 57 58 59 60 Cities %DeathsPrevented Overall Death prevented % PM2.5 Deaths prevented with Std, %
- 70. ECRD.IN Proposed PM10 Standards 24-hr Average: 100 µg/m3 Annual Average: 60 µg/m3 Proposed PM2.5 standards: 24-hr Average: 60 µg/m3 Annual Average: 40 µg/m3
- 71. ECRD.IN BENZENE SOLUBLE FRACTION (BSF) So Average Chemical Composition of PM2.5 The mutagenicity of air borne PM was shown to depend mainly on neutral and aromatic compounds. Hideeki et. al. (1991) has reported that the mutagenic activity of BSF from airborne particles was more in Ames Salmonella system. The study also revealed that the major portion (about 95%) of the BSF of air filter samples is neutral and aromatic hydrocarbon. BSF in coke oven emissions have been studied extensively to represent the aromatic fraction (large fraction being PAH). In fact, for BSF in PM in coke oven areas, a regulatory limit of 0.2 mg/m3 has been fixed (Mastrangelo et al., 1996). BSOF of total particulate has been generally accepted as an index of the health hazard.
- 72. ECRD.IN PM10 and BSOF Results of Vikas nagar station during 2003 0 100 200 300 400 500 600 2.01.03 28.01.03 10.02.03 27.02.03 03.03.03 28.03.03 10.04.03 29.04.03 01.05.03 02.05.03 10.06.03 27.06.03 01.07.03 30.07.03 12.08.03 27.08.03 12.09.03 29.09.03 10.10.03 03.11.03 19.11.03 04.12.03 18.12.03 yera 2003 PM10(ug/m3) 0 10 20 30 40 50 60 70 PM10(µg/m3) BSOF(µg/m3) BSOF IIT VN JC Delhi Concentrationsintheair(ug/m3) 0 50 100 150 200 250
- 73. ECRD.IN Location IIT (clean site) VN (Vikas Nagar) Residential JC (Juhi Colony) Residential %by w/w mg/m3 % by w/w mg/m3 % by w/w mg/m3 BSOF 9.874.79 9.13 7.03 40.0019.96 106.7162.3 10.327.99 48.4842.35 Proposed Standard for BSF As seen, BSF can be taken as an indicator of toxic components of PM. Although the work place standard for BSF has been reported as 200mg/m3 (Mastrangelo, 1996), the ambient air quality standard should be much lower. If one takes a safety factor of 10 (Asante-Duah, 1998 has suggested a factor of safety of 10 or higher), it gives an acceptable level of 20mg/m3 for BSF
- 74. ECRD.IN Current Standard Current standard in India for sulfur dioxide, Annual average is 80.0 µg/m3 (ppm) for industrial area, 60.0 µg/m3 (ppm) for residential, rural and other areas 15.0 µg/m3 (ppm) for sensitive areas and for 24- hours average is 120.0 µg/m3 (ppm) for industrial area 80.0 µg/m3 (ppm) for residential rural and other areas 30.0 µg/m3 (ppm) for sensitive areas. SO2
- 75. ECRD.IN
- 76. ECRD.IN For long-term exposure, assessments examined were on the prevalence of respiratory symptoms, respiratory illness frequencies, or differences in lung function values in localities with contrasting concentrations of sulfur dioxide and particulate matter, largely in the coal- burning era. The lowest-observed-adverse-effect level of sulfur dioxide was judged to be 100 μg/m3 (0.035 ppm) annual averages, together with particulate matter. People are in general exposed to mixture of pollutants due to which WHO had linked its guideline with corresponding values for particulate matter. That approach led to a previous guideline value of 125 μg/m3 (0.04 ppm) as a 24-hour average and 50 μg/m3 as an annual average, after applying an uncertainty factor of 2 to the lowest-observed-adverse-effect level. In more recent studies, adverse effects with significant public health importance have been observed at much lower levels of exposure. Nevertheless, there is still uncertainty as to whether sulfur dioxide is the pollutant responsible for the observed adverse effects or, rather, a surrogate for ultra-fine particles or some other correlated substance. As there was no basis for revising the 1987 guidelines for sulfur dioxide, WHO has recommended guideline values for 24 hours average as 125 and for annual average as 50 and this values are not linked with particles.
- 77. ECRD.IN proposed standards 80 µg/m3 for 24-hours average 50 µg/m3 for annual average
- 78. ECRD.IN Review of Criterion on Area-Classification for Existing AAQS
- 79. ECRD.IN
- 80. ECRD.IN
- 81. ECRD.IN Proposed Change In view of the discussions, it is recommended that there is no need to have area-based classification for air quality standards. However, no standards for sensitive area is being proposed as this is not possible to generic or blanket air quality standard without clearly understanding the sensitivity of the area that needs to be protected. For example, if a sensitive area shows sensitivity to contaminant ‘a’, it is only the contaminant ‘a’ for which more stringent standard is required and standard for other contaminants need not be redefined. It is recommended that all sensitive areas may be identified and to ensure full protection, there is a need to prescribe pollutants) specific standards specific to a sensitive area.
- 82. ECRD.IN