Download as PDF, PPTX
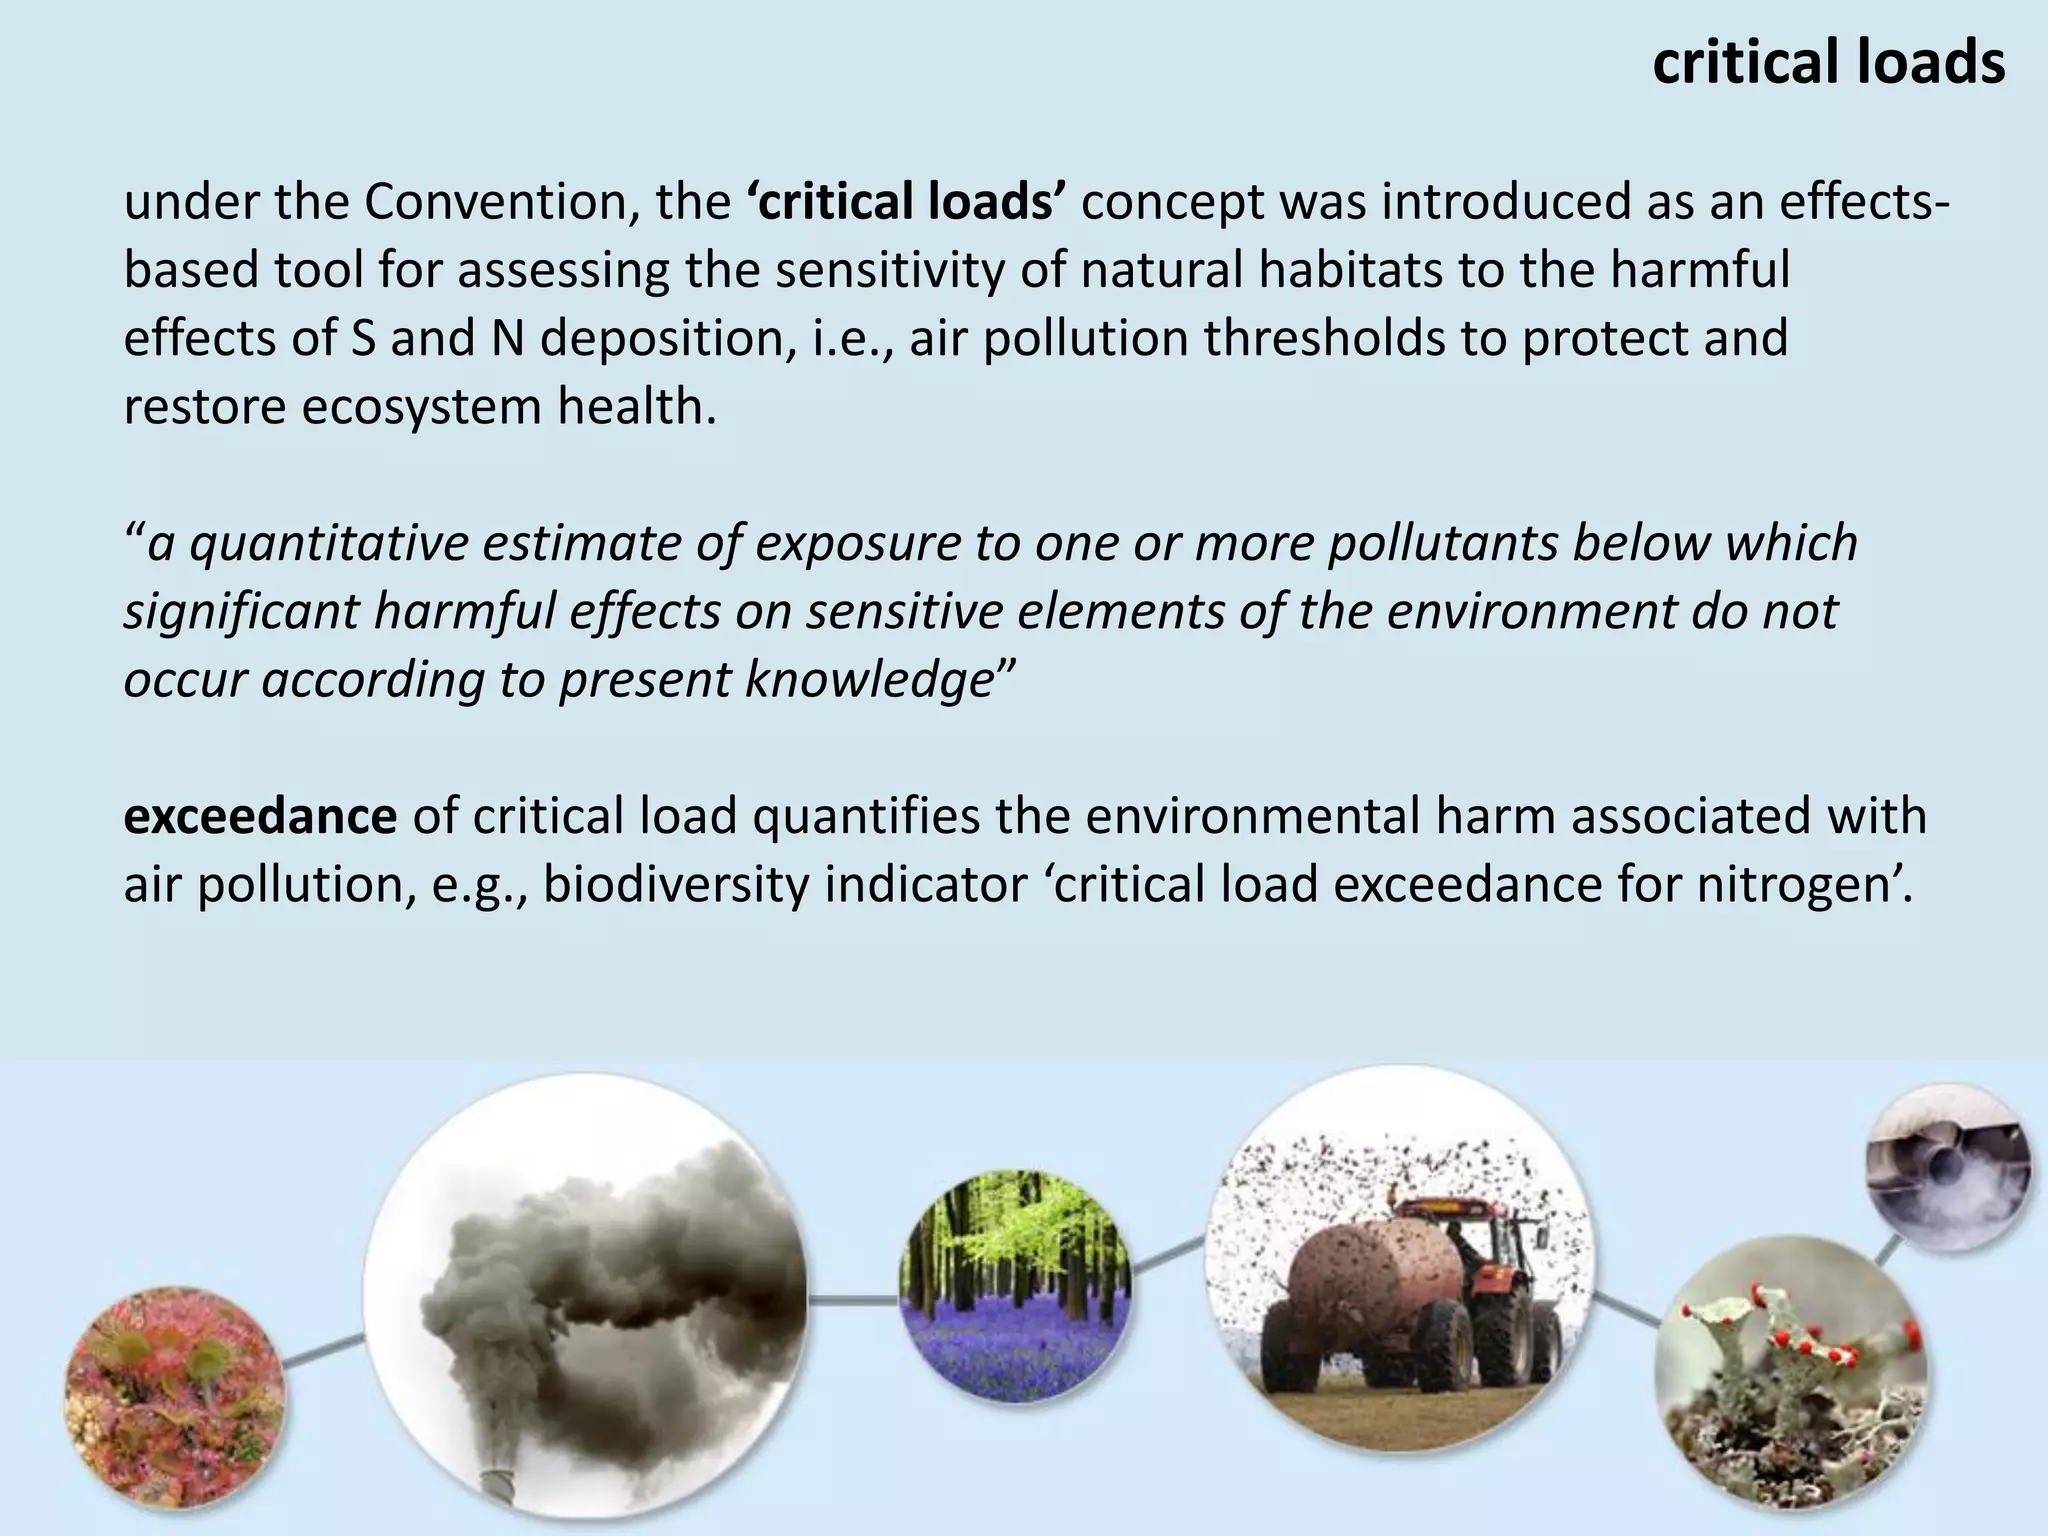
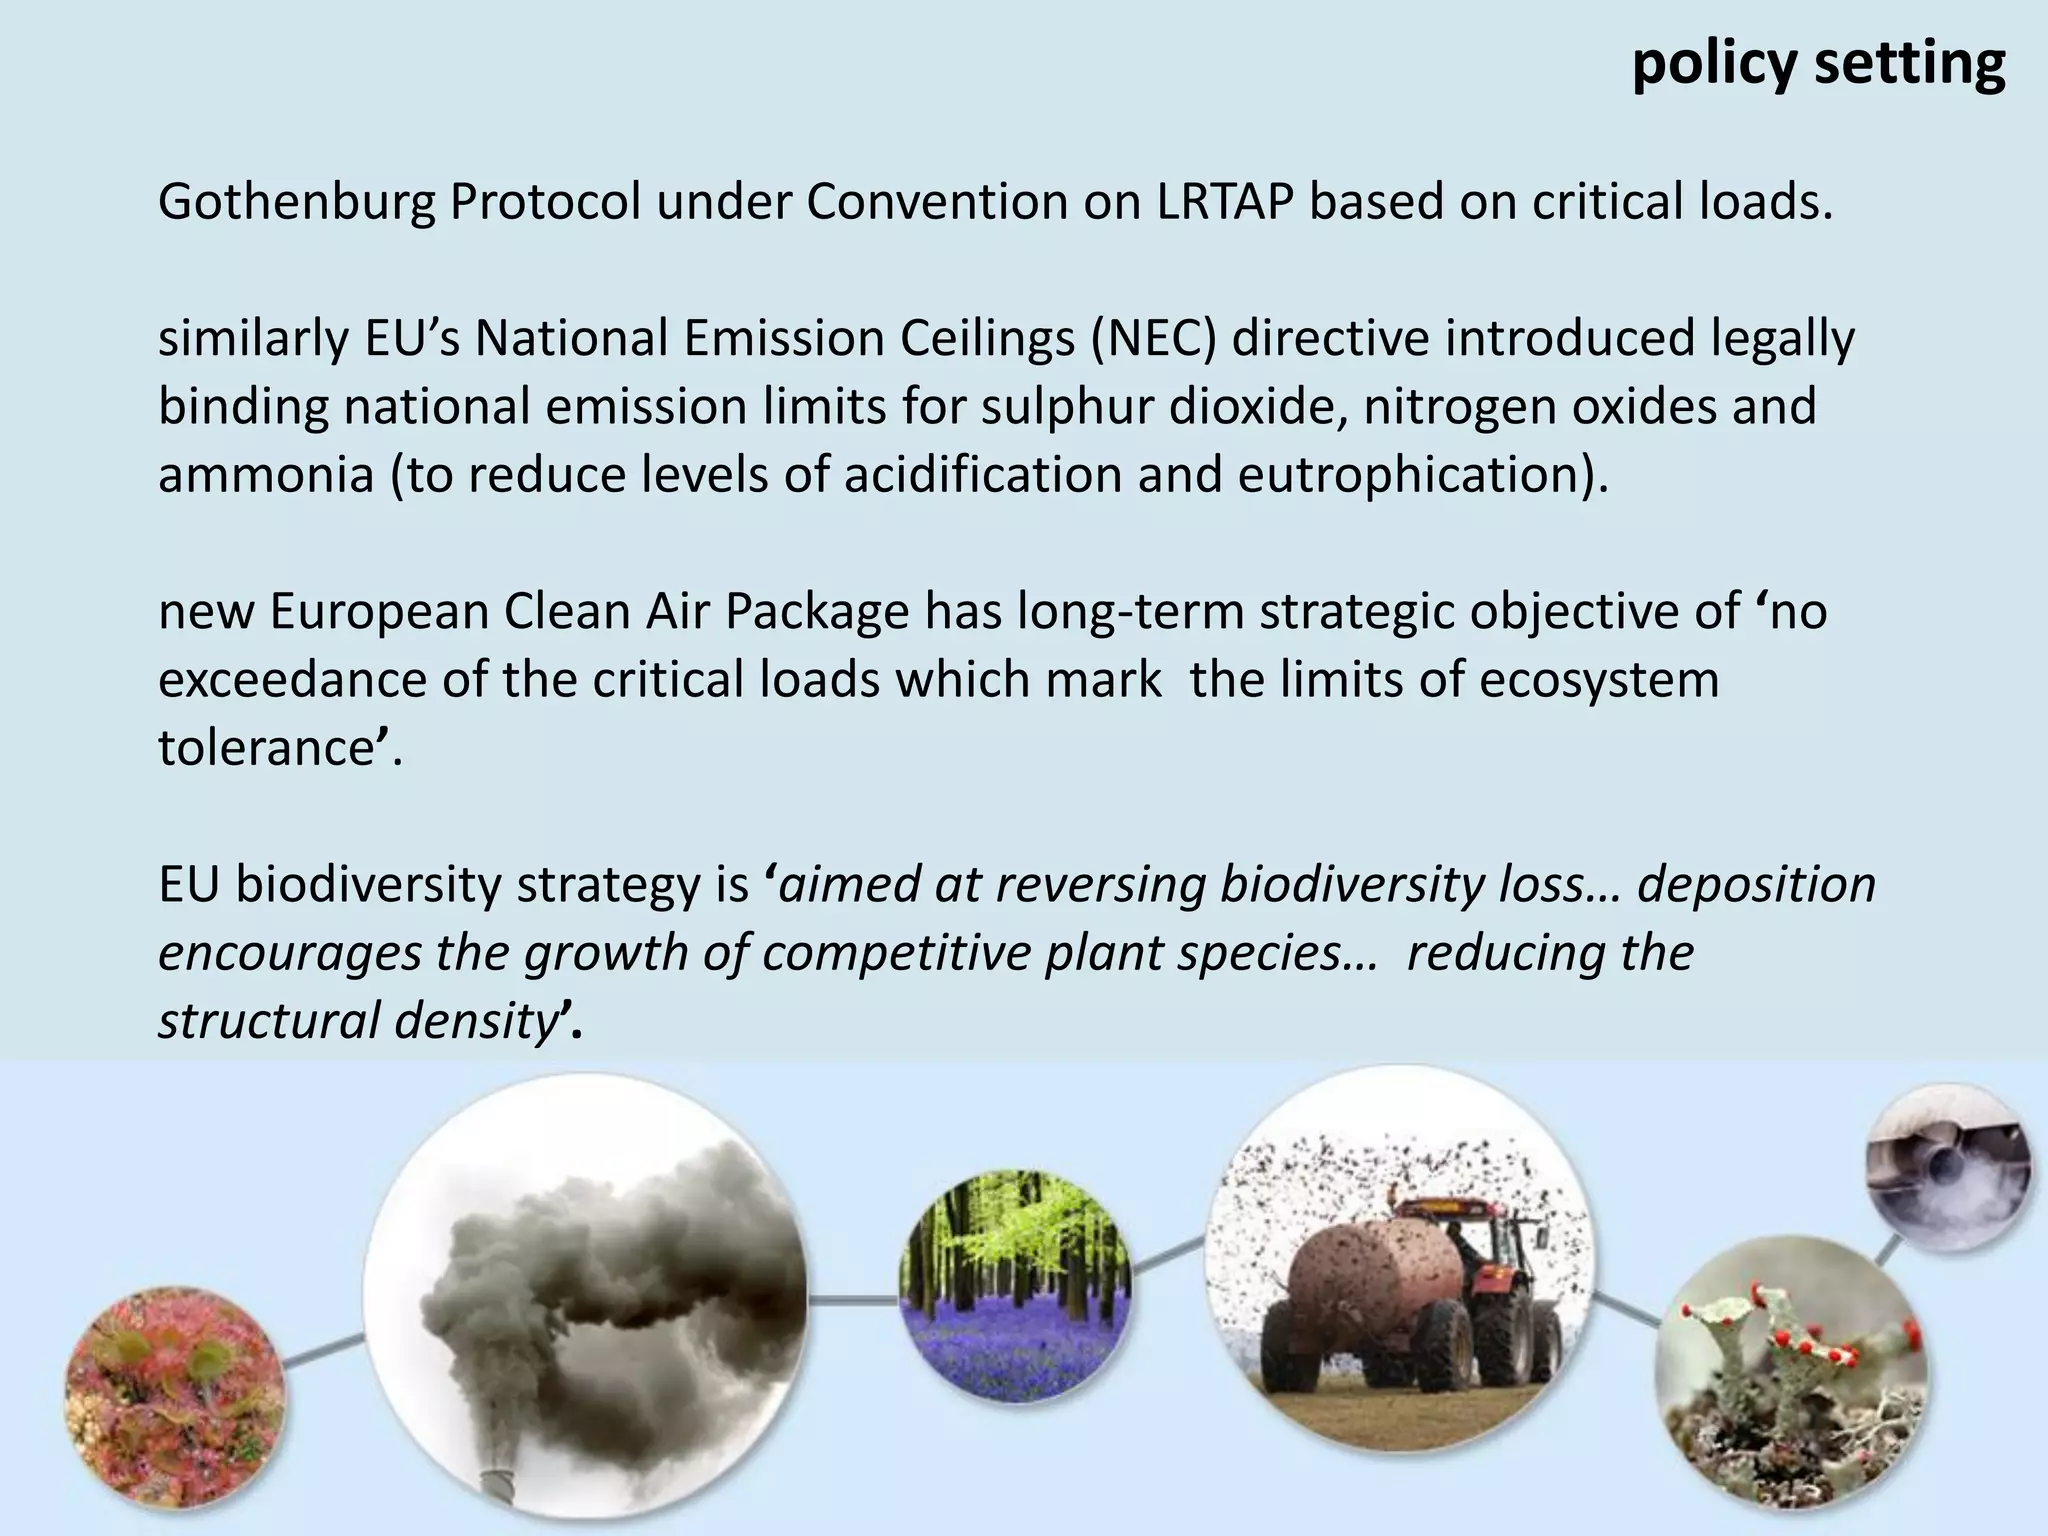
![critical loads—
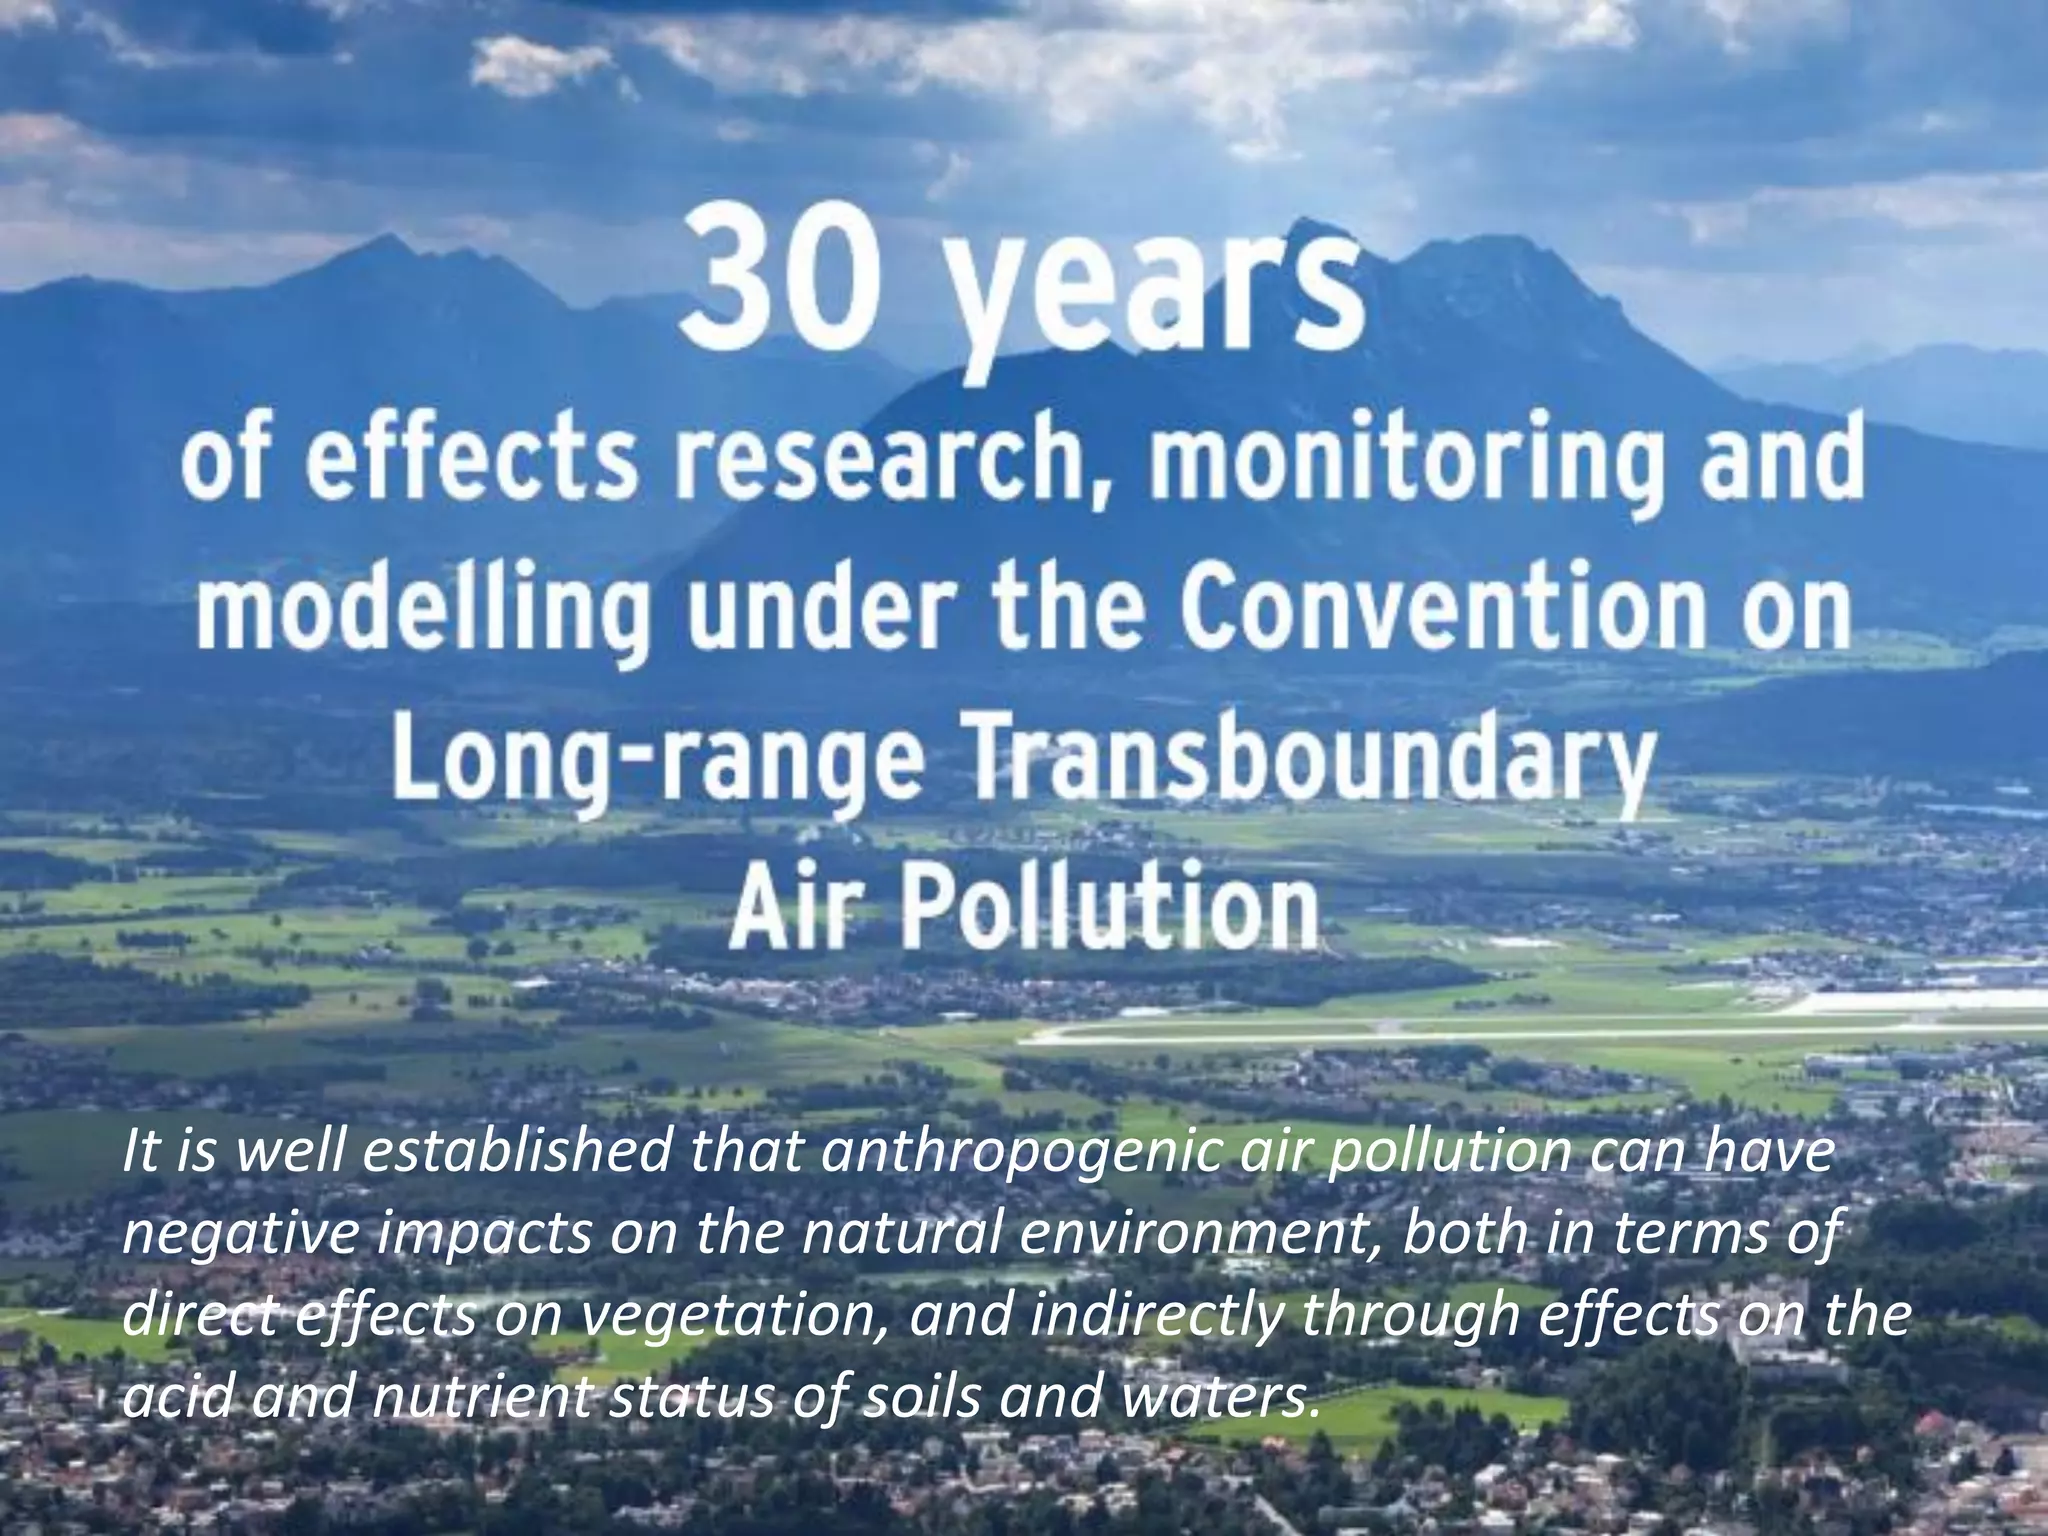
and ecosystem impacts of air pollutants
Clean Air Conference
Wood Quay Venue, Dublin City Council [28 September 2015]](https://image.slidesharecdn.com/criticalloads-jaherne-151008104314-lva1-app6891/75/Critical-loads-and-ecosystem-impacts-of-air-pollutants-1-2048.jpg)
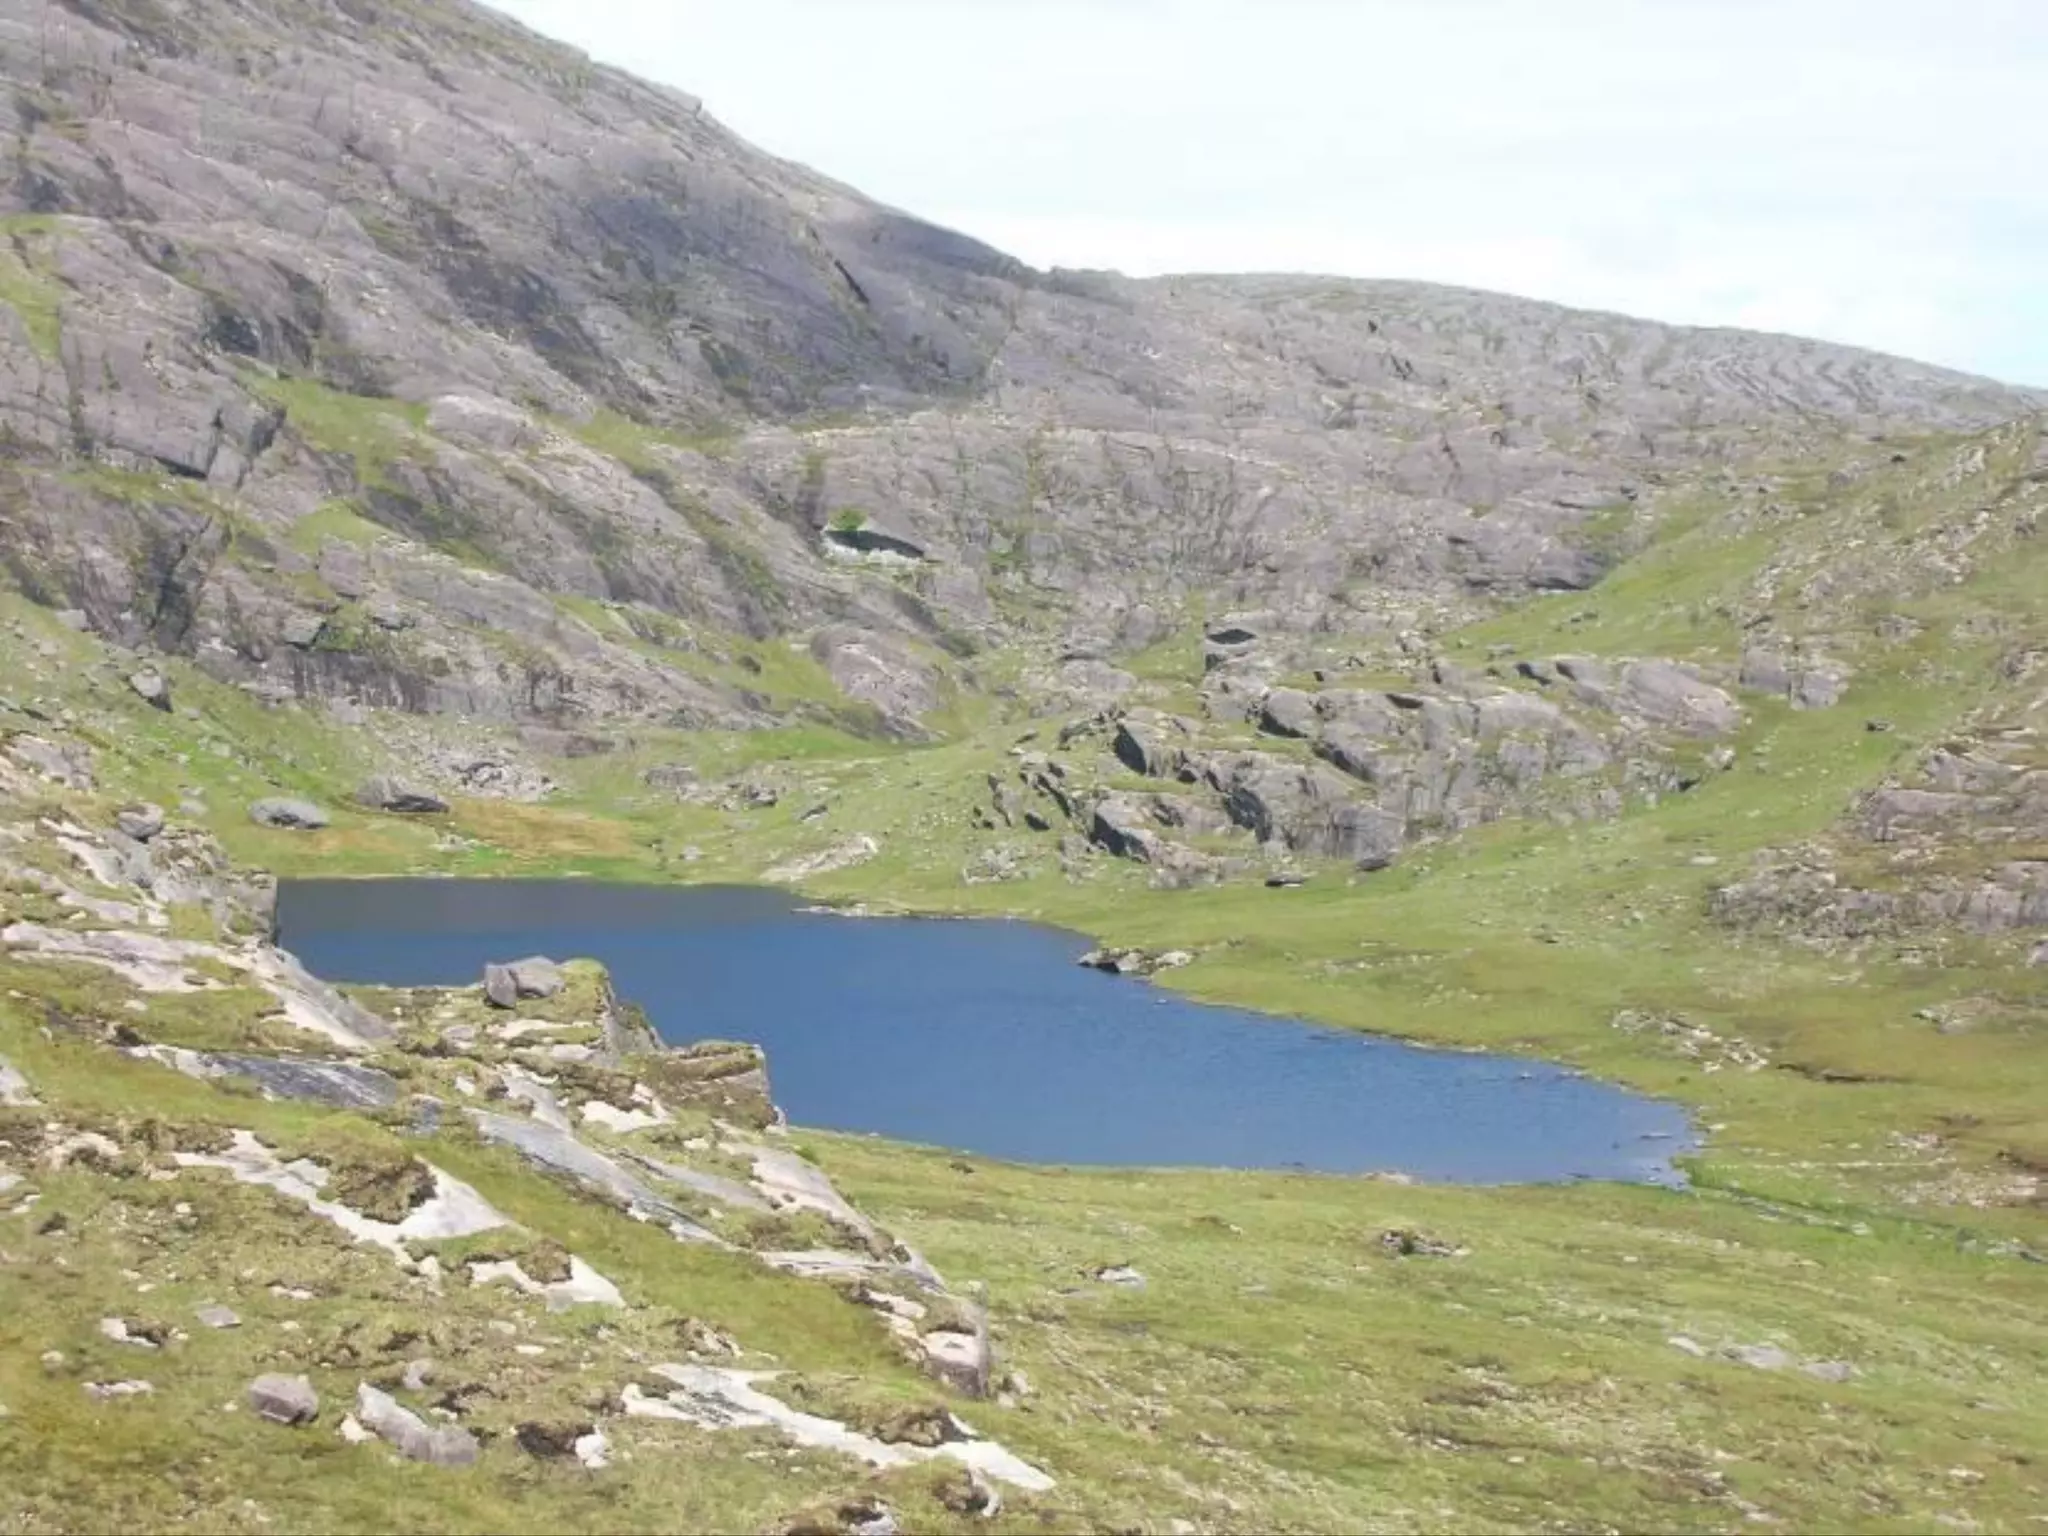
![upper lake Glendalough, Co. Wicklow
Long-term trend [1984–2010] in surface acidity [pH]](https://image.slidesharecdn.com/criticalloads-jaherne-151008104314-lva1-app6891/75/Critical-loads-and-ecosystem-impacts-of-air-pollutants-14-2048.jpg)
![3.0
3.5
4.0
4.5
5.0
5.5
6.0
6.5
7.0
1984 1989 1994 1999 2004 2009
pH: mid-lake observations [1984–2010]
pH: inflow 3 [1984–2010]](https://image.slidesharecdn.com/criticalloads-jaherne-151008104314-lva1-app6891/75/Critical-loads-and-ecosystem-impacts-of-air-pollutants-15-2048.jpg)
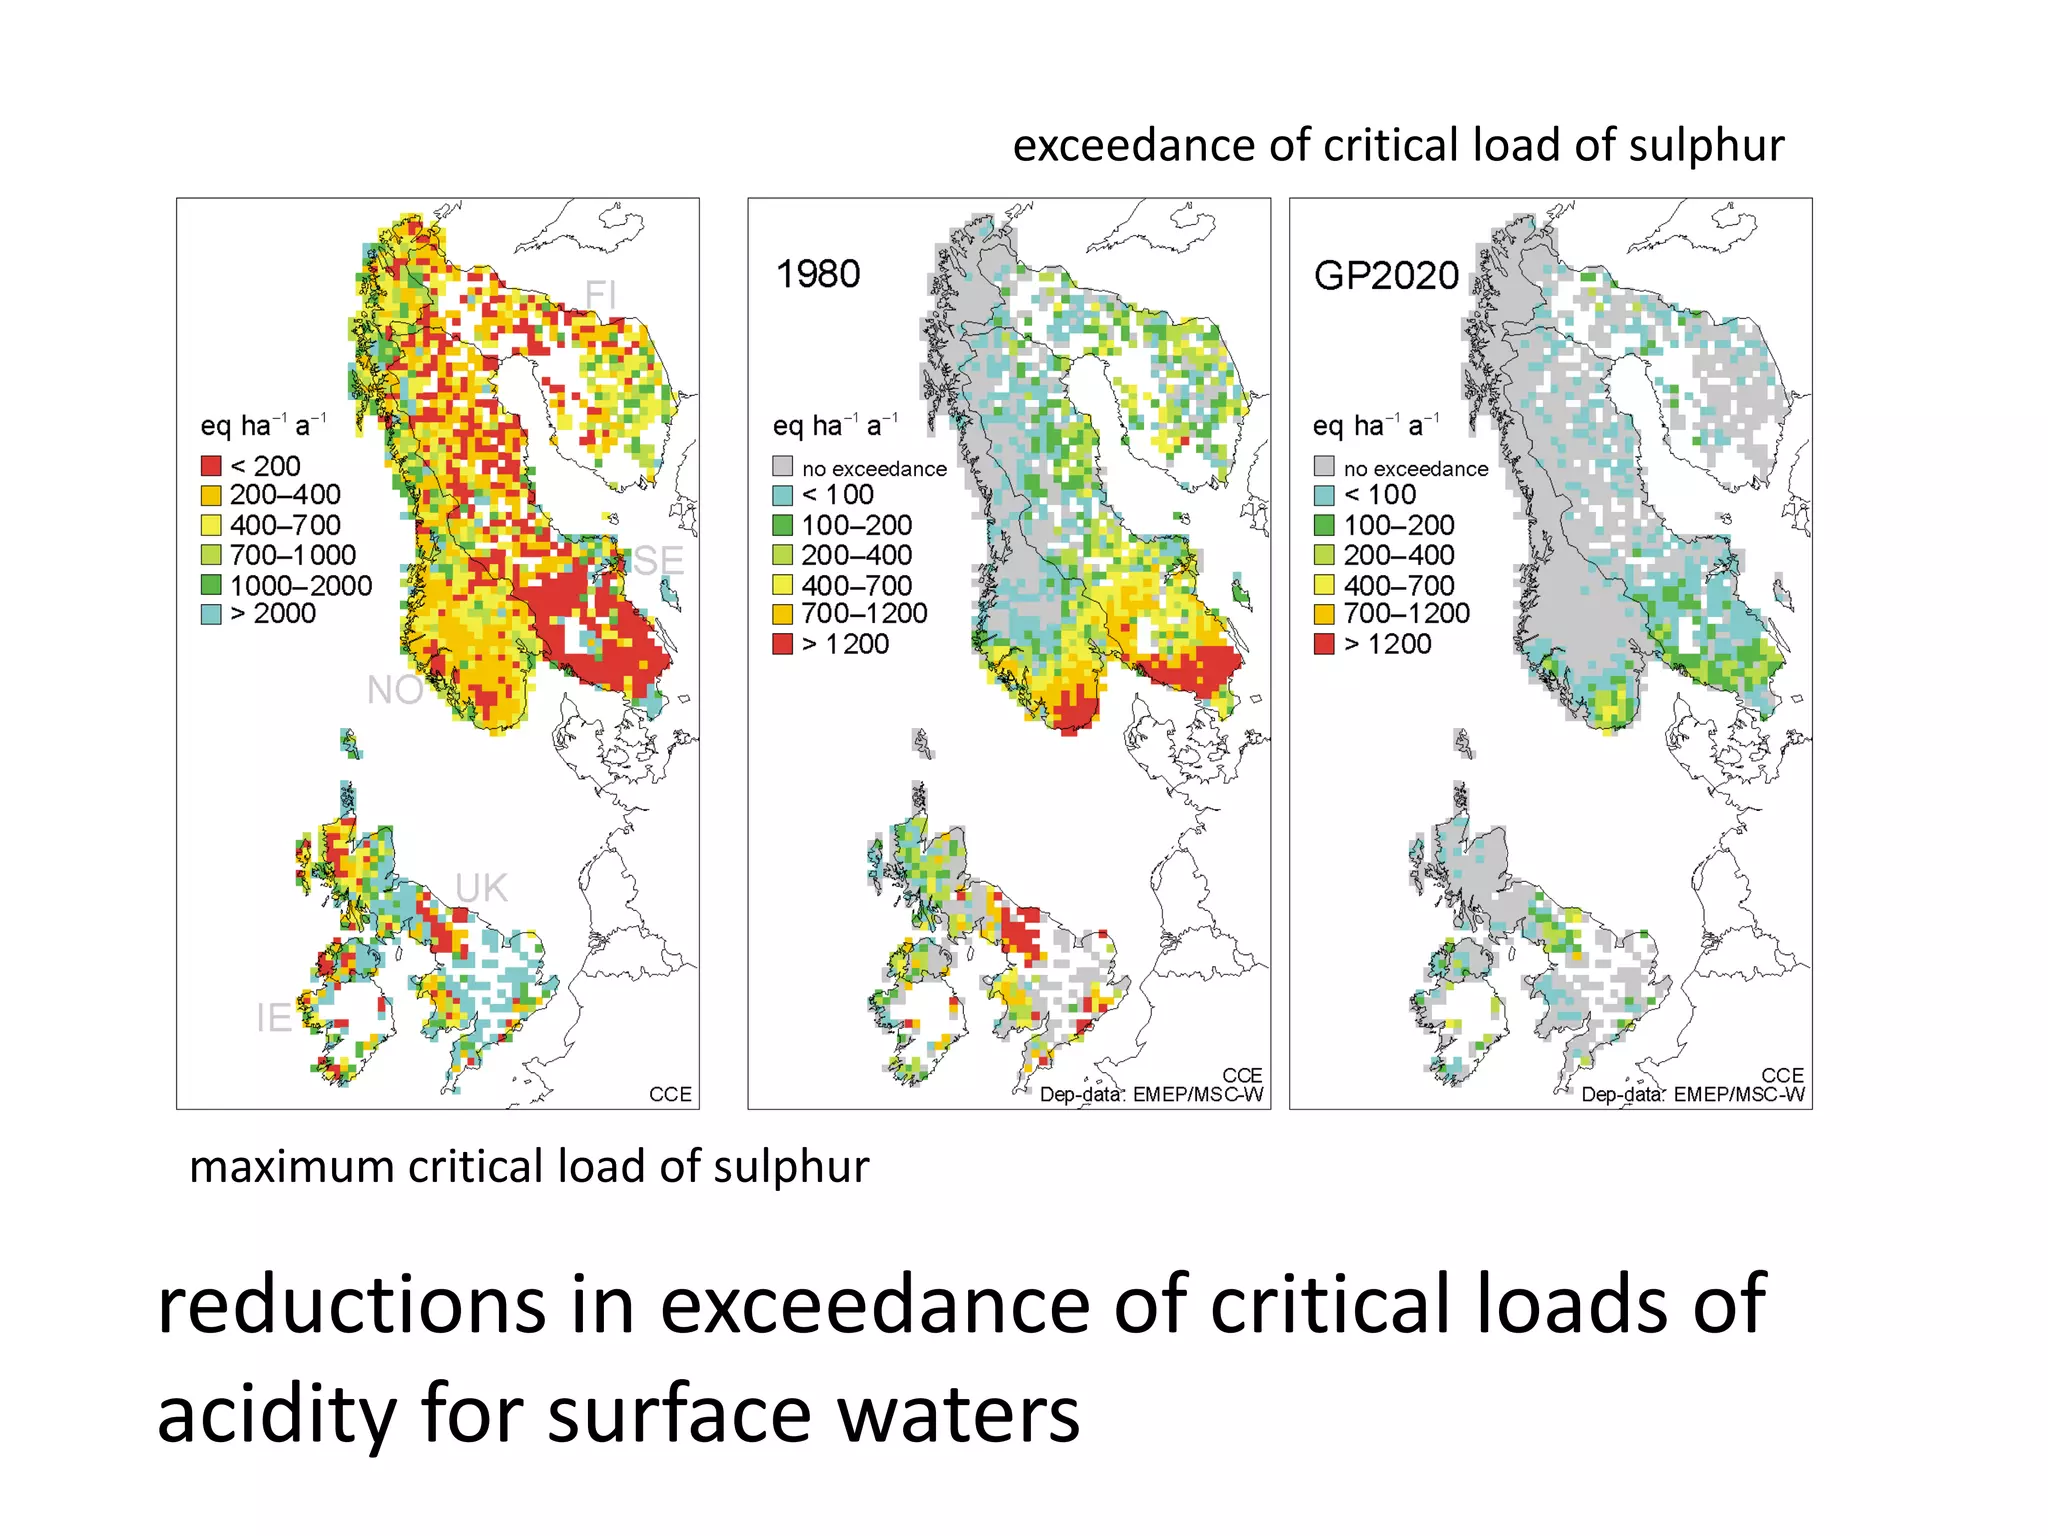
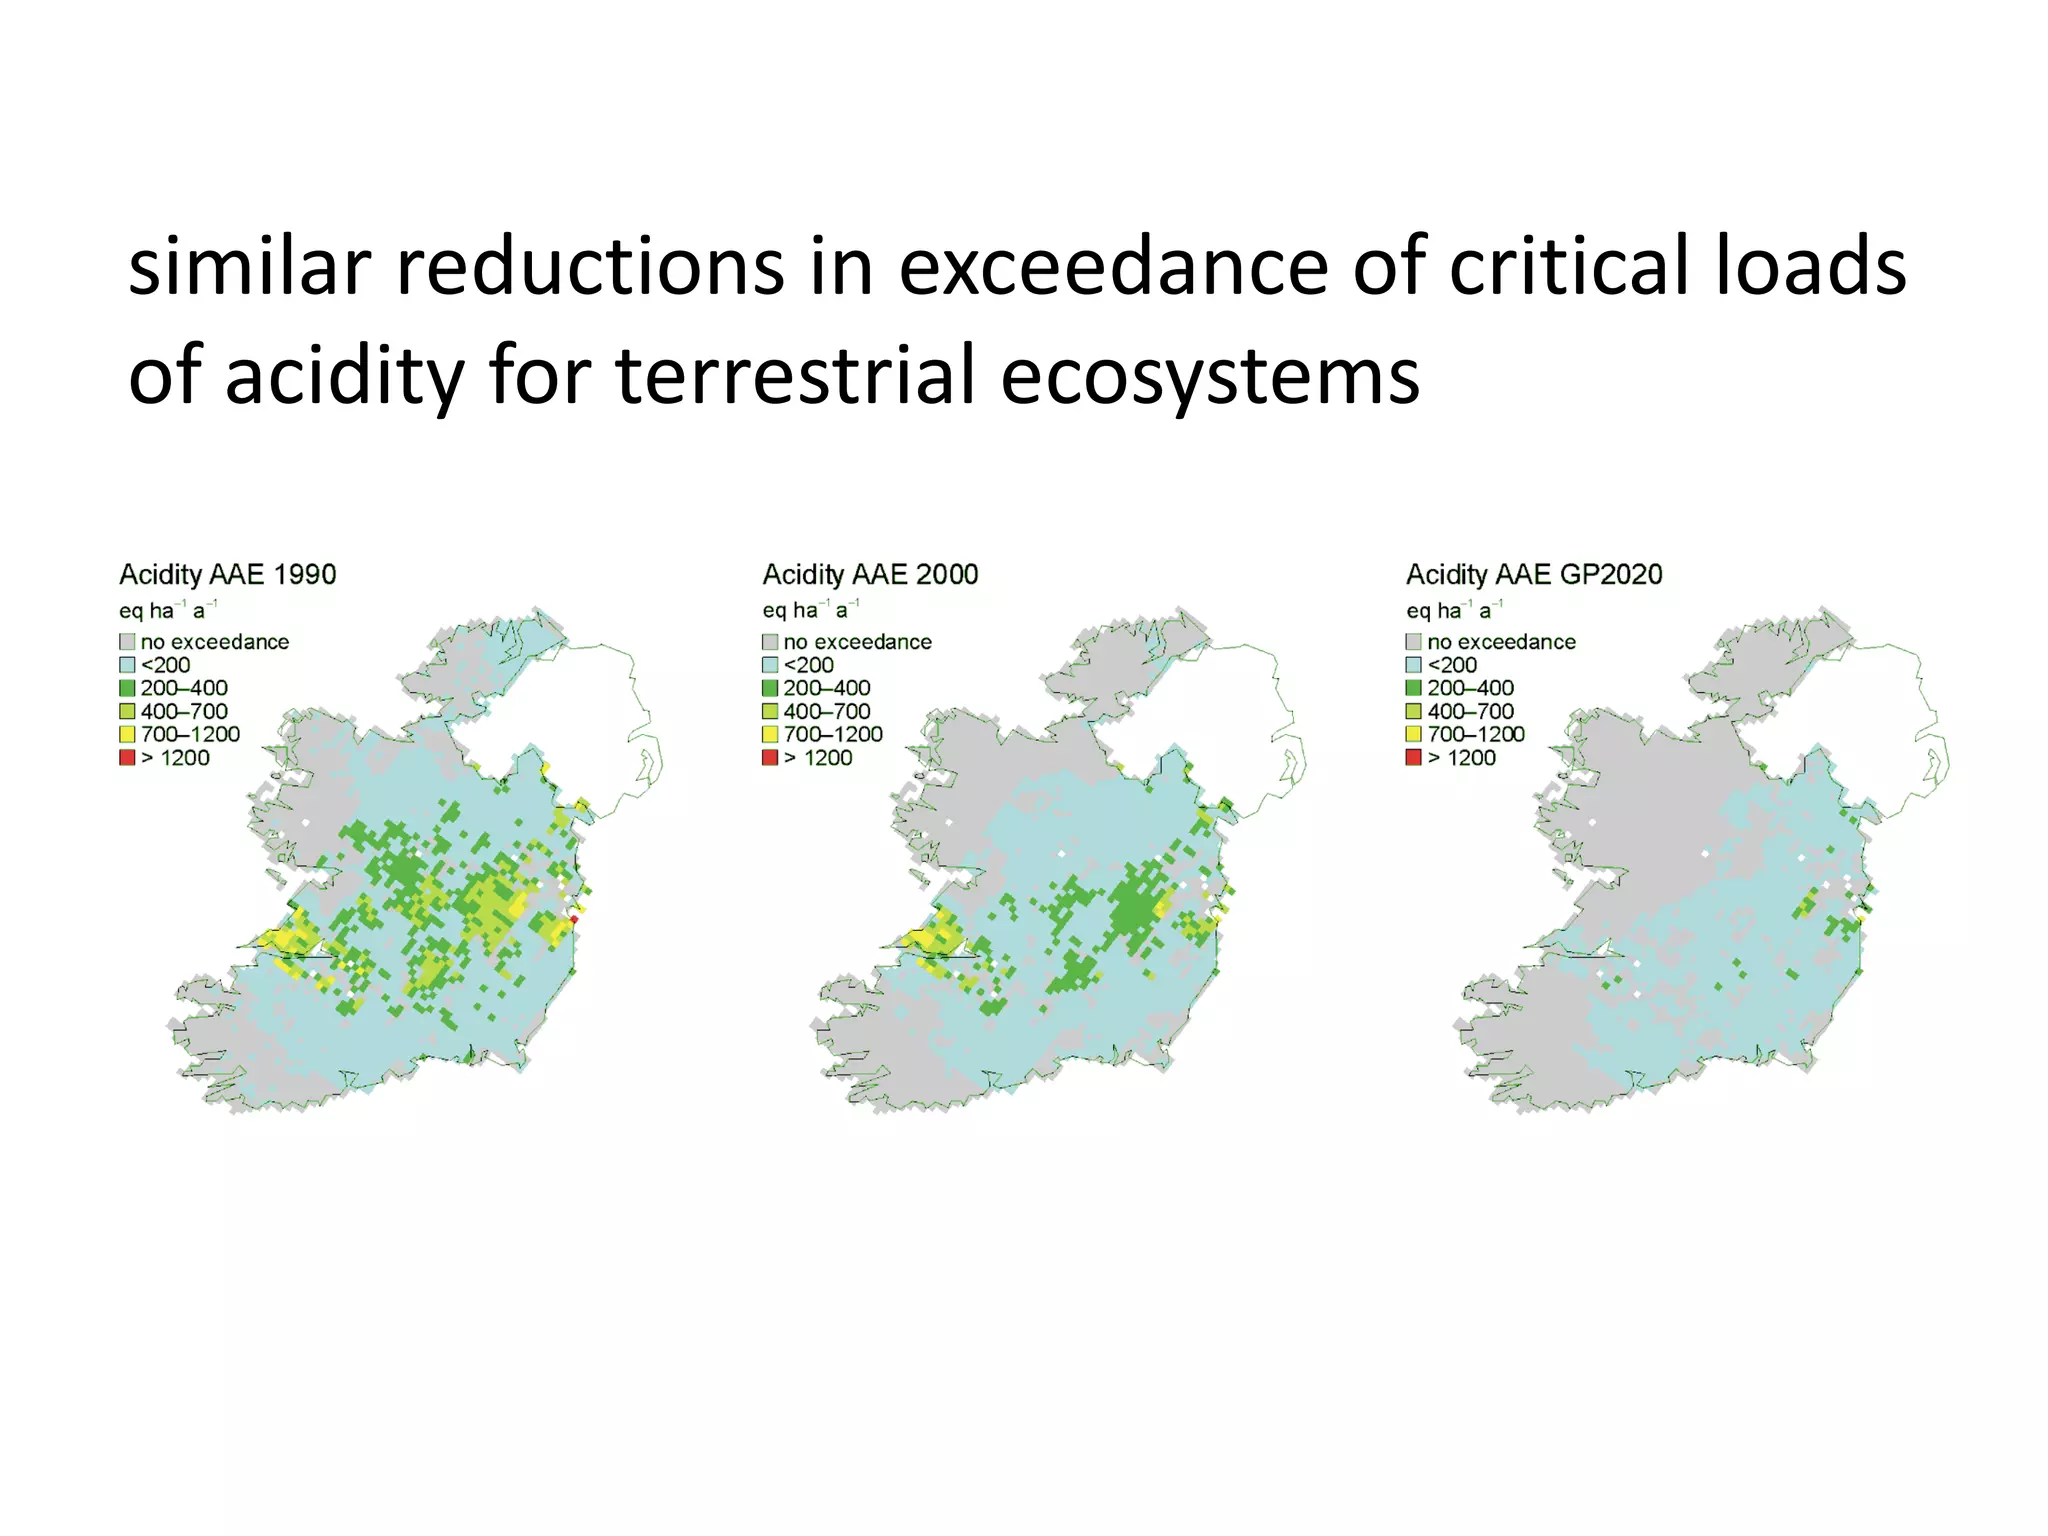
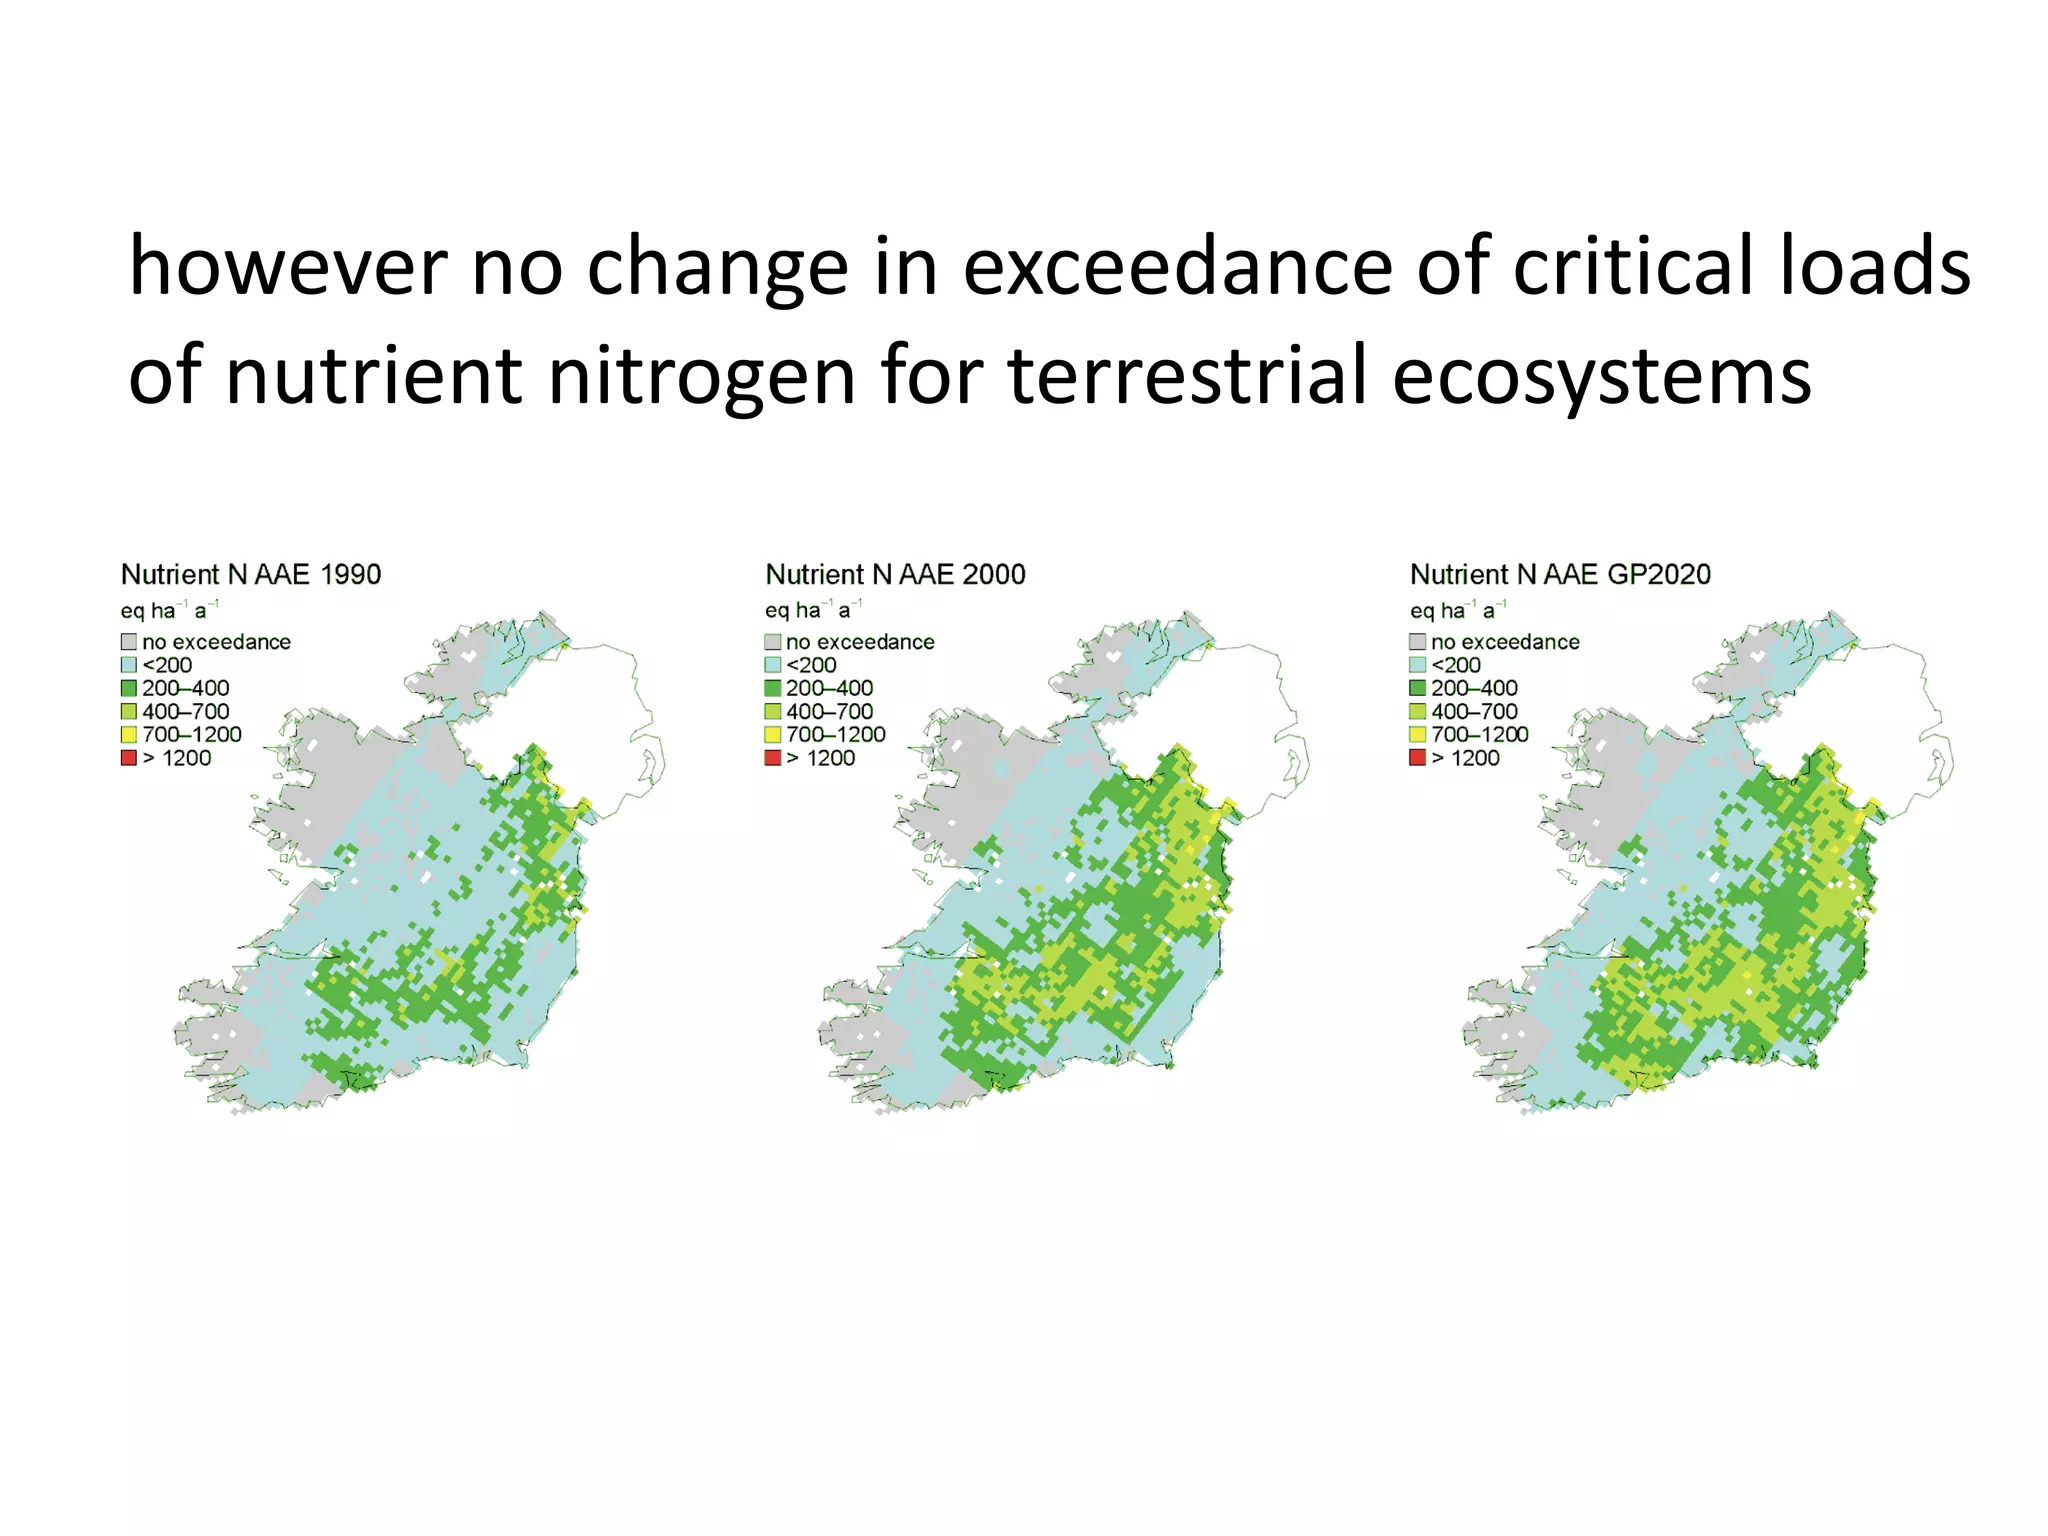
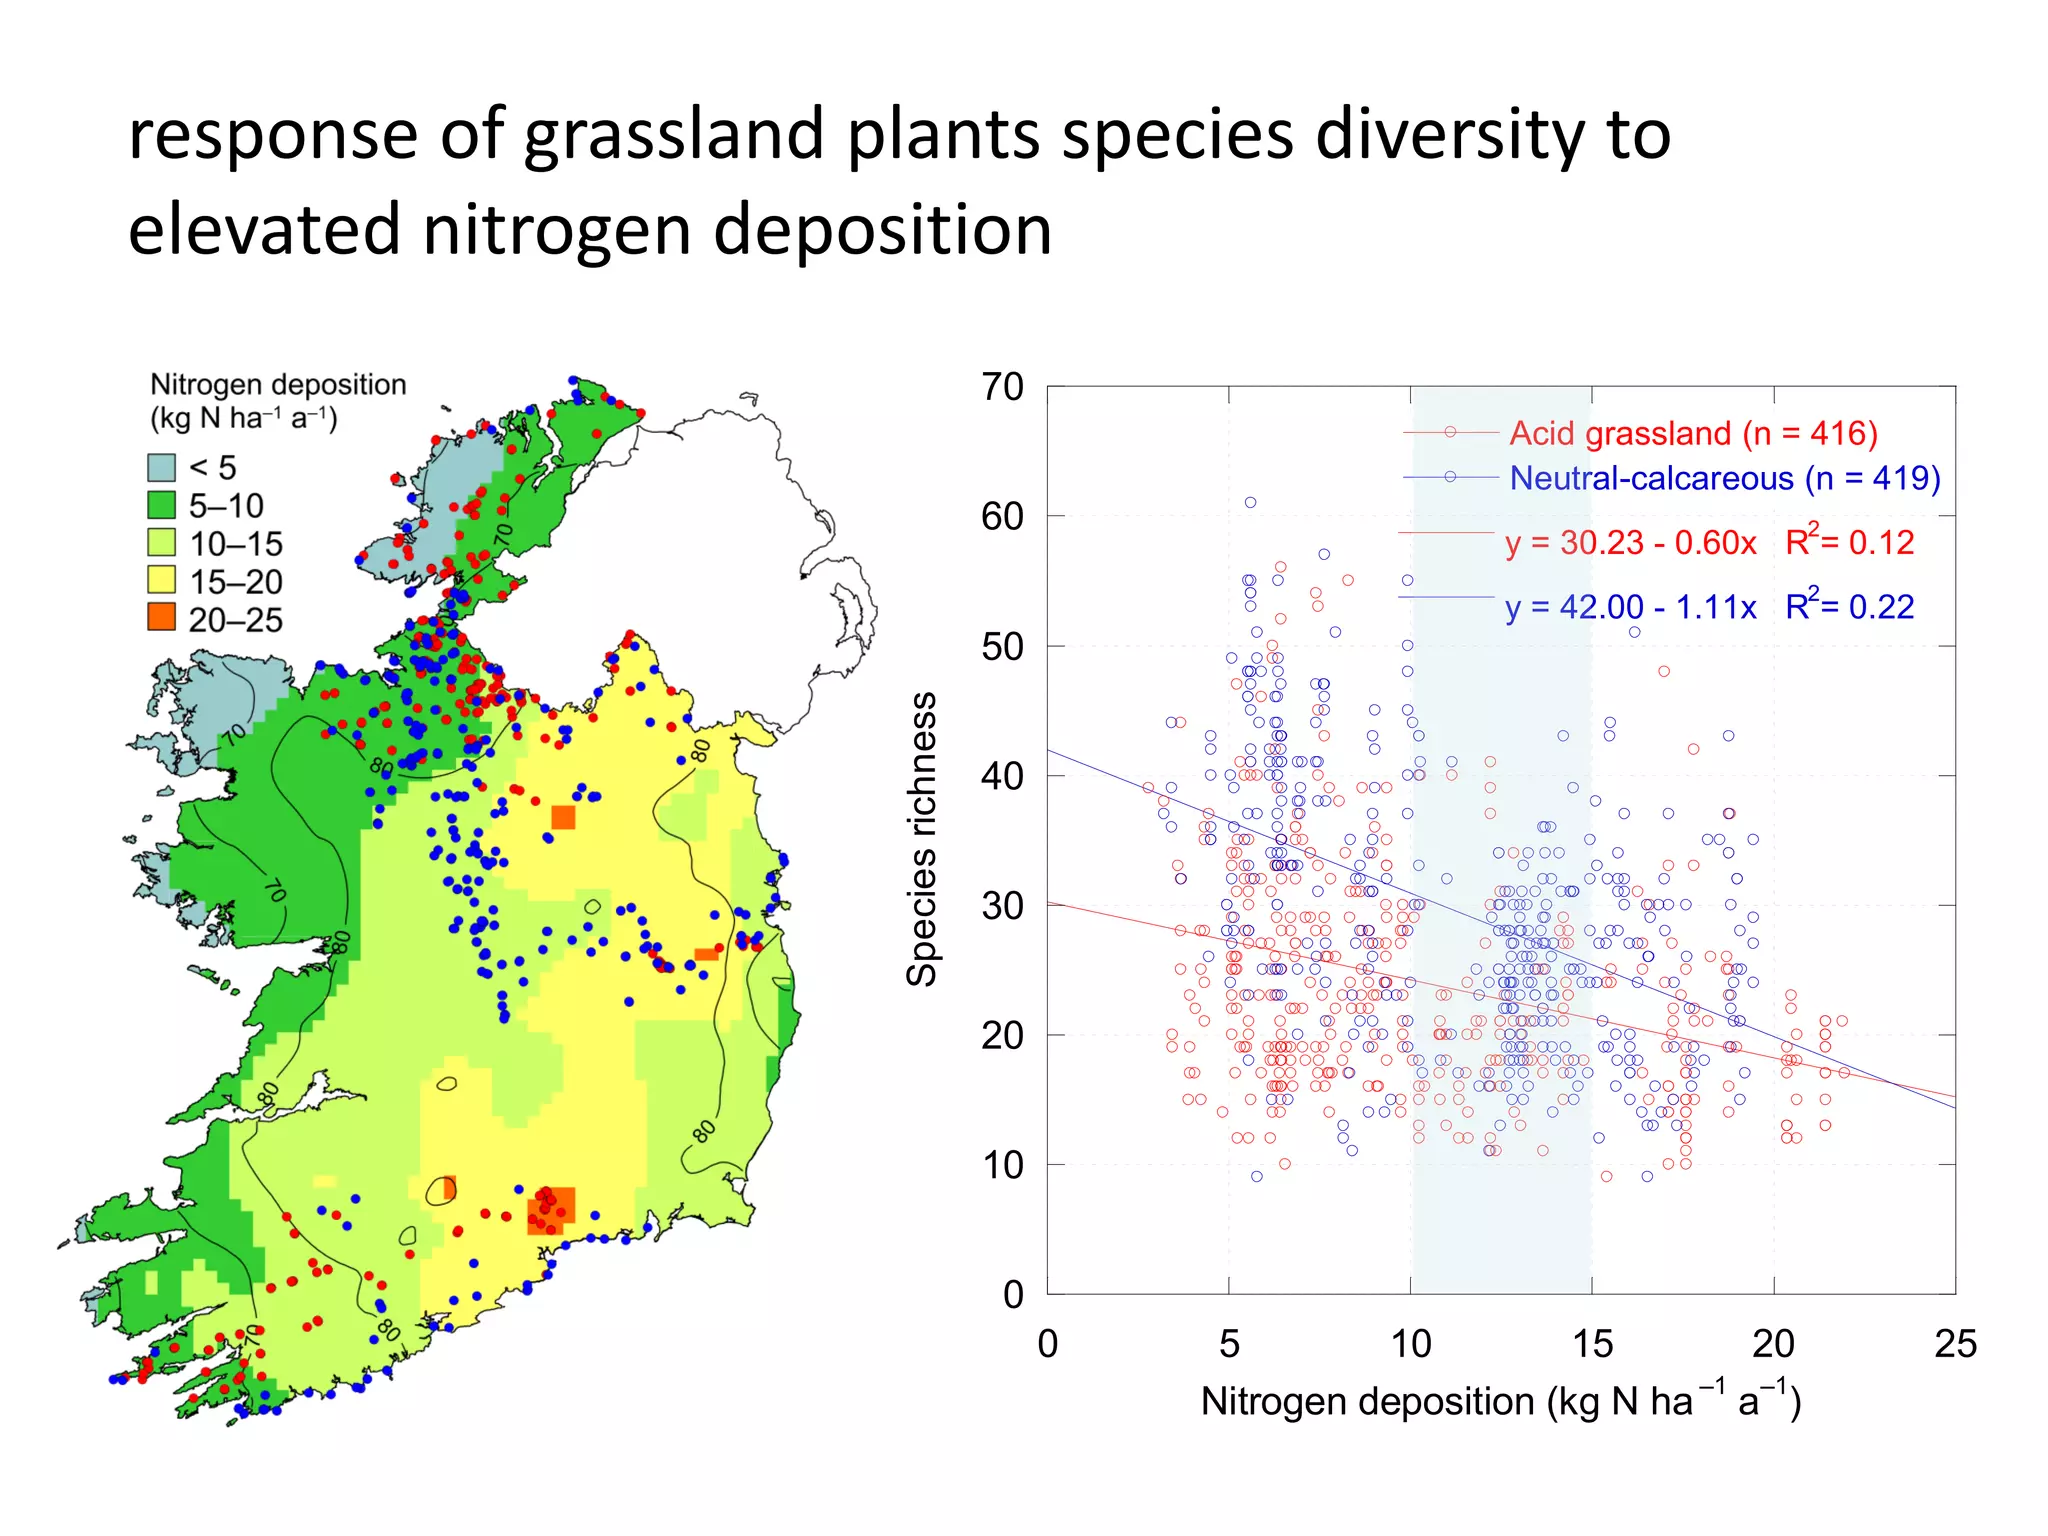
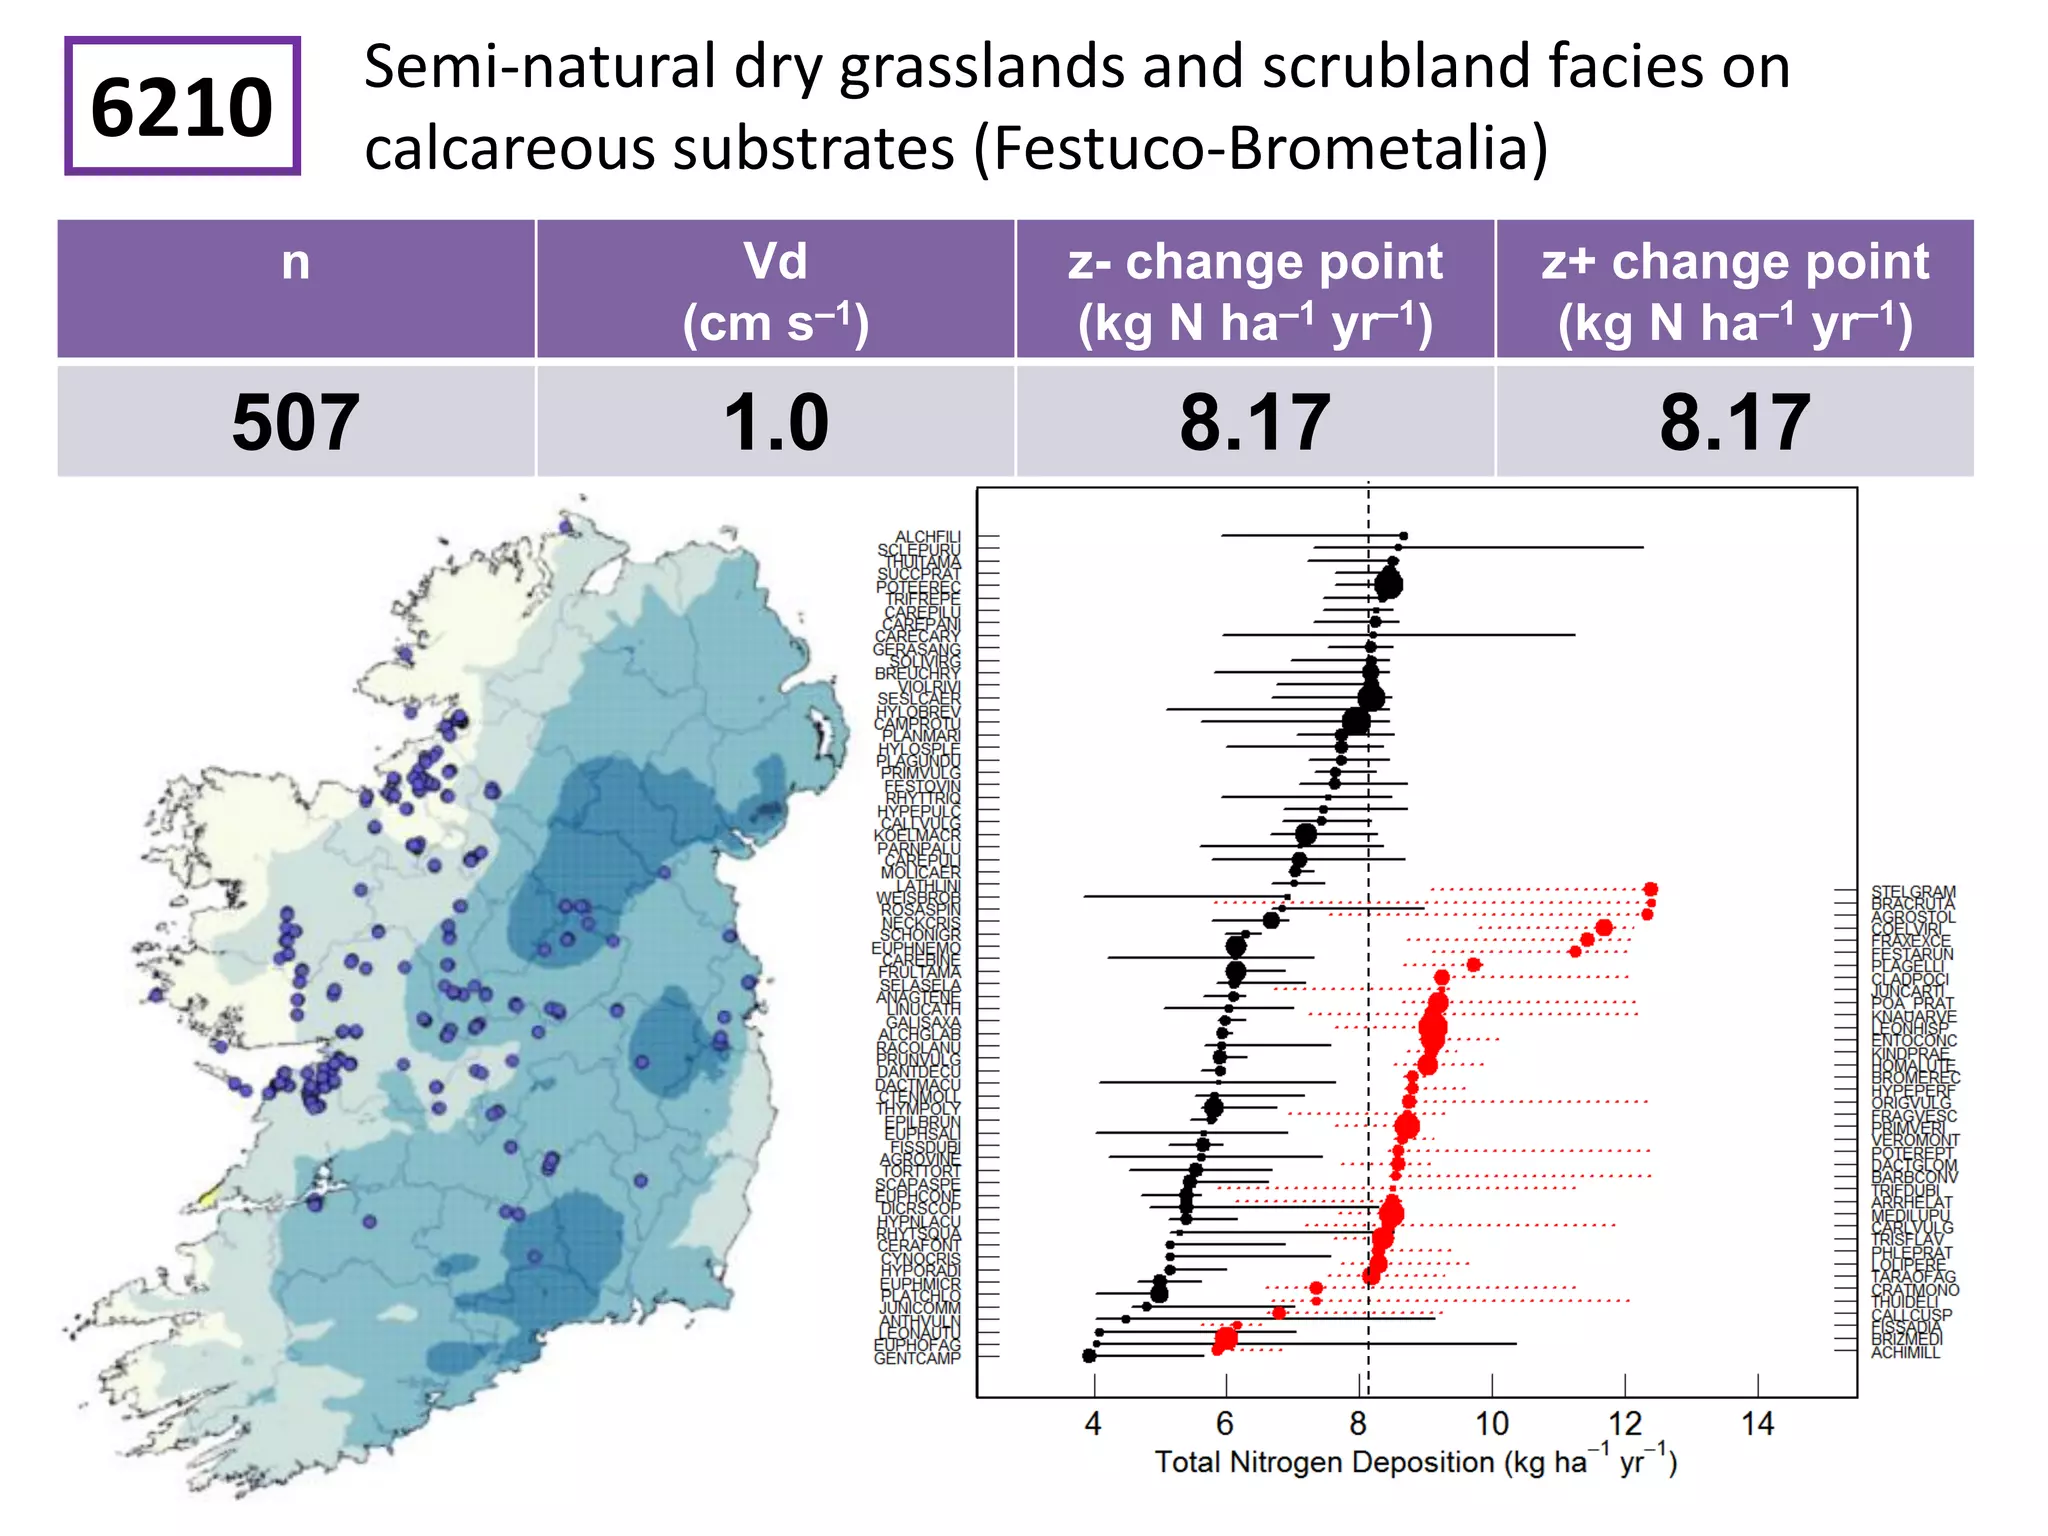
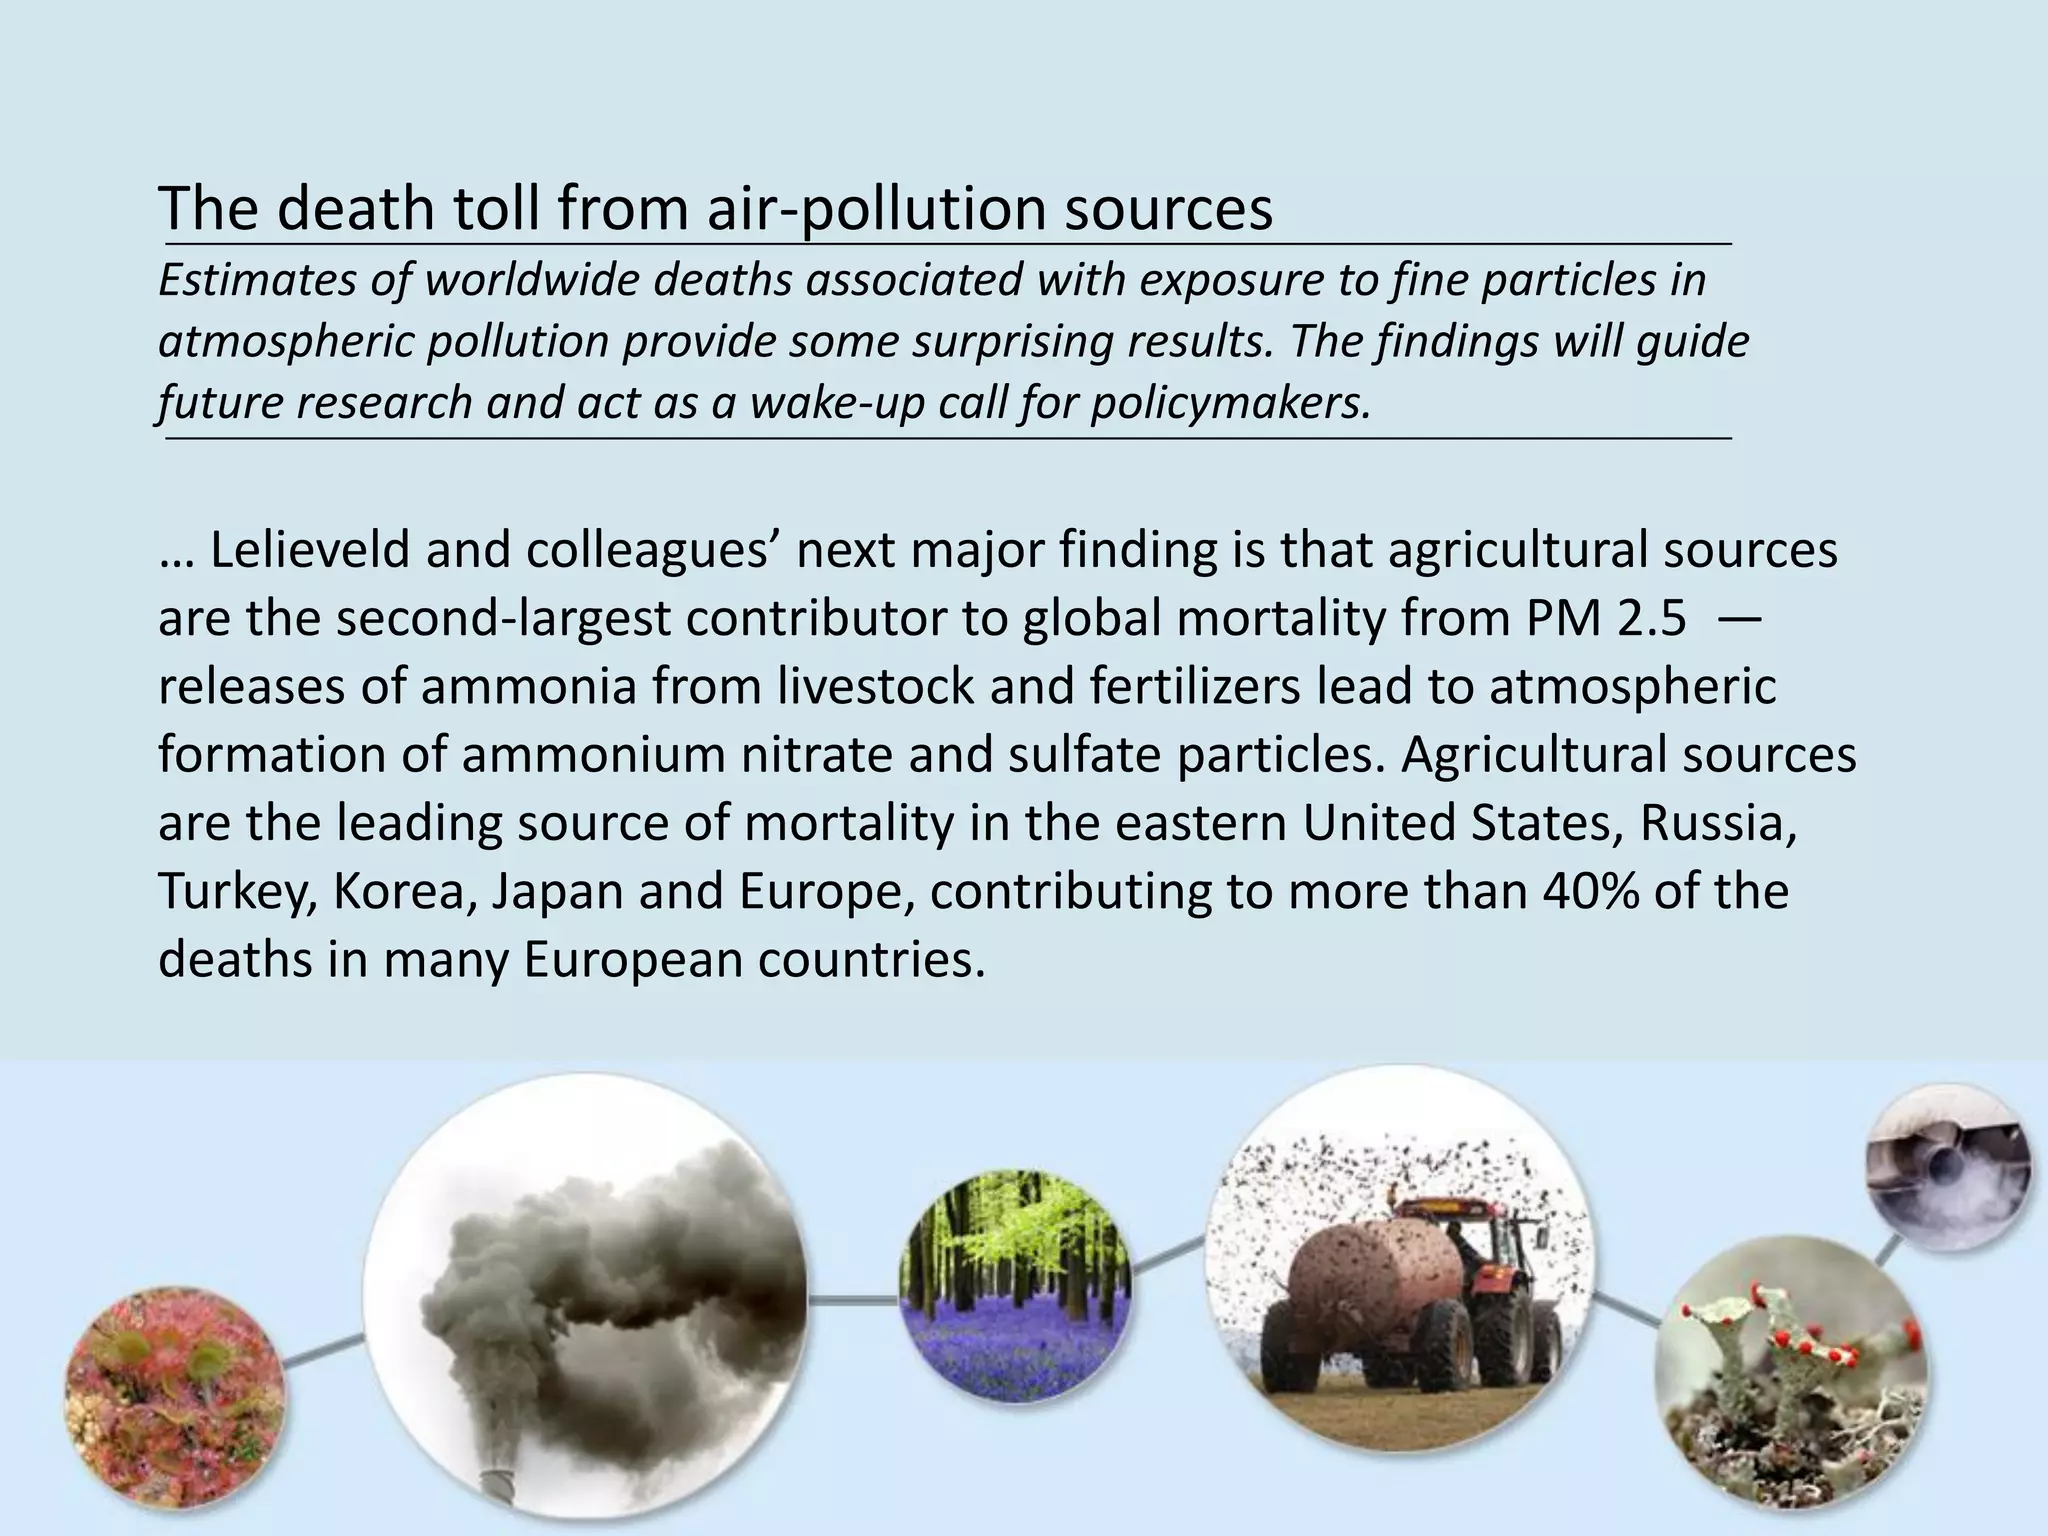
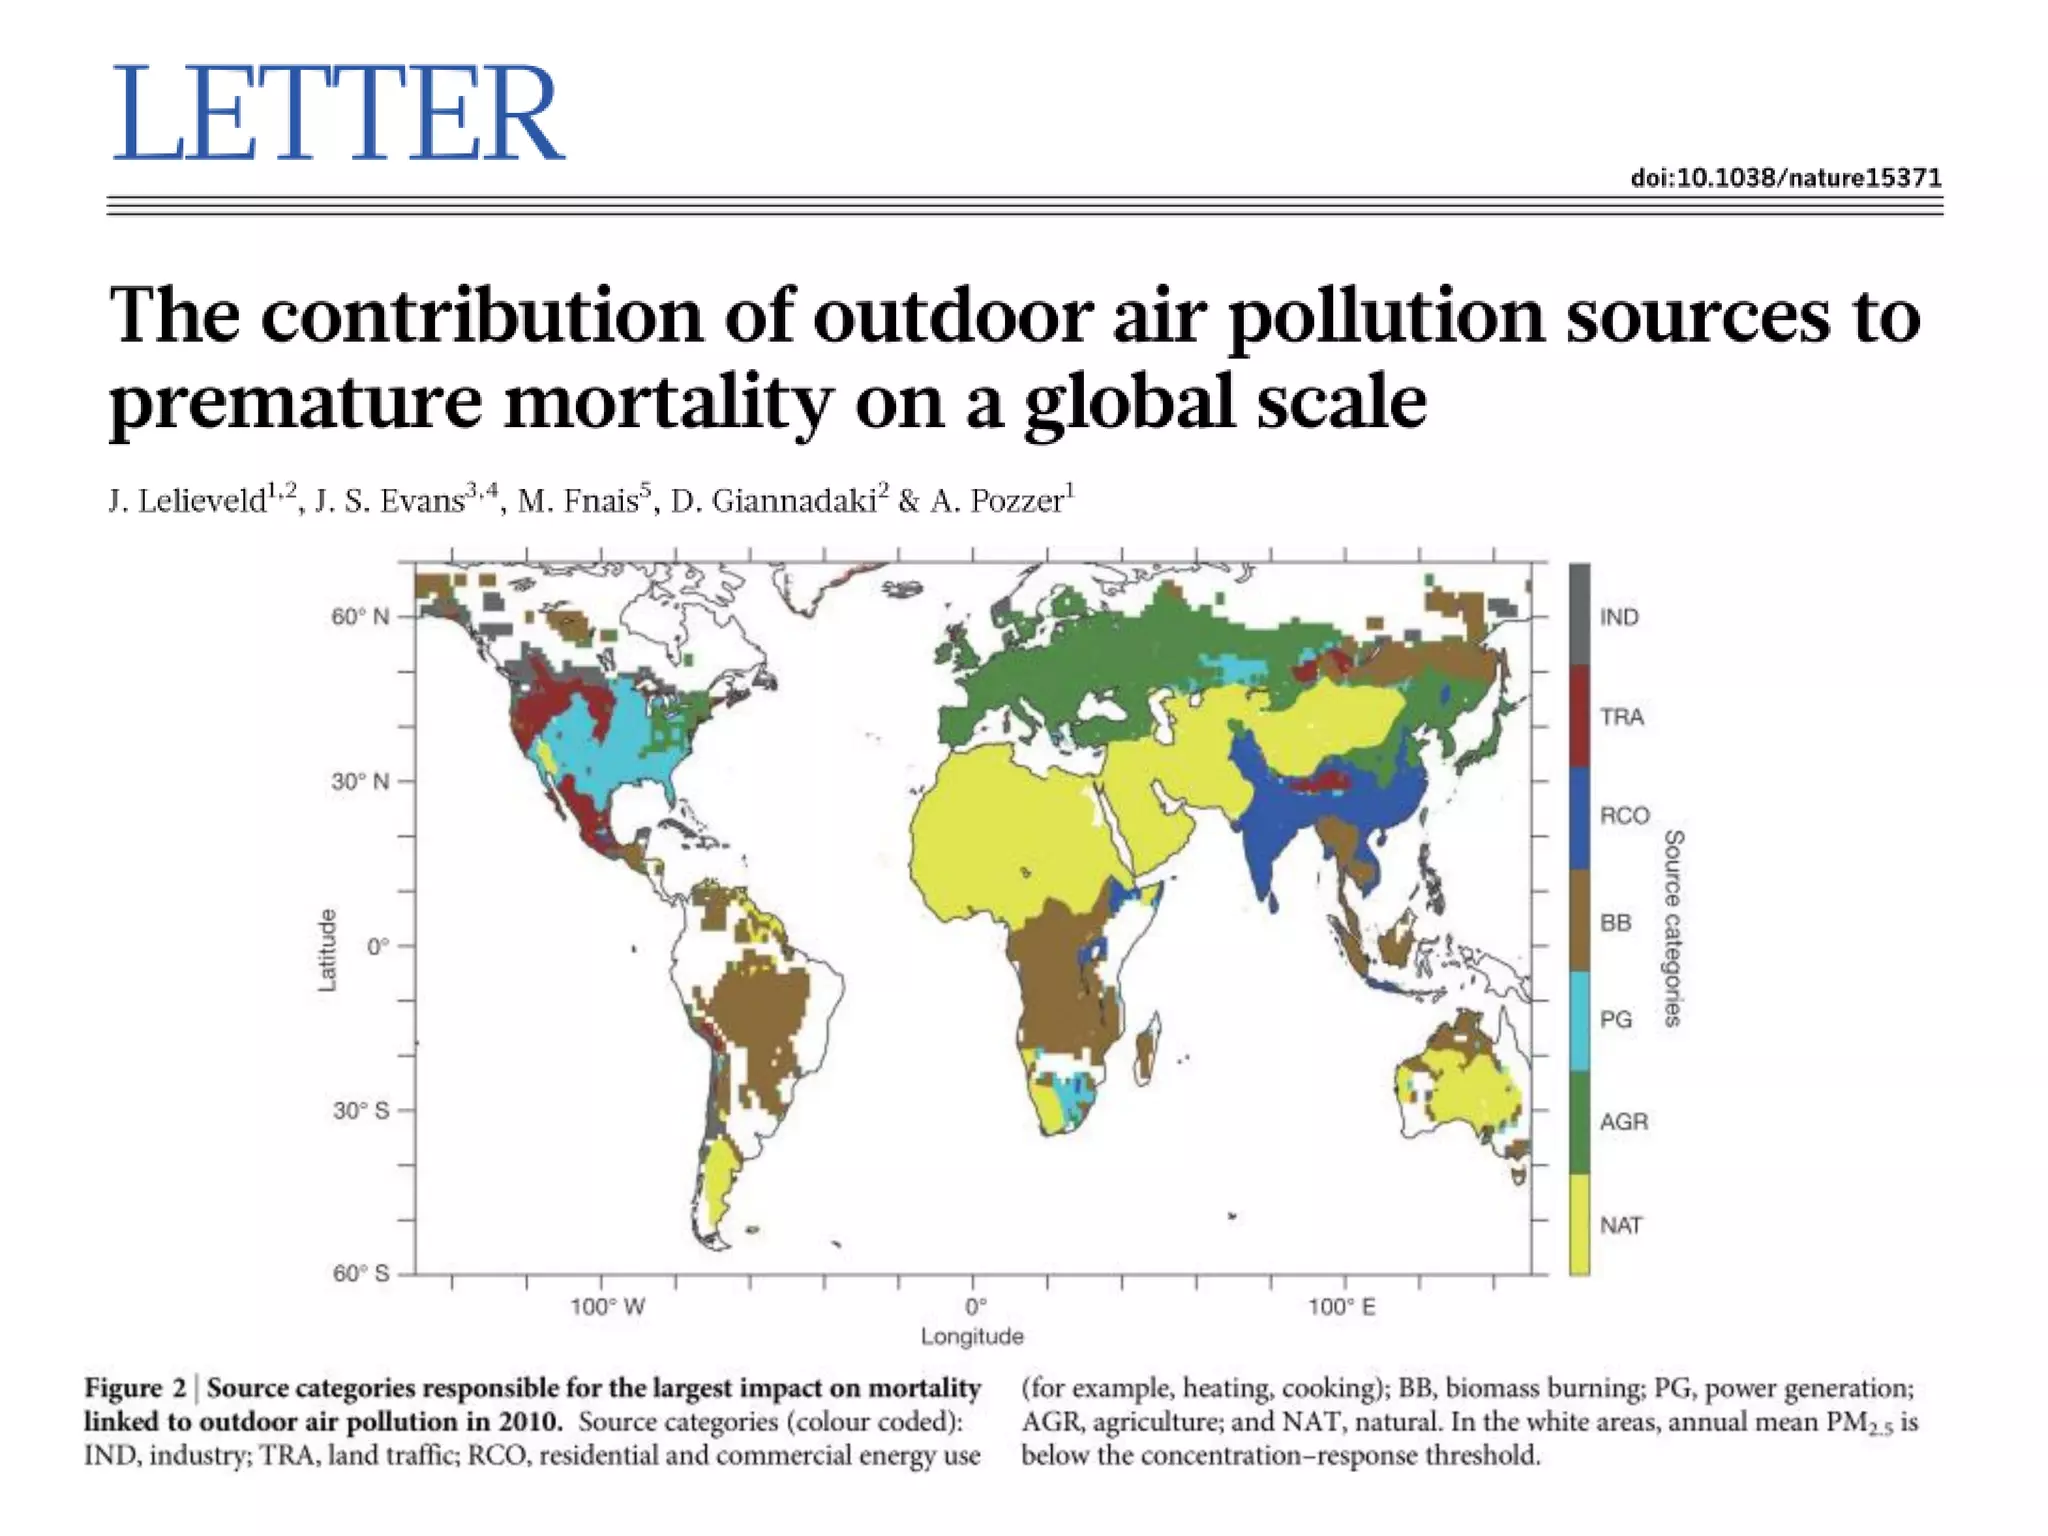
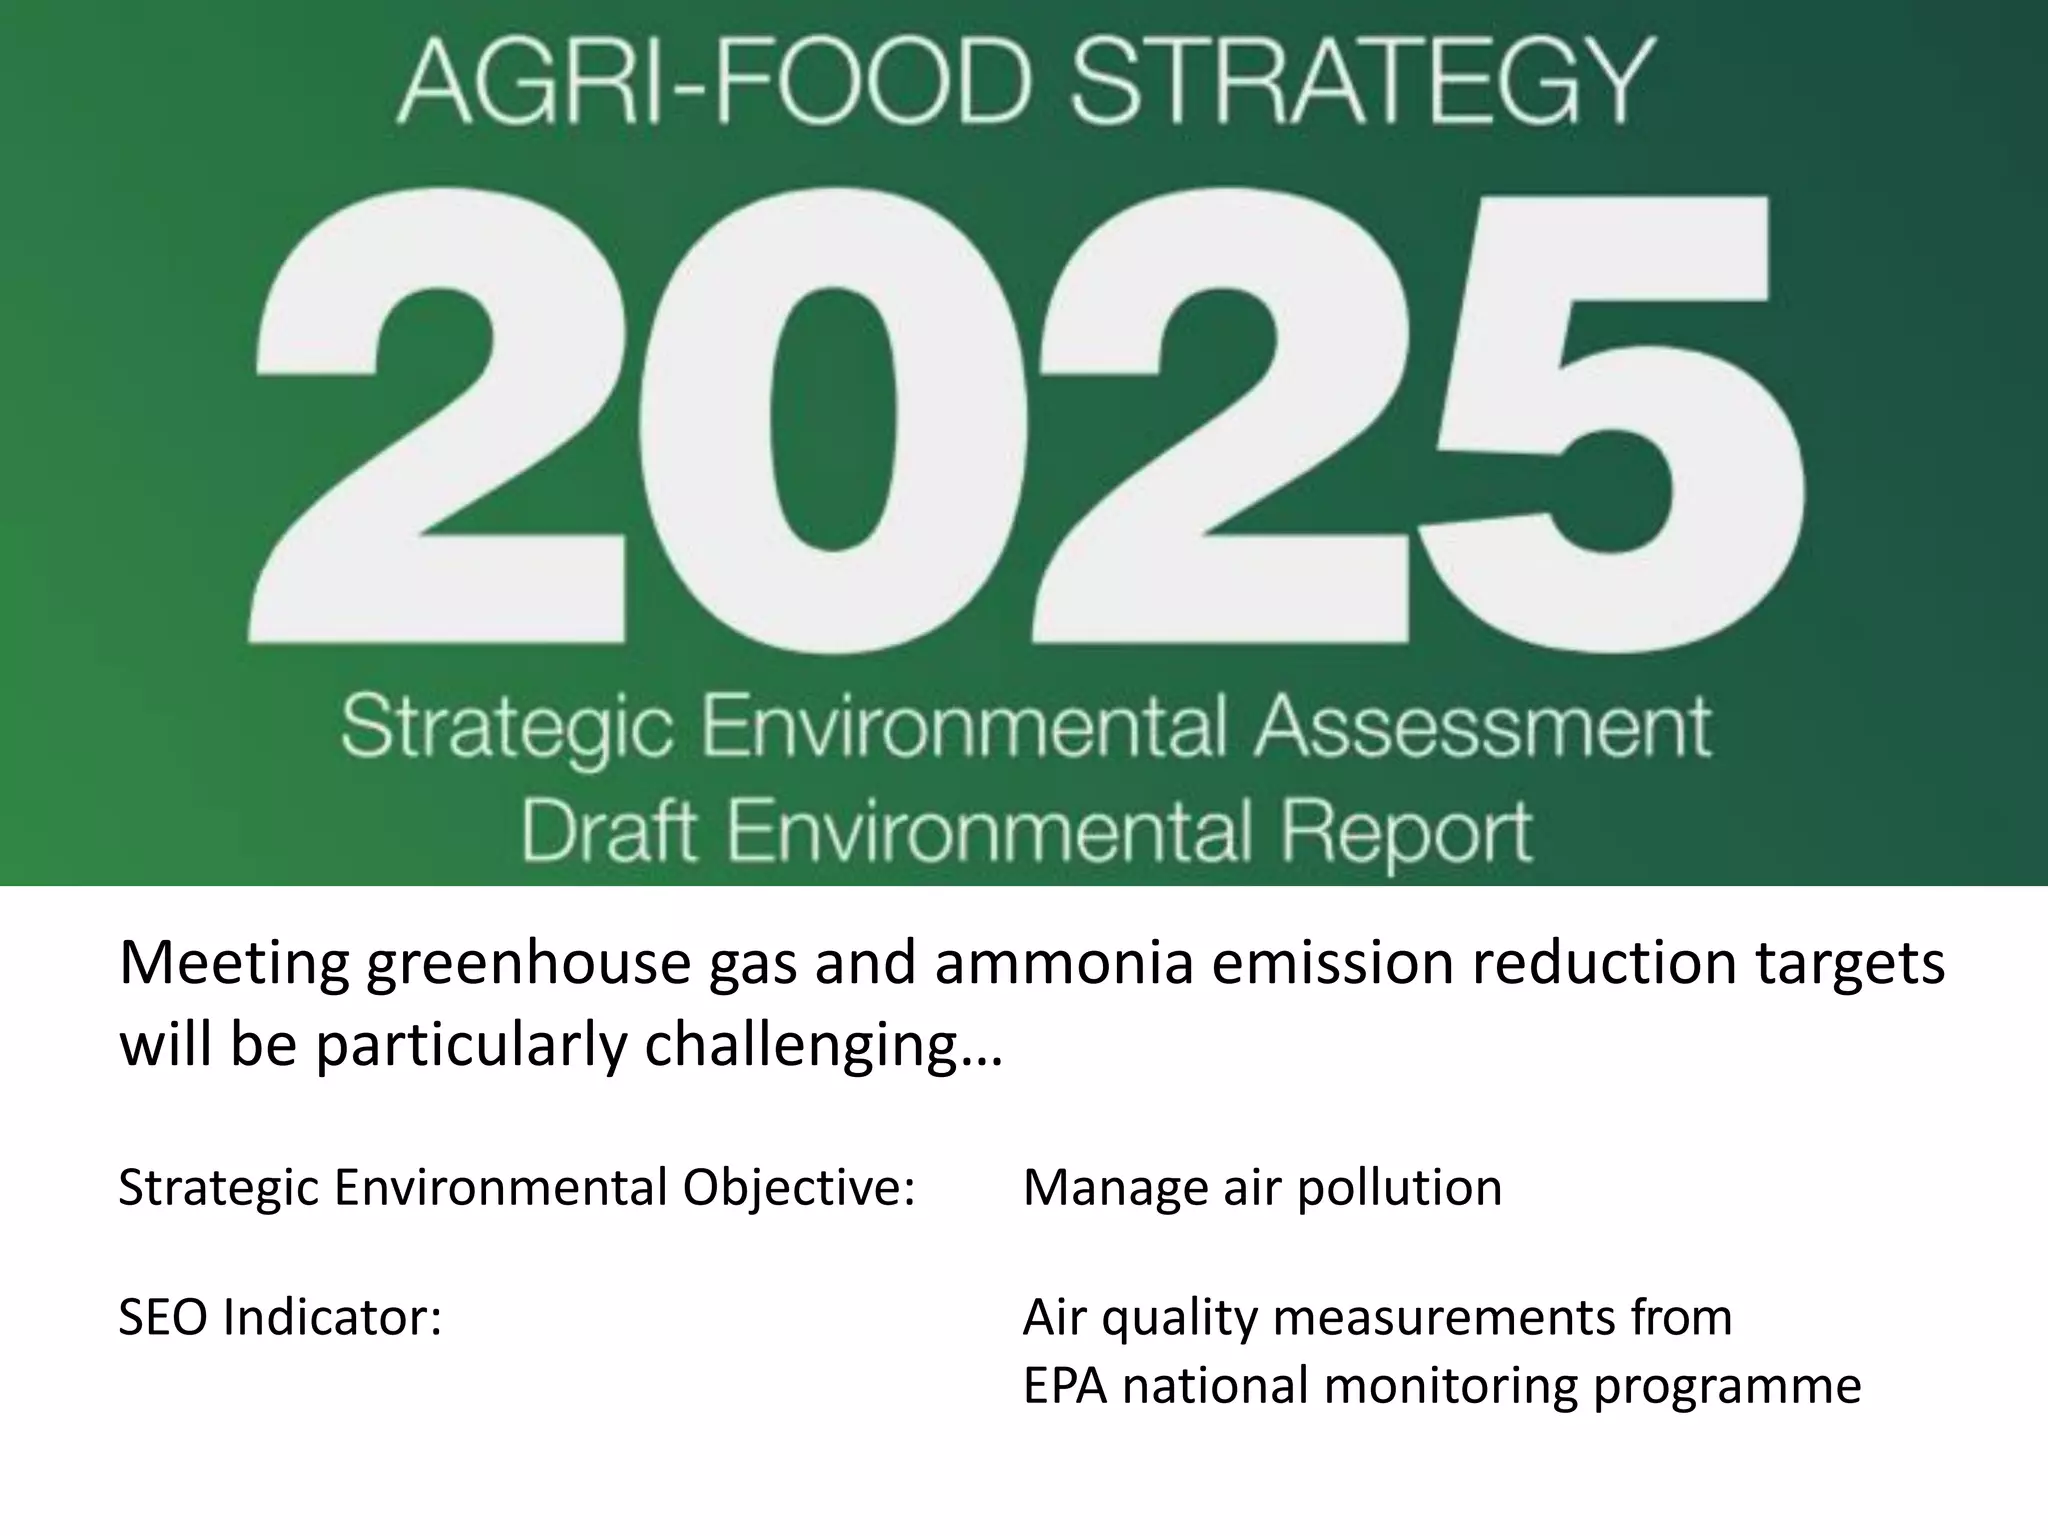
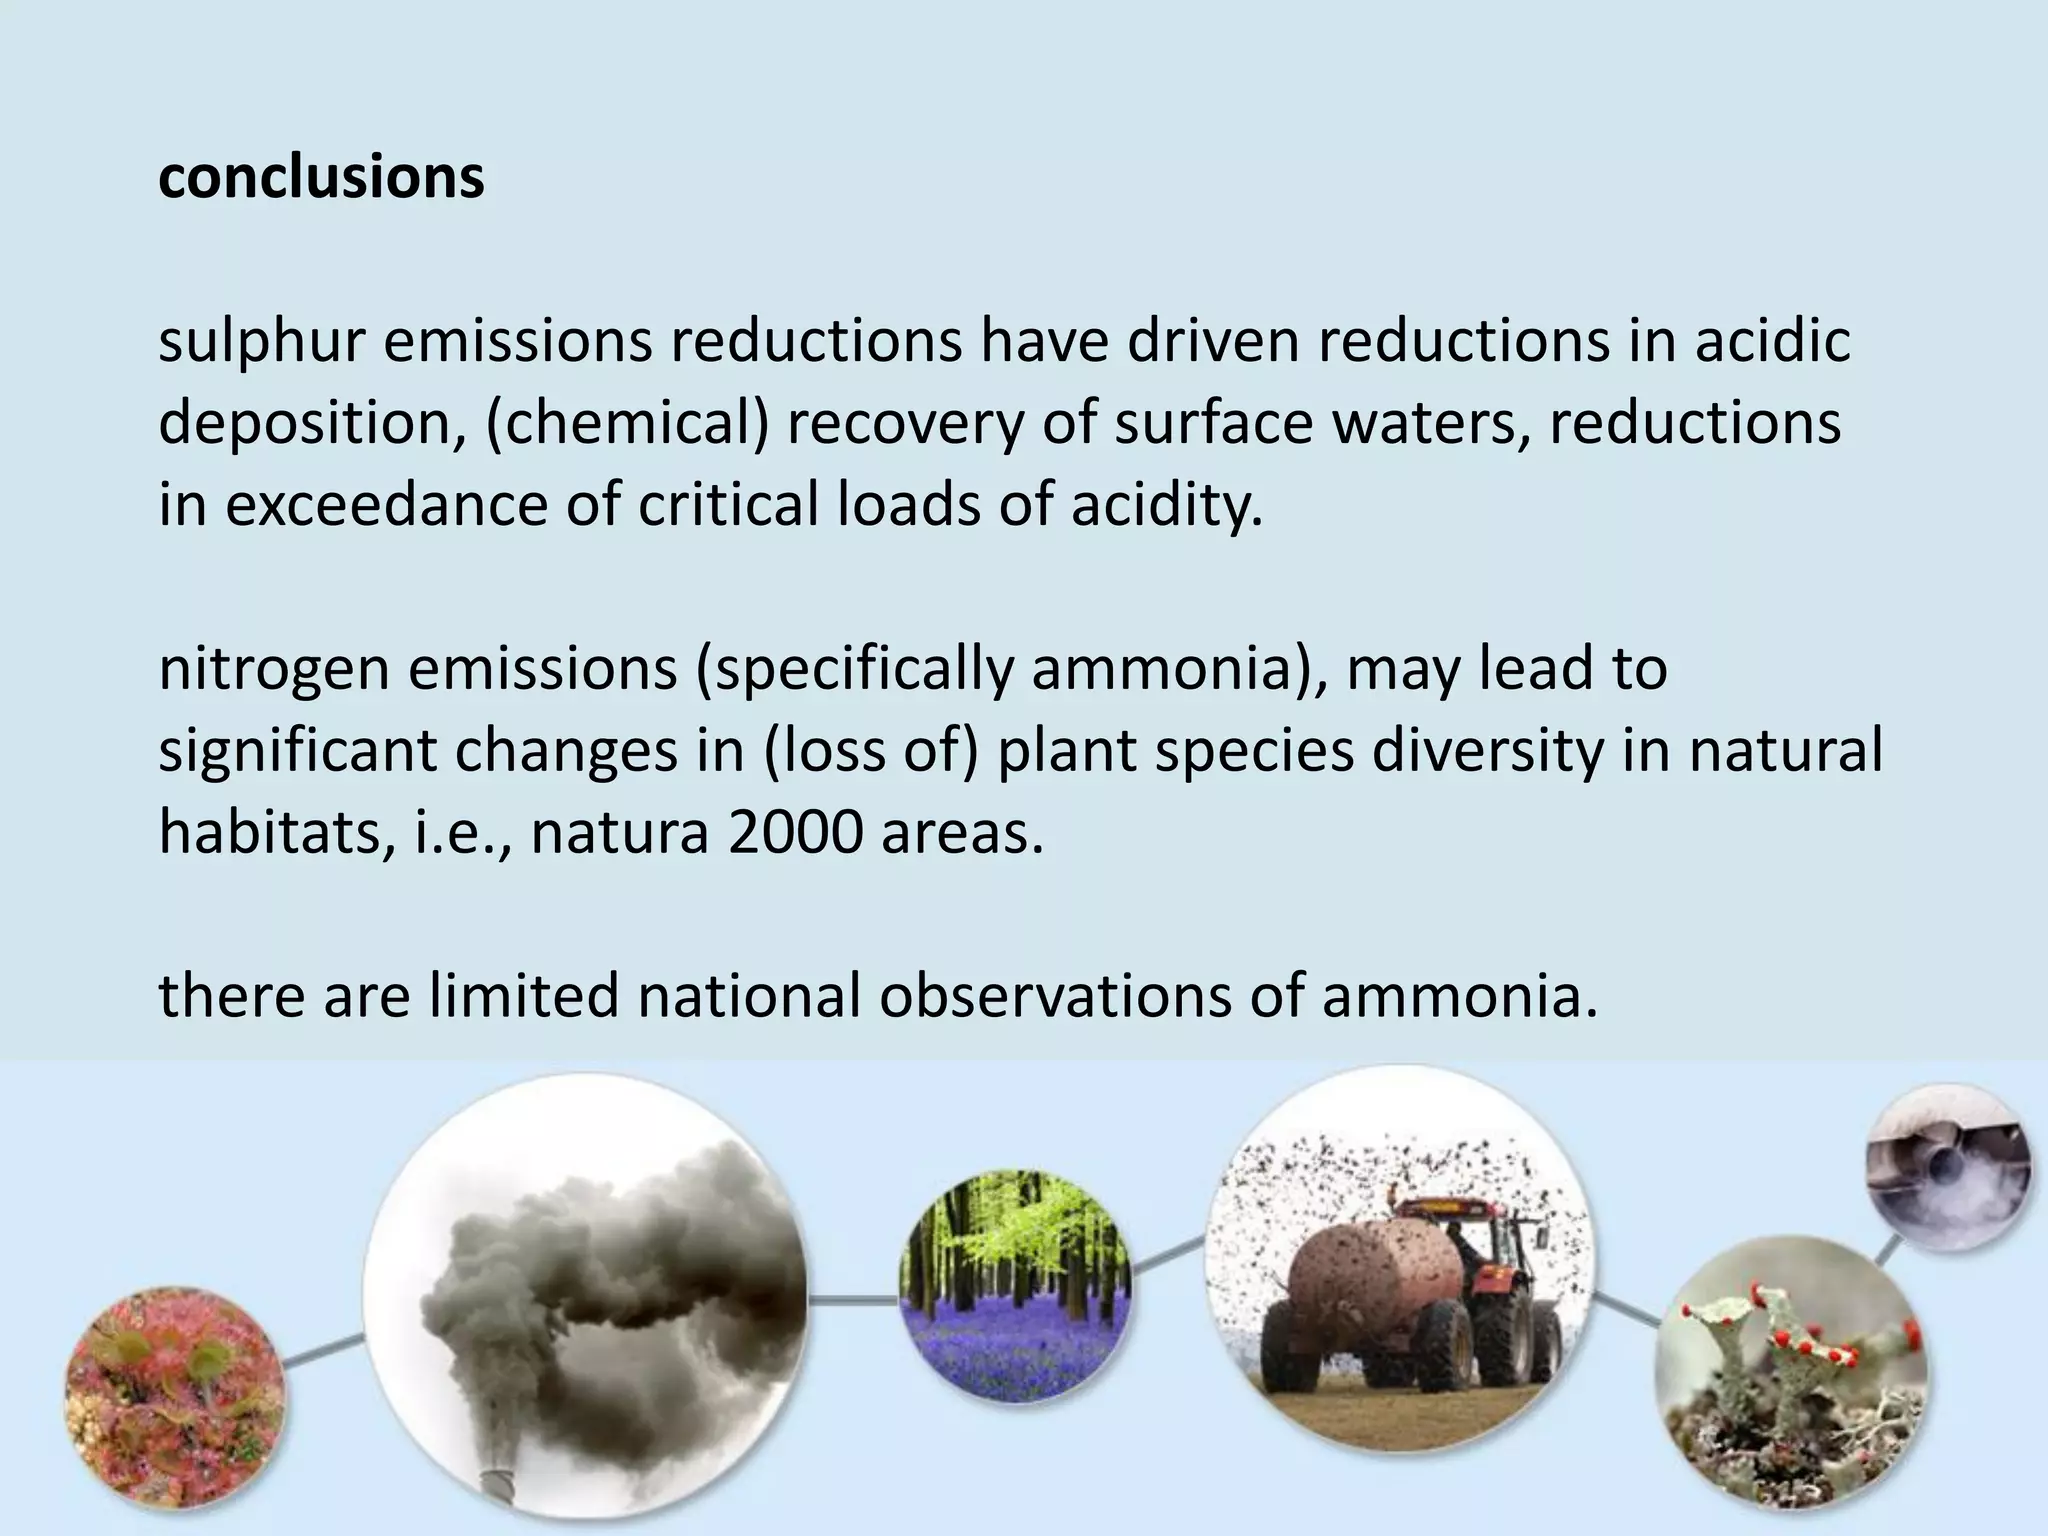

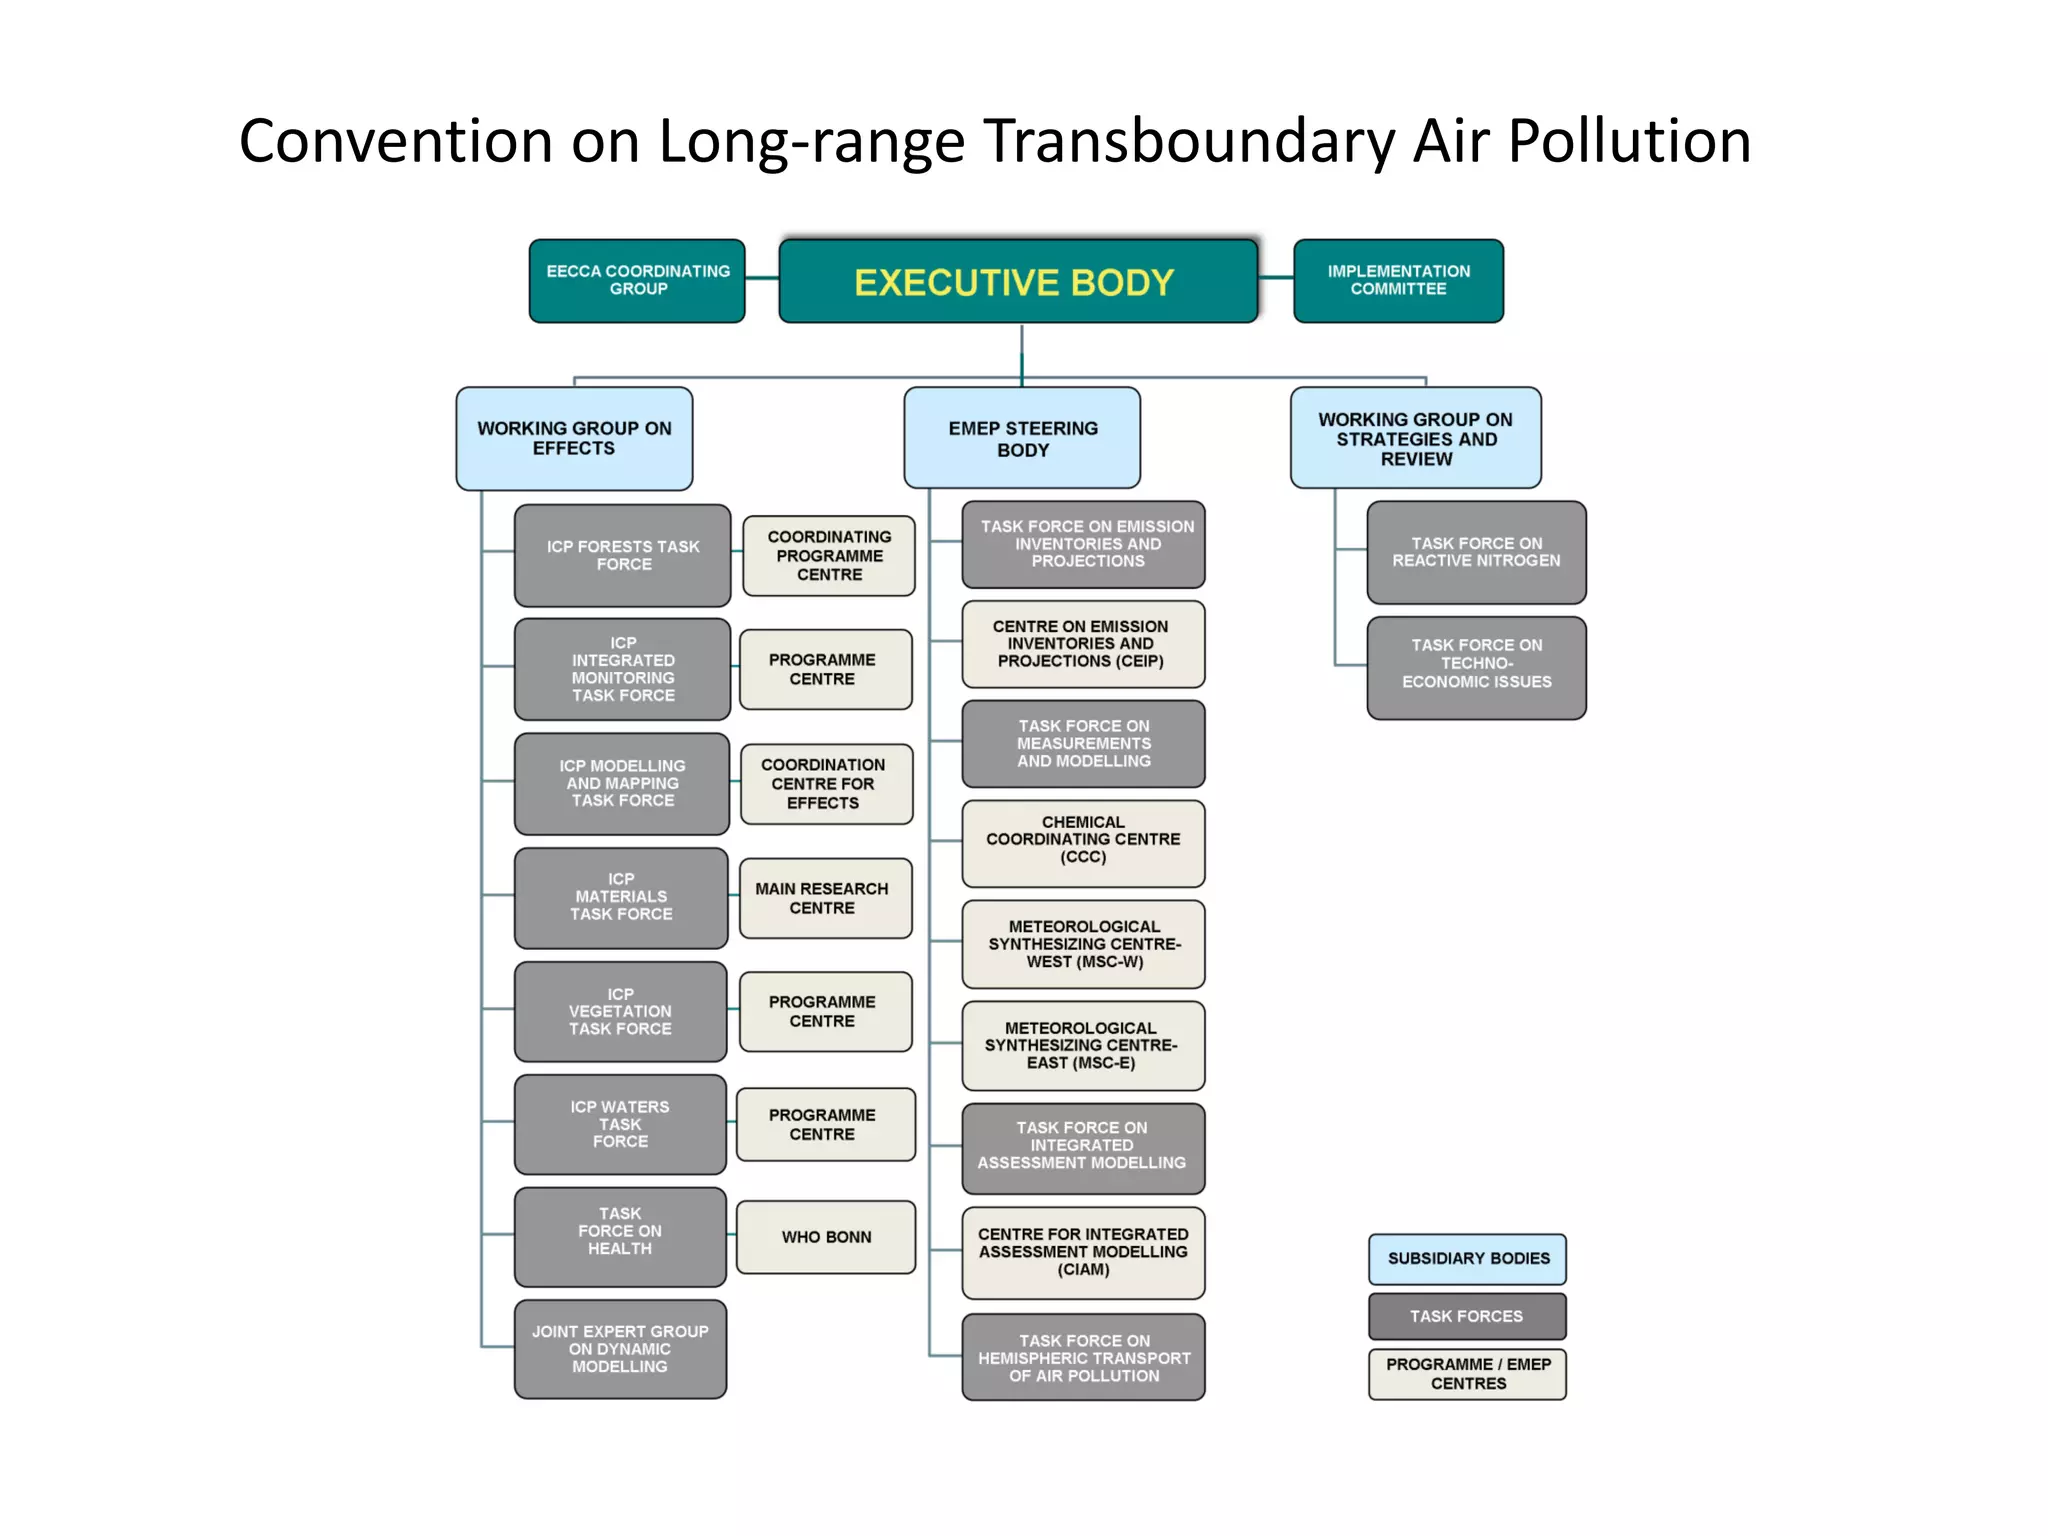

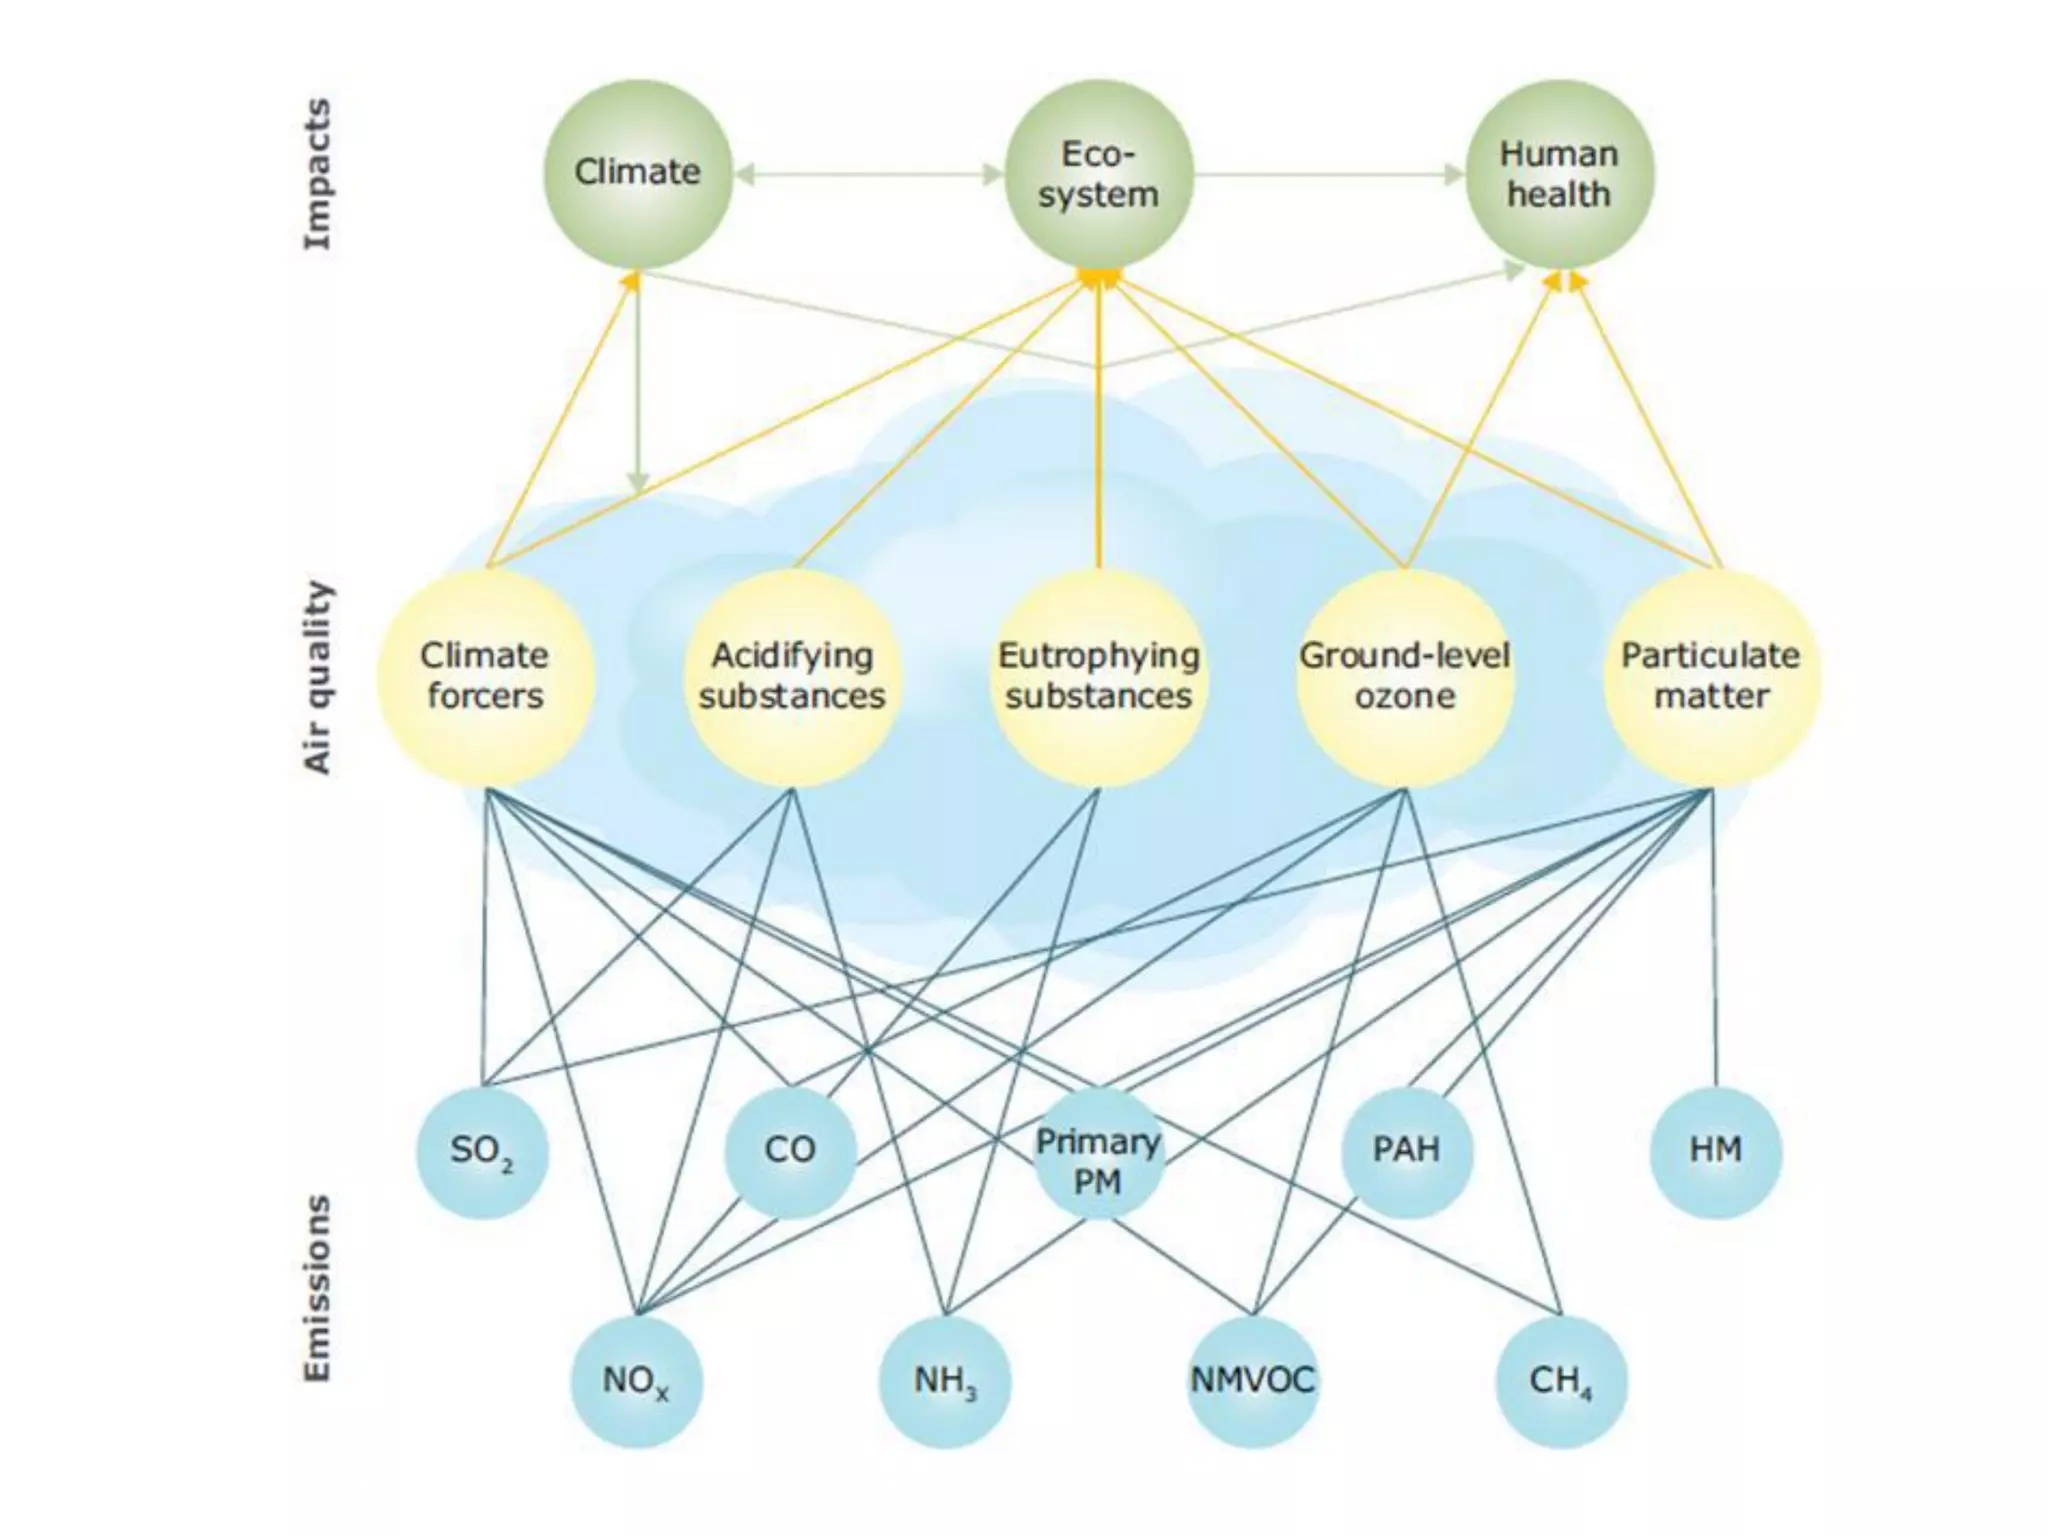
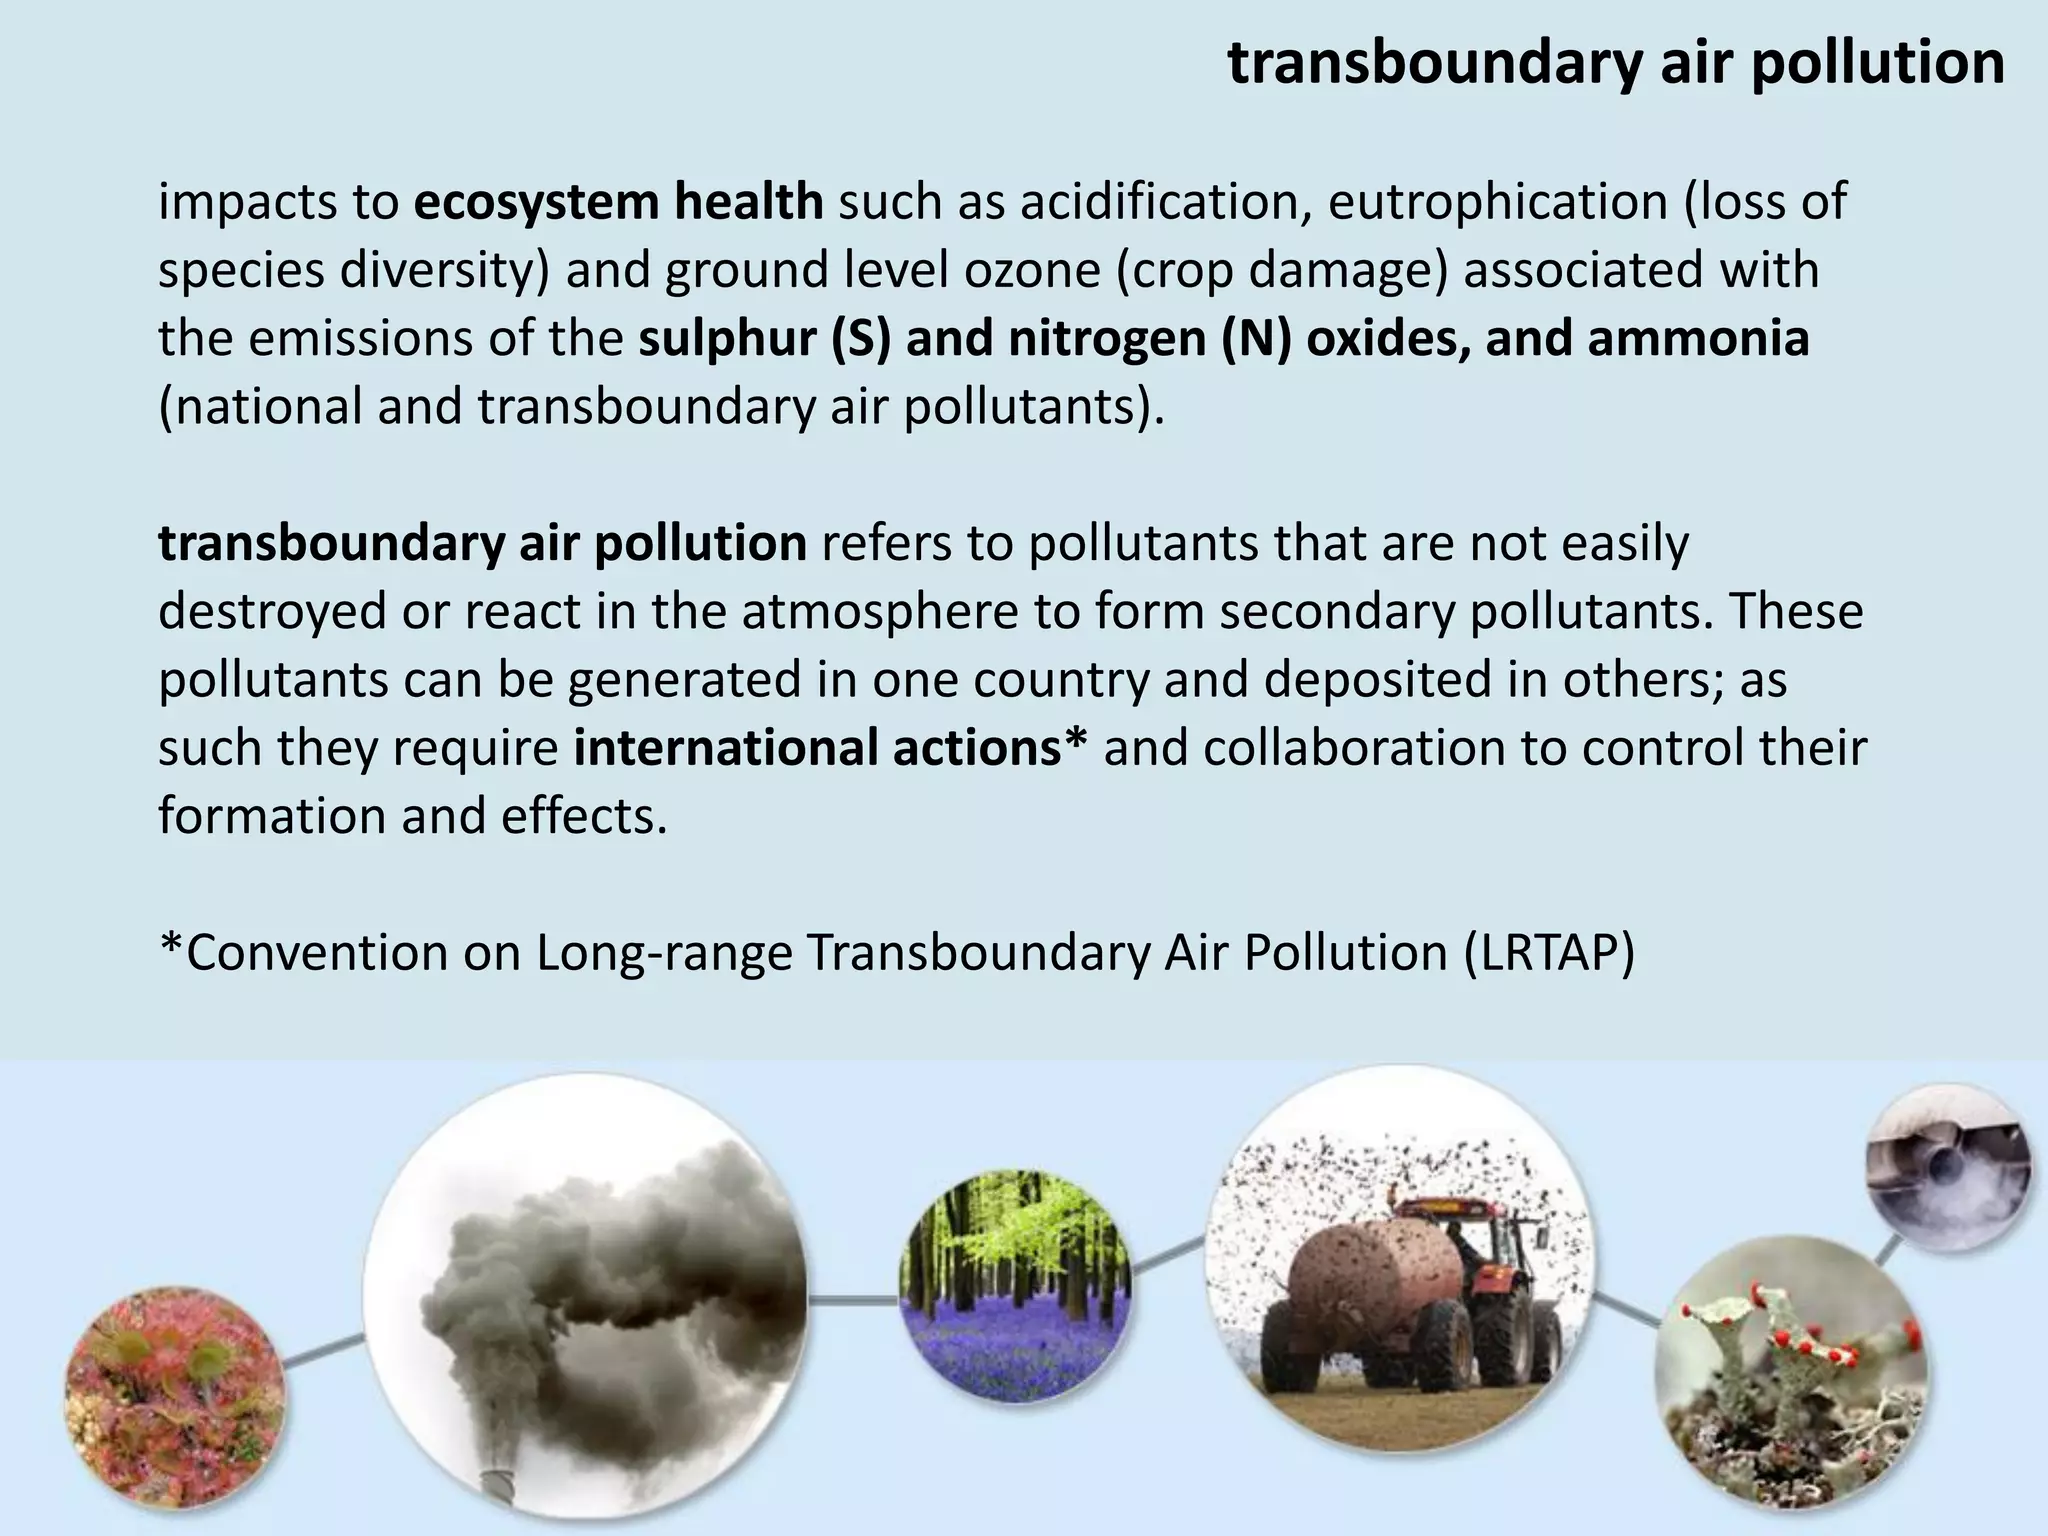
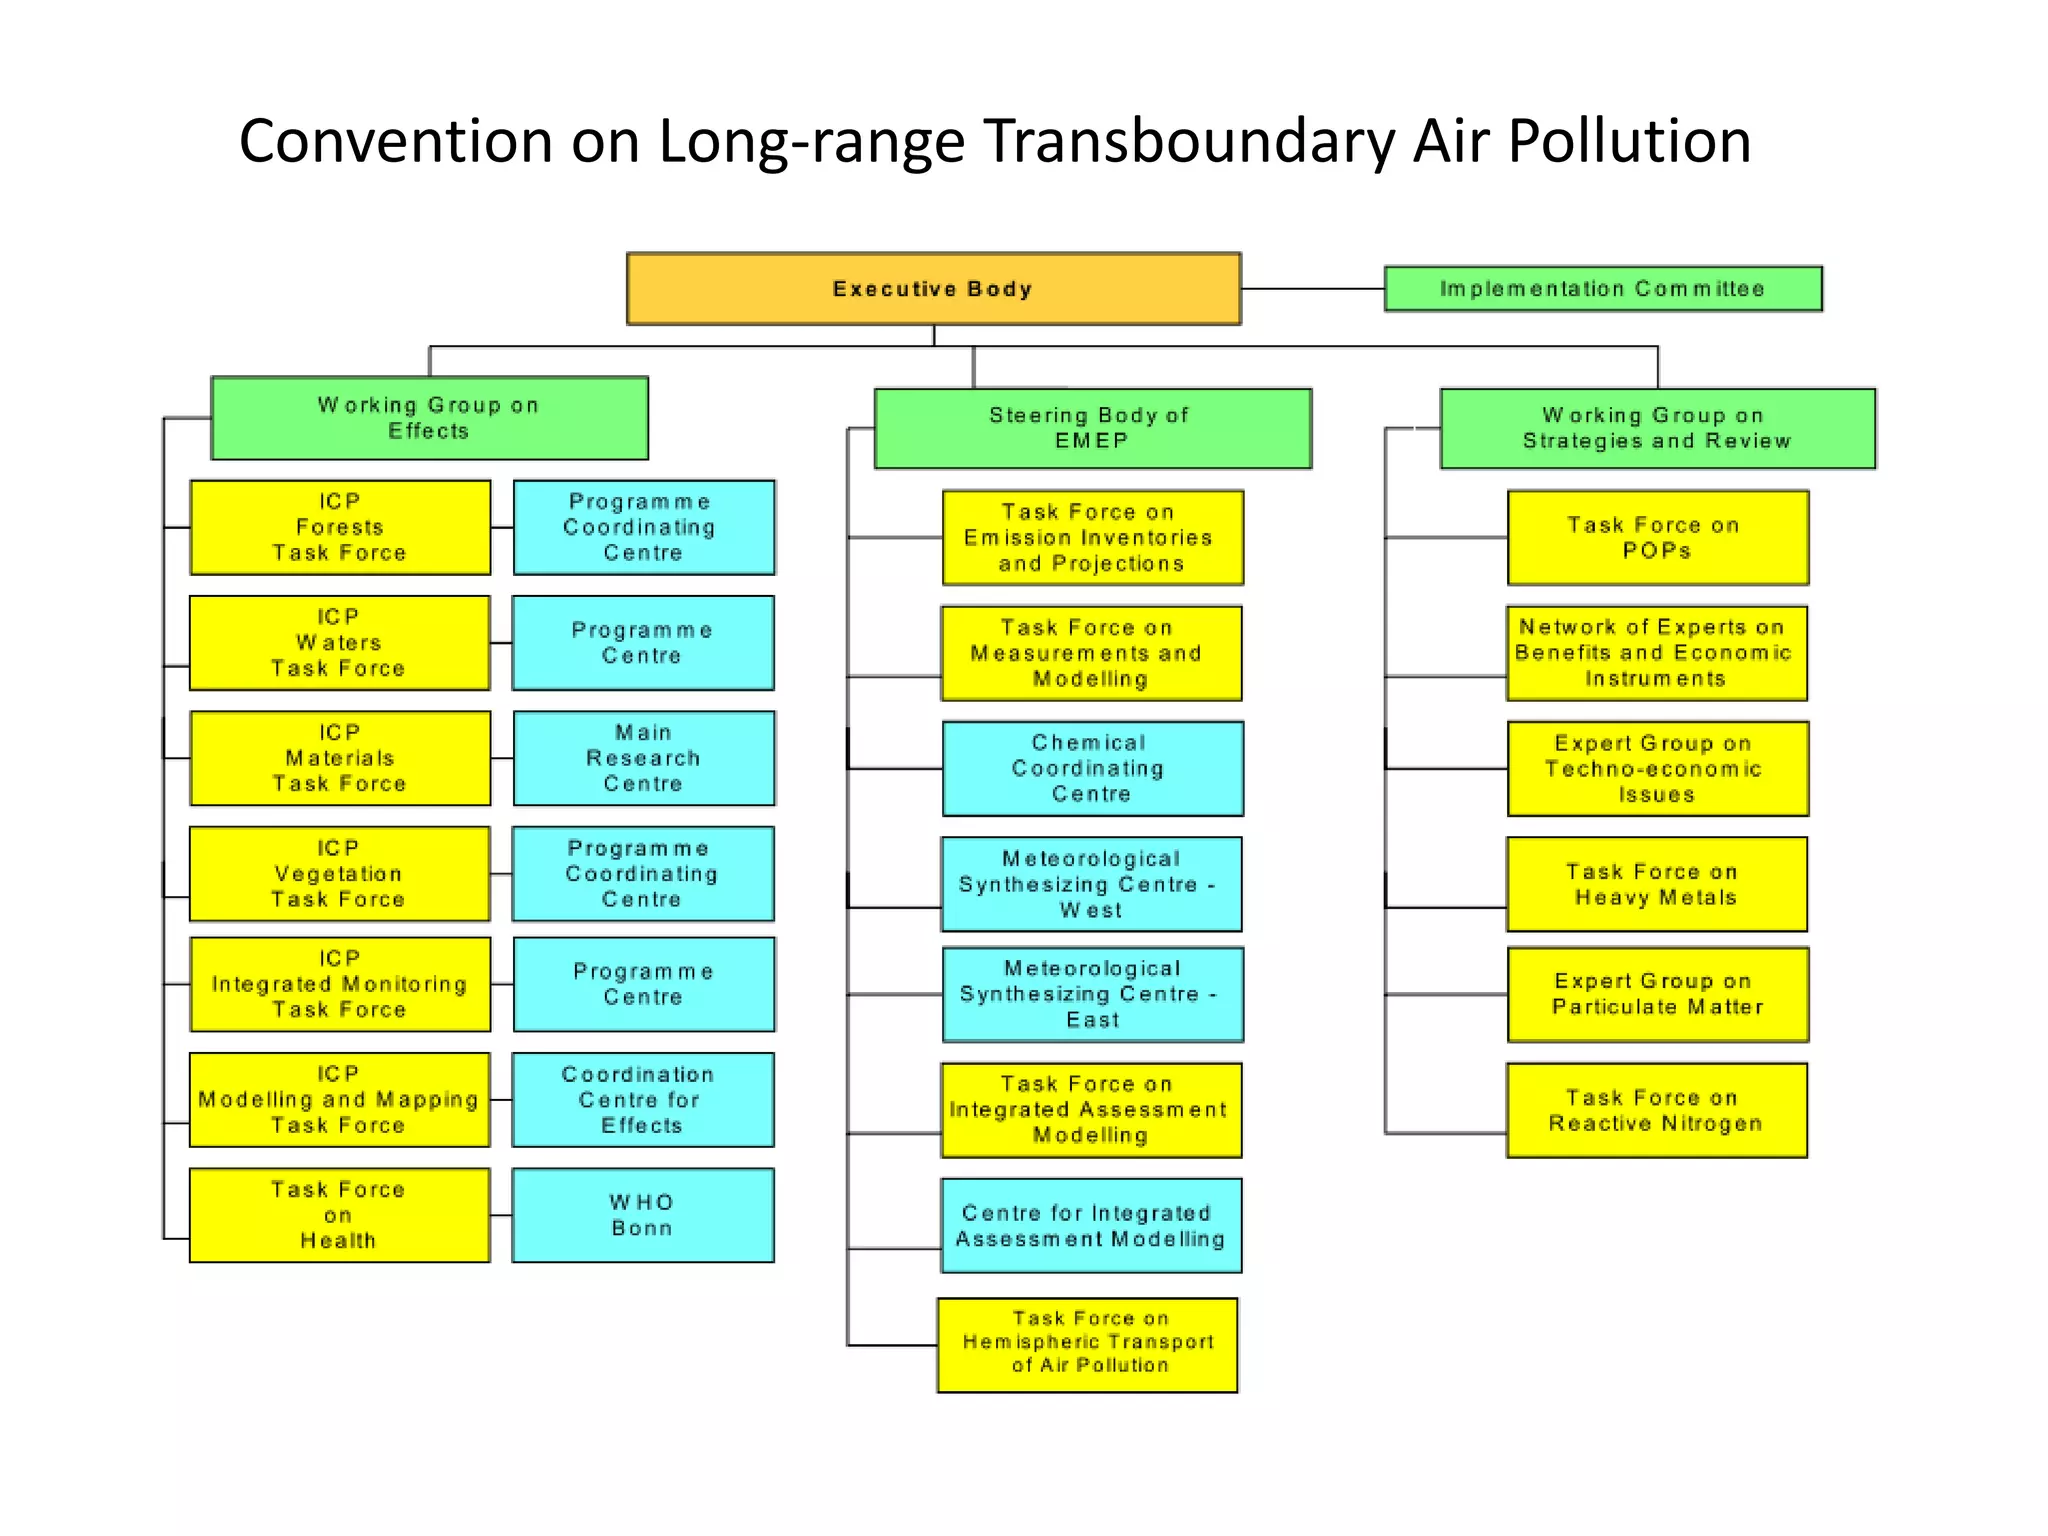
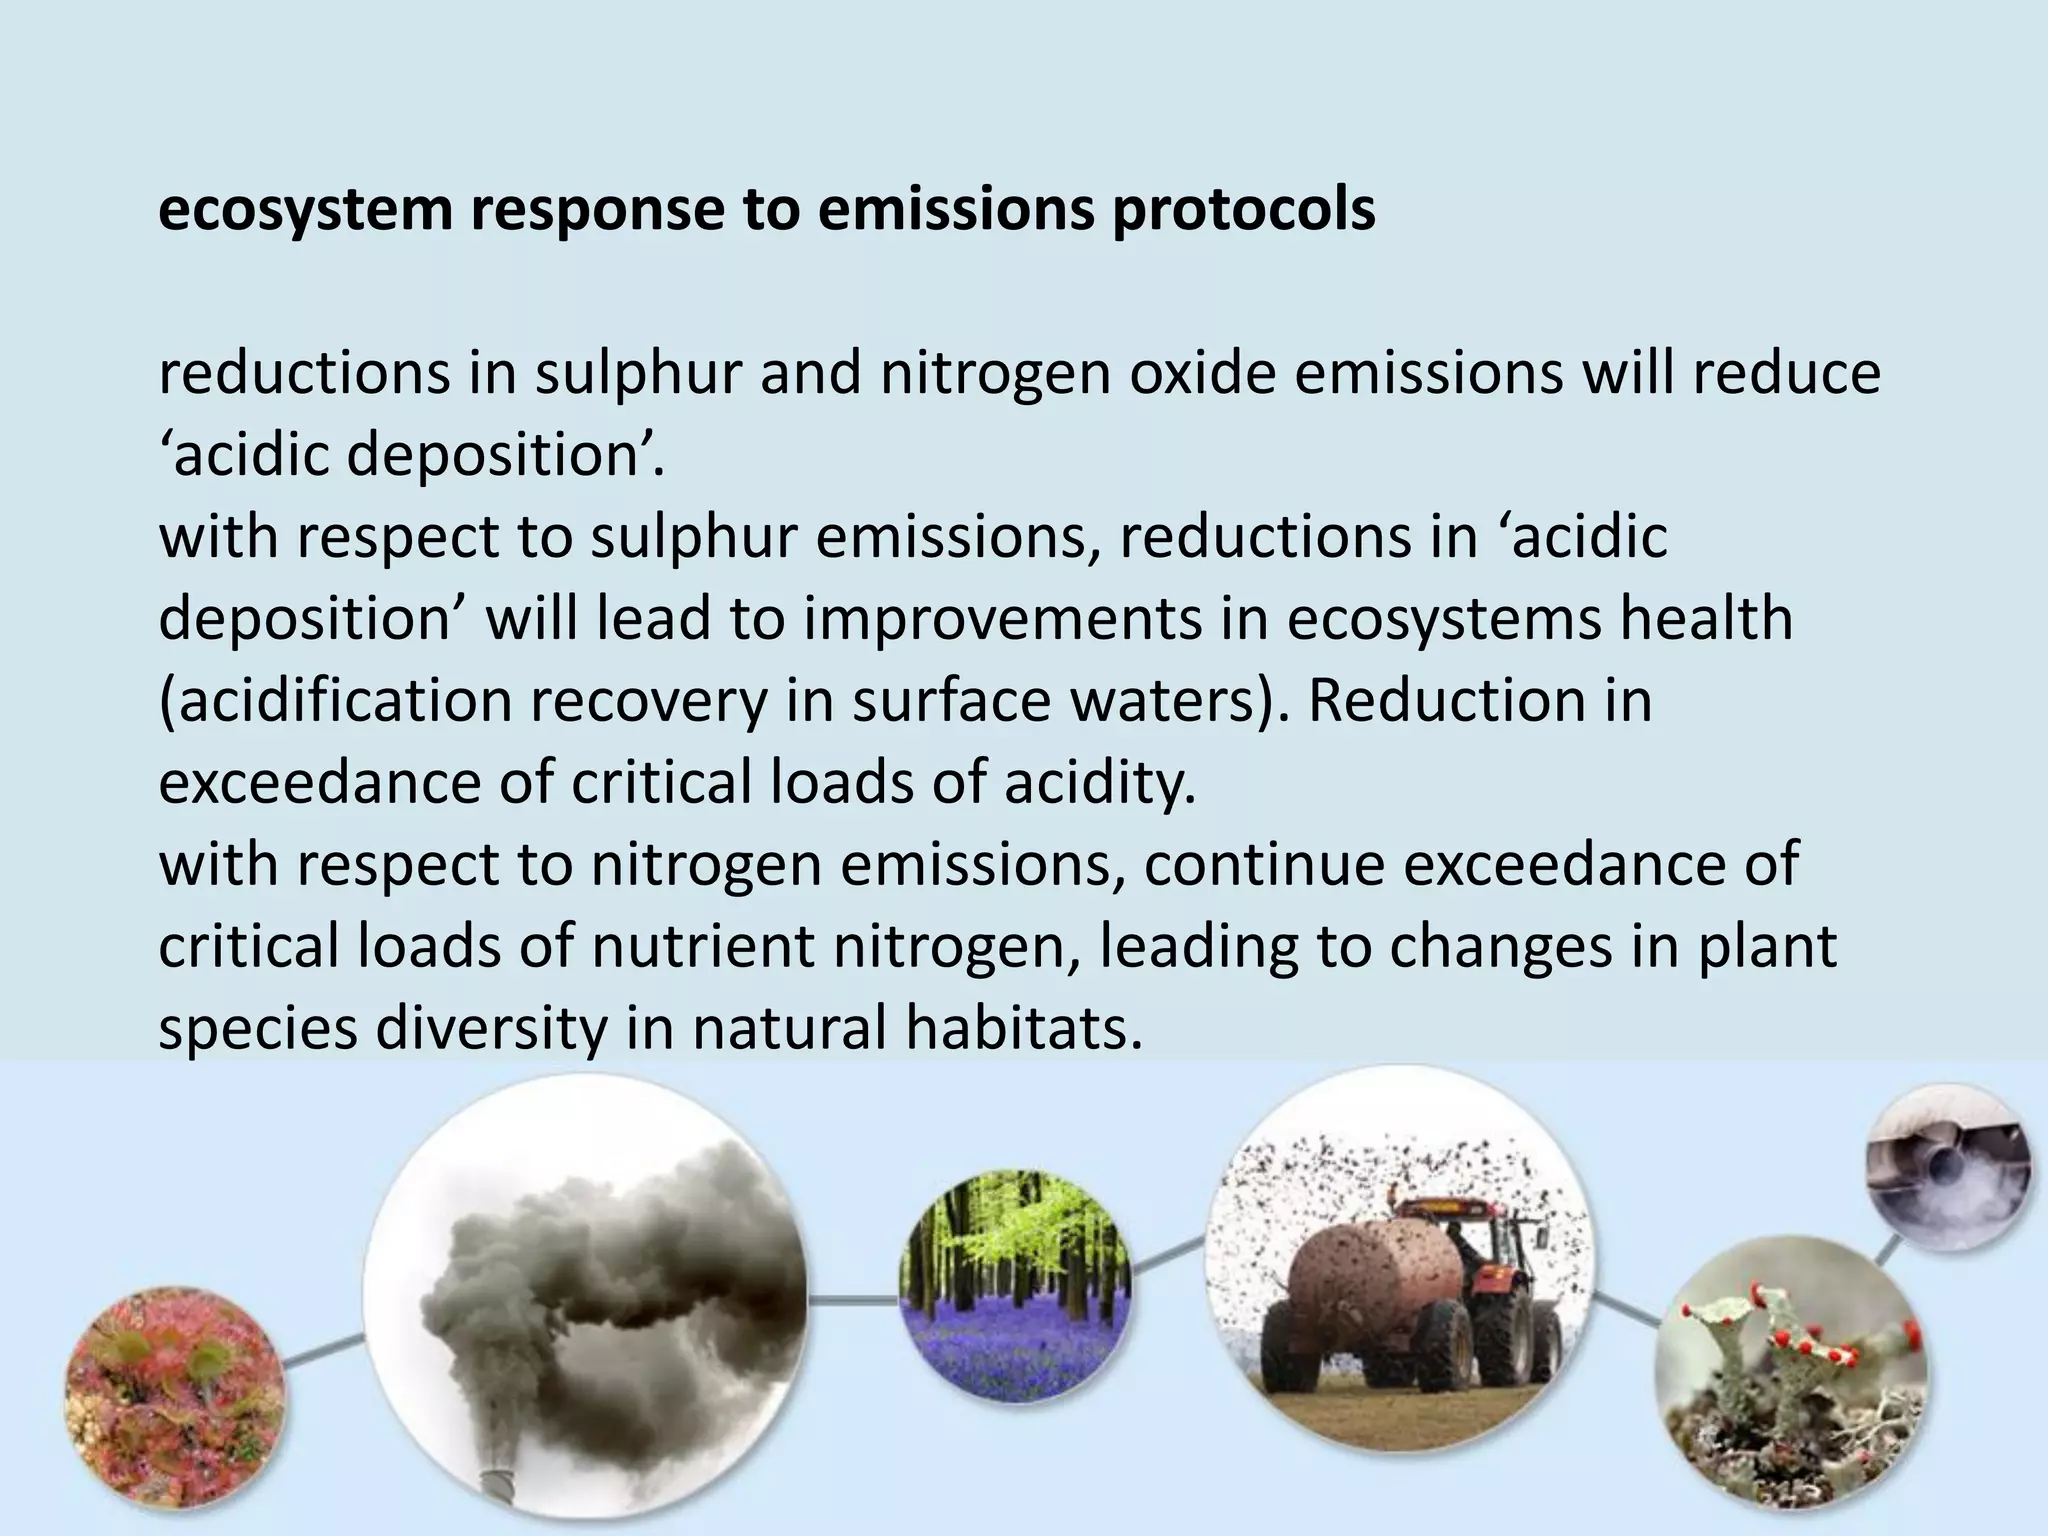
This document discusses the impacts of air pollution on ecosystems and the concept of critical loads. It establishes that air pollution from sulfur, nitrogen, and ammonia emissions can acidify soils and waters and reduce biodiversity. The Convention on Long-range Transboundary Air Pollution introduced critical loads to quantify air pollution thresholds to protect ecosystems. Reductions in sulfur emissions have decreased acid deposition and exceedances of critical acidity loads, but exceedances of nitrogen critical loads persist due to ammonia emissions affecting plant diversity. Agricultural ammonia emissions significantly contribute to air pollution deaths globally.


