Downloaded 104 times


 Absorbance Transmittance(%) E(L/mole-cm) L(cm)
30 2000 1.00
0.5 2500 1.00
2.5 x 10⁻³ 0.2 1.00
4.0 x 10⁻⁵ 50 5000
2.0 x 10⁻⁴ 150
[X](M) = Concentration in Mole/L](https://image.slidesharecdn.com/spectrometry-121105065347-phpapp02/85/Spectrometry-38-320.jpg)


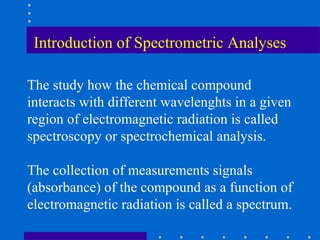
Spectroscopy involves using electromagnetic radiation to study chemical compounds and the interactions between radiation wavelengths and compounds. Different regions of the electromagnetic spectrum (e.g. ultraviolet, infrared, nuclear magnetic resonance) cause energy transitions in compounds through absorption. The energy and wavelength of absorbed radiation is directly related and allows compounds to be identified based on their unique absorption spectra. Spectrometers and fluorometers are instruments used to measure absorption and fluorescent emission spectra, revealing information about molecular structure and properties.