The document discusses brand valuation and provides information on:
1) What brand valuation is and why it is important as brands make up most of company value today rather than tangible assets.
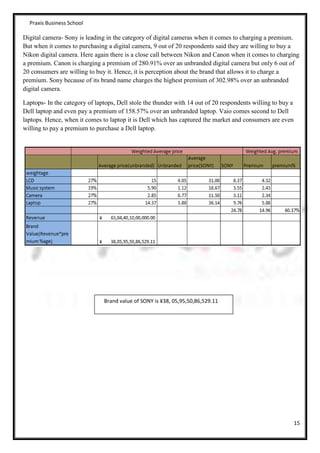
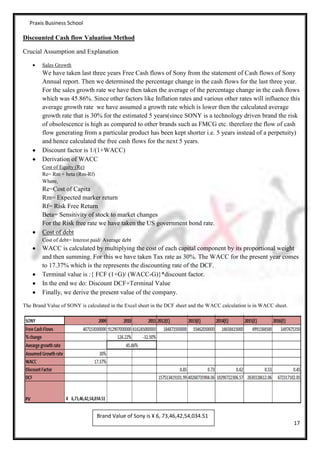
2) The main methods for valuing brands including discounted cash flow, price premia, and book to market.
3) How brand valuation became more standardized over the last 30 years and is now accepted under IFRS accounting standards.
1. The document outlines a brand valuation methodology used to estimate the value of the HP, IBM, and Dell brands.
2. Financial reports were analyzed to forecast cash flows over 5 years and in perpetuity, brand strength and role in purchase decisions were surveyed.
3. IBM was valued highest at $39,980 million, followed by HP at $23,980 million, and Dell at $557 million based on discounting brand earnings using brand strength-adjusted discount rates derived from Interbrand's methodology.
The document provides a summary of the brand valuation process for Colgate and Dabur oral care brands in India using the Interbrand valuation methodology. It analyzes the financial performance of the two companies, measures the role of branding index and brand strength scores through a consumer survey, and calculates the discounted cash flows to estimate the brand values. The valuation finds the brand value of Colgate to be Rs. 6088.29 crores and Dabur to be Rs. 678.21 crores for its oral care business in India. It recommends that Colgate continue its innovation strategy while Dabur needs to work on strengthening its brand connect.
This document provides a cost analysis of Amul ice cream's fruit and nut flavor. It includes an overview of the Indian ice cream industry and Amul company. A cost sheet is presented analyzing the direct costs to manufacture one 100g cup of Amul ice cream, including raw materials like milk, dry fruits, sugar, and flavors. The direct cost analysis finds the per unit cost of a single cup of Amul ice cream.
This document provides information about Amul ice cream including its history, products, market share, competitors, and costs. It summarizes that Amul ice cream was formed in 1946 as a dairy cooperative in India. In 1997, Amul entered the ice cream market in Mumbai and expanded to other cities between 1997-2002. It quickly became the number 1 ice cream brand in India with a 38% market share, four times larger than its closest competitor Kwality Walls. The document also includes cost sheets that breakdown the costs to produce 100,000 units of Amul ice cream.
1. The document discusses brand valuation methods and practice. It provides an overview of different approaches to defining and valuing brands.
2. Key aspects covered include defining brands, considering brands as assets, estimating a brand's profit contribution, and the various applications of brand valuation in accounting and marketing.
3. The traditional brand valuation model examines factors such as brand equity, channel benefits, product and service benefits, and price that contribute to overall brand value.
This document is a project report analyzing the cost sheet of Colgate Palmolive Ltd for the academic year 2013-2014. It provides background on the history and introduction of Colgate Palmolive. It then shares the cost sheet information obtained from Colgate's annual report. The cost sheet is presented showing the total costs, cost per unit, and analyses factors like direct materials consumed, factory overheads, administrative overheads, selling overheads, total cost of sales, profit, sales, profit volume ratio, break-even point and margin of safety. Formulas for important ratios are also defined. The report concludes with acknowledgements and bibliography citing sources.
Britannia Industries is one of India's largest food companies known for biscuits like Tiger and Marie Gold. The document analyzes the marginal costs of Britannia through a cost sheet showing materials, labor, overhead costs and profit/loss. It then performs a cost-volume-profit analysis, calculating the break-even point, profit-volume ratio, and margin of safety. Comparing 2011-2012, sales increased while expenses remained stable, improving the profit-volume ratio and increasing the margin of safety, lowering the company's risk level.
This document provides a cost accounting analysis for Pioneer Dairy Products Ltd., which manufactures milk and other dairy products in Manipal, India. It details the company's products, production capacity, budget period, factory costs, cost centers, cost allocation across departments, indirect cost absorption rates, time taken for products in each department, activities and their cost drivers. The goal is to accurately allocate costs to determine the total cost and selling price per unit for each product.
Cost Structure Analysis of Hindustan Unilever LimitedSunny Agarwal
The document analyzes the cost structure of Hindustan Unilever Limited (HUL) over several years. It finds that HUL's cost structure consists of 18% fixed costs and 82% variable costs. Advertising is the largest fixed cost at 14% of total costs. Raw materials are the largest variable cost at 34% of total costs. Compared to peer Procter & Gamble, HUL spends more on advertising and less on royalties and outsourced professional jobs. The document also performs a breakeven analysis and contribution volume profit (CVP) analysis for HUL.
Deviprasad Goenka Management college of Media Studies
http://www.dgmcms.org.in/
Subject:BRAND BUILDING
Lesson 7 : BRAND EQUITY
Faculty Name: Vishal Desai
This document discusses several models of brand building:
1. It describes Keller's model which involves designing an image for the target market segment, making customers aware of that image through appropriate features and benefits, and building associations that elicit strong, favorable responses and loyalty.
2. It explains Aaker's model which describes how advertising exposure can increase brand awareness, share information about attributes and benefits, create brand personality, build emotional associations, and link the brand to social groups to influence purchase behavior.
3. It outlines Levitt's model which posits that trial leads to brand building if the experience is satisfactory, as it will lead to repeat purchases, brand advocates, and brand equity that increases market share over time
This document discusses various methods for measuring brand equity, including qualitative, quantitative, and comparative methods. Qualitative methods involve unstructured techniques like free association and projective techniques to understand consumer perceptions. Quantitative methods use scales to measure brand awareness, image, and beliefs through tools like aided recall, multidimensional scaling, and analyzing purchase intentions. Comparative methods examine consumer response to brands and marketing programs through approaches like conjoint analysis and holistic methods that value brands.
This document is a cost sheet analysis of Tata Motors conducted by a group of students. It provides an overview of Tata Motors, including that it is a leading global automobile manufacturer. The analysis then classifies Tata Motors' costs as fixed, variable, or semi-variable/semi-fixed. Key metrics like breakeven point, profit/loss, PV ratio, and margin of safety are calculated. The importance of cost-volume-profit analysis is discussed as providing insights into pricing, costs, and profitability. In conclusion, the analysis provides lessons about focusing on sales volume while managing costs to achieve sustainable growth.
This document provides a cost analysis of Mahindra & Mahindra Ltd. for fiscal years 2012 and 2013. It summarizes the company's total costs, including direct costs, factory overheads, administration overheads, and selling and distribution overheads. It also analyzes profits, contribution margins, break-even points, and marginal safety using cost-volume-profit analysis. The summary concludes by calculating the estimated sales volume required to earn a desired profit of Rs. 100,000 based on the previous year's fixed costs and contribution margin ratio.
The document summarizes the history and operations of Gillette from its founding in 1901 to its acquisition by Procter & Gamble in 2005. It discusses key events such as Gillette's initial focus on safety razors, its expansion into international markets, and its eventual growth into a global leader in grooming products. The summary also provides an overview of Gillette's strategies in India, including launching customized products, establishing a wide distribution network, and focusing on core businesses through restructuring.
The document discusses the bottled water industry and Bisleri company. Some key points:
- The global bottled water market was worth $5.9 billion in 2019 and is expected to grow 7.6% annually.
- Bisleri is an Italian company established in India in 1965 and is a leading branded water company.
- The document outlines Bisleri's operations, products, segmentation, targeting, positioning and SWOT analysis. Market research methods including a plant visit are also discussed.
Dabur India Ltd is India's largest Ayurvedic medicine manufacturer founded in 1884. It has over 260 Ayurvedic medicines and is the 4th largest FMCG company in India with revenues of over Rs. 7,073 crore. The cost sheet shows that between 2011-12 and 2012-13, Dabur's sales increased from Rs. 5,283 crore to Rs. 6,146 crore and profits increased from Rs. 2,736 crore to Rs. 3,220 crore. The break-even point increased from Rs. 1,055 crore to Rs. 1,277 crore, while the margin of safety decreased slightly from 80% to 79.2%, indicating
Navratna Oil is the largest brand of Emami Ltd. It saw 25% volume growth and 30% revenue growth in 2010, and can sustain 15-20% growth on new variants in North India. Boroplus is the market leader in antiseptic creams with 74% share. It grew by 15% in FY2010. Himani Fast Relief increased its market share from 11% to 13% and grew by 6% in FY2010, though it has potential for higher growth across more product categories and forms.
Market segmentation involves identifying customer groups with similar attributes. It can be based on demographics, psychographics, behaviors, benefits, or other factors. Targeting refers to selecting specific customer segments to target with marketing efforts. Positioning is differentiating a brand by the benefits it offers customers in their minds. Effective positioning communicates what a brand stands for versus competitors to complement segmentation and targeting strategies.
This document provides details about a summer report submitted by Himanshu Choumal for his Master's degree program. The report focuses on assessing industrial customers' perceptions of cars in Gwalior, India and was conducted at Maruti Suzuki. The document includes sections on declaring no plagiarism, obtaining approval from the faculty guide, acknowledging those who provided assistance or support, and preface/contents outlines. It appears to be a standard report format and submission for an academic course project.
The document summarizes the product life cycle of Bisleri bottled water in India. It describes the four stages of the product life cycle: introduction, growth, maturity, and decline. It then provides details about Bisleri's introduction in 1965, its growth throughout the 1980s and 1990s as it expanded operations and saw exponential growth. The summary discusses Bisleri's marketing strategies including market segmentation targeting different package sizes to different customer groups, and competitors in the bottled water market like Kinley and Aquafina.
This document discusses brand personality and how it relates to consumer personality. It defines brand personality as the human characteristics associated with a particular brand. Certain brands have specific personalities like sincere, excitement, competence, sophistication, or ruggedness. Matching a brand's personality to the personality of its target consumers helps the brand resonate better and create loyalty. Celebrity endorsements can help personify a brand's personality. The document also discusses user imagery and sponsorship as ways to convey a brand's personality. In the end, it lists some references and books on consumer behavior and brand personality.
This document provides an overview of brands and brand management. It defines what a brand is, distinguishes brands from products, and explains the five levels of meaning for a product. It discusses why brands are important for both consumers and firms in reducing risk, simplifying decisions, and acting as a source of competitive advantage and financial returns. The document also outlines the strategic brand management process and introduces concepts like brand positioning, marketing programs, performance measurement, and growing brand equity.
This document compares the financial performance of Maruti Suzuki India Limited (MSIL) and Mahindra & Mahindra Limited (M&ML) based on their financial statements. It analyzes various ratios such as liquidity, leverage, activity and profitability ratios of both companies. Overall, MSIL has better liquidity and debt ratios while M&ML has higher returns and asset utilization. The document also discusses the core values, vision and mission of both companies.
This document is a project report submitted by Garima Arora comparing the Lava and Micromax mobile companies. It includes declarations, acknowledgements, and chapters introducing each company. The Lava chapter describes the company's history starting in 2009 in India, its product portfolio including smartphones, feature phones and tablets, and awards it has received. The Micromax chapter discusses how it started in 2000 and entered the mobile market in 2008, its expansion including becoming India's top seller, manufacturing facilities, celebrity endorsements, and its focus on affordability and innovation.
The document summarizes information about the Marico company and its Parachute brand of coconut hair oil. Marico was founded in 1957 in Mumbai, India and is a leading consumer products company in India. Parachute is Marico's flagship brand and India's leading hair oil. It has dominated the hair oil category for decades with a 53% market share. Parachute is positioned as a pure coconut oil that nourishes hair, and through constant innovation, has remained India's most trusted haircare brand.
The document discusses several products that failed in the market due to issues with their marketing strategies. Some key reasons for failure included targeting the wrong customer segment, having an unnecessary or unclear value proposition, being overpriced, facing quality issues, and not differentiating effectively from competitors. Specific examples that failed due to these issues include Vanilla Coke, Levis Type 1 jeans, Crystal Pepsi, the Apple Newton, the Commodore Amiga 1000 computer, the Godrej Doodh Ganga milk brand, the Maruti Suzuki Sierra SUV, and the Honda Street motorcycle.
The Gujarat Fisheries Central Co-operative Association Limited had a project involving mobile fish-selling vans that traveled to fishing villages. The main source of revenue for the Association, nearly 98 percent, came from selling diesel to fishing boat owners. Other activities included fish seed production, manufacturing fishing nets, and constructing fiberglass fishing boats. Each mobile van was staffed by a driver, cutter, and supervisor.
The document discusses various methods for valuing brands, including cost-based, income-based, and market-based methods. It also covers strategies for developing an effective brand, including defining the brand vision, positioning, and personality. Key aspects of an integrated branding and marketing strategy are outlined.
The document discusses brand evaluation and valuation. It begins by defining what a brand is and why brands need to be valued. It then describes several methods that can be used to assess the value of a brand, including historical cost, replacement cost, market value, premium price, royalty relief, Young and Rubicon's brand asset valuator model, and economic use methods. Each method is explained along with its advantages and limitations. The document concludes by reiterating that brands are important assets for organizations and that different valuation techniques can be used to determine a brand's financial worth.
NEED OF BRAND VALUATION: A brand can be valued anytime and for many reasons, that includes- Brand strategy, Financial Reporting, Mergers and acquisitions, value reporting, licensing, legal transaction, accounting, strategic planning, management information, taxation planning and compliance, liquidation.
Brands build equity through developing strong brand awareness, perceived quality, and loyalty over time. Brand equity provides value to both customers and firms. For customers, brand equity helps process information and make confident purchase decisions. For firms, brand equity enhances customer attraction and retention, allows premium pricing, and creates barriers for competitors. Building strong brands is challenging due to market complexity and pressure to prioritize short-term goals over long-term brand investment.
The document provides an overview of brand equity including:
1. It defines brand equity as the value customers attach to a brand based on perceptions and associations with that brand.
2. Brand equity can be measured both qualitatively through customer perceptions and associations, and quantitatively through financial valuation methods.
3. Increasing brand equity can be done by strengthening brand loyalty through frequent buyer programs or affinity programs, or by raising price if customers perceive value at the higher price point.
Peter Harris presented on evaluating brand equity. The presentation covered:
1) The value contribution of brands and how intangible assets like brands are a key source of corporate value.
2) Different approaches to measuring brand equity, including brand valuation, brand asset valuing, and customer perception metrics.
3) The need for a better approach that links customer perceptions and market performance to financial value to assess return on marketing investment over time.
Despite their poor cricket performance, the Kolkata Knight Riders have emerged as the strongest IPL brand. UK’s Intangible Business, a world leading brand valuation company, in collaboration with MTI Consulting, a fast growing international strategy consultancy, have just released the IPL Brand Value Scoreboard 2009 – a pioneering valuation aimed at measuring the strengths of the 8 IPL Franchises
It contains the general imformation about the brand SONY. Two hypothesis has een chosen and data has been collected accordingly. Based on the data analysis we have given the final conclusions.
Alto K10 - Social Media Activation Case StudyMedia Redefined
The document summarizes Maruti Suzuki's social media activation campaign for the Alto K10 model from August 2010 to March 2011. It describes the objectives of establishing a presence on Facebook, Twitter, and YouTube to promote the car, engage customers, and monitor sentiment. Key initiatives included regular product updates, queries handling, contests, and analyzing growth in fans/followers. The efforts resulted in over 130,000 Facebook fans and 1,650 Twitter followers, helping to drive 2% of Alto K10 sales.
This document discusses customer delight and satisfaction. It defines customer delight as exceeding customer expectations and identifies five types of customer expectations ranging from basic to unbelievable. It emphasizes understanding customers, including who they are, what they want and need, and why they like or dislike the company. Customer satisfaction is determined by comparing perceived service to expected service, with higher satisfaction resulting from better than expected service. The document provides examples of how one company strives to meet or exceed customer expectations to increase satisfaction and loyalty through surveys and improvement efforts.
This document outlines the steps to value a brand using the income-based approach. It discusses valuing a major Indonesian FMCG brand. It includes:
1. Calculating the Brand Value Added (BVA) Index through an online survey to measure brand attributes.
2. Determining the brand beta based on the BVA Index score.
3. Calculating the discount rate using the equity risk premium, specific market sector risk, and brand beta.
4. Forecasting cash flows from brand earnings over 5 years and calculating the present value of the cash flows and residual value to determine the overall brand value.
The brand was valued at 416 billion Indonesian rupiah.
Intranets and extranets are communication tools that’s needed to set the Private and outside access for your E-Commerce Website, this forms the basic step of you IT Structure.
For more such innovative content on management studies, join WeSchool PGDM-DLP Program: http://bit.ly/Sldeshareecoomercewelearn
Join us on Facebook: http://www.facebook.com/welearnindia
Follow us on Twitter: https://twitter.com/WeLearnIndia
Read our latest blog at: http://welearnindia.wordpress.com
Subscribe to our Slideshare Channel: http://www.slideshare.net/welingkarDLP
This document discusses approaches to valuing brands. It describes brands as conveying attributes, benefits, values, and culture to consumers. Brand valuation estimates the total financial value of a brand and can be used for strategic planning, mergers and acquisitions, and other purposes. Traditional approaches to valuation include cost-based, market-based, and income-based methods. Income-based approaches like relief from royalty and premium price focus on the profits generated by brand ownership. Research-based approaches measure consumer perceptions and brand equity through attributes like awareness, preference, and recommendation to quantify how brands impact purchasing behavior and financial performance.
The document discusses key concepts in branding and brand management. It defines brands and brand equity, and outlines several models for measuring brand equity. It also discusses the role of brands for both consumers and marketers, and how brands can be built by developing brand elements, marketing activities, and secondary associations. Methods for measuring and managing brand equity are presented, including brand portfolios and brand extension strategies.
This valuation report estimates the fair market value of NIKE Inc. as of December 31, 2015. NIKE is the largest seller of athletic footwear and apparel worldwide. The report provides an overview of NIKE's business operations, the athletic industry, reconstructed financial statements, and valuation using asset-based, market-based, and income-based approaches. The report concludes with a determination of NIKE's business value based on a synthesis of the different valuation methods.
The document provides information on a project report submitted by students to their professor on measuring brand image of Sony. It includes:
1) A history and evolution of Sony from its founding in 1946 to present day, outlining major product launches.
2) An overview of the Brand Asset Valuator (BAV) model used to measure brand health across four pillars - differentiation, relevance, esteem, and knowledge.
3) Details on data collection for the project, including a quantitative questionnaire and qualitative research methods like focus groups and interviews to understand consumer perceptions of Sony.
This report provides an equity valuation of eBay Inc. for potential investors. It includes an analysis of the global e-commerce industry and eBay's performance. The report values eBay under bull, base, and bear case scenarios using discounted cash flow valuation, comparable analysis, and sum-of-the-parts valuation. The analyst discloses having previously sold items on eBay and provides a 12-month target price and recommendation.
The document discusses brand valuation and the total brand value, which has both an economic value and social value. The economic value is most visible during acquisitions when a brand's value can increase a company's shareholder value. Research-based, financially driven, and economic use approaches are used to value brands, with the economic use approach combining brand equity with financial measures. Brand valuation is now widely used for strategic brand management and financial transactions to increase shareholder value and properly account for brand assets.
Duff & Phelps, the premier global valuation and corporate finance advisor, today announced findings from its 2016 report on celebrity brand values in India. The report, Embracing the Change: A Concise Report on India’s Most Valuable Celebrity Brands, is the second edition of Duff & Phelps’ study.
“This year’s report recognizes the rise of women celebrity endorsers to the top of the brand value rankings” said Varun Gupta, Managing Director and Japan and Southeast Asia Leader. “In our 2014 celebrity brand valuation report we forecasted a change towards female celebrity endorsers becoming A-listers. That change has definitely been realized over the last two years.”
The report highlights evolving trends in celebrity endorsements, including increased usage of co-ownership models whereby celebrities hold an ownership stake in the brands they endorse, an increase in the use of celebrity endorsements in the e-commerce space and an increase in celebrities leveraging their brands through extensions into both related and unrelated product endorsements.
The document provides an analysis of brand valuation for Cadbury Dairy Milk chocolate in India using the Interbrand methodology. It summarizes the brand equity analysis conducted in Phase 2 and then performs brand valuation in Phase 3. Key information used includes financial data from 2009-2011, assumed growth rates, and industry benchmarks. The analysis determines the Role of Brand Index and Brand Strength Score for Cadbury Dairy Milk and Cadbury 5 Star. It finds that Cadbury Dairy Milk has high brand strength and moderate role of brand, indicating potential to leverage the brand into new categories like cookies and cakes.
1. The document outlines a brand valuation methodology used to estimate the value of the HP, IBM, and Dell brands. It analyzes the annual reports of the companies to forecast cash flows and applies Interbrand's three pillar brand valuation model.
2. A survey was conducted to determine the role of branding and brand strength scores for each brand. These scores were used to calculate brand earnings and discount rates.
3. The brand values estimated were $23980.83 million for HP, $39980.23 million for IBM, and $557.48 million for Dell. IBM was valued the highest while Dell was valued the lowest.
Brand valuation refers to the process of determining how much a brand is worth in terms of the financial value perceived or money that a third party is ready to pay for.
The document provides an analysis of brand valuation for Cadbury Dairy Milk chocolate in India using the Interbrand methodology. It determines the brand strength score and role of brand index for Cadbury Dairy Milk and compares it to Cadbury 5 Star. The analysis finds that Cadbury Dairy Milk has a brand strength score of 100 and role of brand index of 45%, indicating it is a high brand strength brand with some dependence on other factors. This positions it well to be extended to other product categories like cookies and cakes.
Financial applications for brand valuation_Interbrand_MikeRochaMichael Rocha
The document discusses various financial applications for brand valuation, including brand management, strategy/business case development, and financial applications. It provides examples of how Interbrand has used brand valuation to help clients with investor relations, mergers and acquisitions, licensing and royalty rates, tax valuations, and other matters. The document also describes Interbrand's brand valuation methodology and how it assesses both internal and external factors to evaluate brand strength.
Brand valuation provides a strategic tool to quantify the value of a brand and assess its performance and contribution to business results. It considers the brand's influence on customers, employees, and investors. Interbrand's methodology measures the brand's financial performance, role in purchase decisions, and strength through factors like clarity, commitment, protection, and responsiveness. Brand valuation helps companies set strategy, invest in brands, and communicate their value to stakeholders.
This document discusses brand valuation, including its meaning, need, and methods. Brand valuation is defined as calculating the value of a brand or the amount someone would pay for it. It is needed for brand strategy, financial reporting, mergers and acquisitions, and more. Traditional methods include cost-based, market-based, and income-based approaches. The income-based relief from royalty method and premium price method estimate value based on royalty rates and price premiums. Research-based approaches use consumer behavior metrics and brand attributes/scores. Brands account for over one-third of shareholder value on average.
The document discusses brand valuation and the Interbrand model for calculating brand value. It summarizes the key aspects of the Interbrand methodology which includes analyzing the financial performance, role of the brand, and brand strength to determine the economic value generated by a brand. The brand value is calculated by multiplying the economic profits by the role of brand index, and then discounting it using the brand strength score-derived discount rate. The document provides an example valuation of the Colgate and Dabur brands in India using a variation of this model.
This document summarizes a marketing presentation about creating brand equity and crafting brand positioning. It discusses key concepts like brand equity, customer-based brand equity, building brand equity through identity, meaning, response and relationships. It also covers choosing memorable, meaningful, likable, transferable, adaptable and protectable brand elements. Other topics include internal branding, the brand value chain, and crafting brand positioning by identifying points of parity and points of difference compared to competitors. Examples are provided for Lifebuoy and Sandalina Sandal Soap brands.
A distinguishing symbol, mark, logo, name, word, sentence or a combination of these items that companies use to distinguish their product from others in the market. Once a brand has created positive sentiment among its target audience, the firm is said to have built brand equity. Some examples of firms with brand equity - possessing very recognizable brands of products - are Microsoft, Coca-Cola, Ferrari, Sony, The Gap and Nokia.
This document is a report submitted to Prof. Govindrajan that measures the brand equity of Dove soap. It contains an executive summary that outlines the advantages of brand equity, describes two models used to measure brand loyalty, and discusses leveragability and brand equity calculations. The findings show that Dove has strong brand recognition but a weak supply chain. It recommends that Dove improve its supply chain, work on campaigns people can relate to more, and expand into product categories like antiseptic soaps that show high leveragability.
The document discusses various aspects of branding, including the evolution of branding over time, key components of branding like brand equity and brand elements, models for measuring brand equity, and challenges in building brand awareness. It provides examples of how companies develop their brand identity through elements like names, logos, slogans, and positioning strategies. It also outlines the importance of marketing programs and advertising in creating brand value and equity with customers.
Branding and Brand Positioning / Marketing Management By Kotler KellerChoudhry Asad
This document provides an outline on branding and brand positioning. It defines what a brand and branding are, and lists advantages of strong brands such as improved perceptions, loyalty, margins, and marketing effectiveness. It discusses key aspects of branding including brand elements, equity, strategies, and portfolios. It also covers brand positioning and differentiating a brand through points of parity and points of difference. The document aims to educate on developing and managing brands for optimal market performance and value.
The document discusses brand equity and its measurement. It defines brand equity as the incremental contribution ($) per year obtained by the brand compared to an unbranded product. Brand equity is driven by consumers' increased choice probability for the branded product. The approach measures three sources of brand equity - brand awareness, attribute perceptions, and non-attribute preferences - and how much each contributes to brand equity directly and indirectly through brand availability. Applying this method provides what-if analysis to predict strategies for enhancing brand equity.
A brand experience is any interaction a person has with a brand through various touchpoints. A touchpoint is any place or interface where a person interacts with or experiences a brand. These experiences, along with indirect experiences like word-of-mouth, shape a person's brand image and perception over time. A brand platform establishes the elements that make a brand unique and valuable, such as its positioning in the market, competitors, differentiators, and stakeholders. It provides guidance for consistent brand messaging. There are various methods to value a brand, including cost-based methods using assets, income-based methods capitalizing earnings, and market-based methods comparing to similar brands.
This document discusses branding and brand equity. It defines branding as differentiating a product or service from competitors through elements like names, terms, symbols or designs. Brand equity refers to the added value a brand name provides in how consumers think of and react to a brand, as well as the profits and market share the brand generates. There are three perspectives of measuring brand equity - financial (price premium a brand commands), brand extensions (leveraging brand awareness to launch related products), and consumer-based (how a brand strengthens consumer attitudes). Strong brands are valuable assets that can benefit companies for generations by building customer loyalty and trust.
This document provides a review and comparison of two models for valuing brands: the Interbrand model and the Brand Capability Value (BCV) model. The Interbrand model values brands based on a company's profits after subtracting capital costs and multiplying by a brand role index. The BCV model values brands based on projected cash flows from branding expenses discounted to present value. The authors propose modifications to the BCV model, including changing how the brand's contribution to cash flows is calculated and using the Capital Asset Pricing Model to estimate the discount rate.
1. The document discusses valuing brands like Nike by comparing the enterprise value to sales ratio of premium brands versus lesser known brands in the same industry.
2. For Nike, the methodology calculates enterprise value to sales ratios for Nike, Adidas, and a generic brand called Brown Shoe Co.
3. Comparing Nike's ratio of 1.665 to Adidas' 0.840 suggests the value of Nike over Adidas is $15.63 billion, representing the premium captured due to Nike's brand strength.
1) Google has overtaken Apple as the world's most valuable brand, with a brand value of $109 billion compared to Apple's $107 billion.
2) Apple's brand value declined 27% as its technological advantage has diminished and it has failed to generate significant revenue from new products like the Apple Watch.
3) Google remains strong in its core search business, which generates most of its advertising revenue, and has improved its underlying brand equity, helping drive its continued growth.
Leggi il dossier completo Global 500, edizione 2017 Agi
1. The document summarizes Brand Finance's methodology for valuing global brands in its annual Brand Finance Global 500 report.
2. Brand Finance values brands using a royalty relief approach, estimating future revenues attributable to the brand and calculating a royalty rate brand owners would pay to use the brand if they did not already own it.
3. Brand strength, sector royalty rates, forecasted revenues, and post-tax discounting are used to determine individual brand values.
The document is a project report submitted by Nahid Anjum for IFB Industries Limited on improving their secondary distribution model in Chandigarh, India. It provides an overview of IFB Industries which manufactures appliances and components. It also describes the Chandigarh operations, analyzes the industry and company, details the project to develop a new secondary distribution model, and evaluates the benefits of the recommended model.
IFB is an Indian appliance manufacturer with a strong brand in home appliances. It has a wide product range including washing machines, microwaves, and dishwashers. While IFB has strengths in brand, innovation, and service, it also faces challenges from low-cost imports and rising material costs. The analysis examines IFB using Porter's five forces, PEST, SWOT, and other frameworks to understand opportunities for growth and threats in the competitive market.
Retail Management In Practice on Spencer'sNahid Anjum
This document provides details about a project report submitted by Nahid Anjum for her post graduate program in business management. The report focuses on her experience working with Spencer's Retail in Kolkata. It includes an acknowledgment section, preface, objectives of the project, introduction to Spencer's Retail including its history, operations, and vision. The report also discusses the importance of technology in retail and Spencer's implementation of an ERP system to support its rapid growth.
Kalpana Chawla was born in 1961 in India. She earned degrees in aeronautical and aerospace engineering. She worked as a research scientist at NASA Ames Research Center and other companies, specializing in aerodynamic simulation and optimization. In 1994, she was selected by NASA to be an astronaut. She served as a mission specialist on Space Shuttle Columbia flights in 1997 and 2003, when the shuttle disintegrated upon reentry, killing all seven crew members including Chawla.
This document appears to be a presentation on ICICI Bank submitted for a strategic management project. It includes an agenda covering topics like revenue, growth, market capitalization, business model, industry analysis, financial analysis, products and services by segment, competition, strategies, and more. Charts are included analyzing ICICI Bank's revenue, market capitalization, and various profitability ratios from 2008-2011.
The document discusses the chain of derived demand for plywood. Plywood relies on inputs from the wood cutting, processed wood, adhesive, chemical, and machinery industries. It is then used downstream in industries like furniture, electronics, marine, transportation, commercial vehicles, education, and more. Finally, it reaches end consumers for uses like interior decoration, matchsticks, and more. Key competitors for plywood include industries using alternative materials like polyvinyl carbonate, recycled products, aluminum, wax, fiberglass, and bamboo.
Market segmentation of IFB commercial dishwasher Nahid Anjum
This document summarizes the market segmentation for commercial dishwashers sold by a $250 million company. It discusses the demographics of customers in hotels, restaurants, and hospitals. It also outlines the key operating variables, purchasing approaches, situational factors, and buyers' personal characteristics to consider when marketing these dishwashers. Purchasing criteria include online/direct approaches and seeing product details and demos. Buyers are motivated by efficiency, cost savings, and best serving customers.
Basel II norms define operational risk as the risk of loss resulting from inadequate or failed internal processes, people and systems or from external events. Basel II is the international capital adequacy framework for banks that prescribes capital requirements for credit risk, market risk and operational risk. There are three approaches under Basel II to measure and manage operational risk: the Basic Indicator Approach, which is based on annual revenue of the Financial Institution; the Standardized Approach, which is based on annual revenue of each broad business line; and the Advanced Measurement Approaches, which rely on the bank's internally developed risk measurement framework.
The Three Pillars of the Basel II AccordNahid Anjum
The three pillars of the Basel II accord establish standards for how much capital banks need to hold against risks. The first pillar deals with calculating regulatory capital requirements for credit, operational, and market risk. The second pillar provides a framework for banks to review their risk management systems and assess internal capital adequacy. The third pillar aims to complement the minimum capital requirements by requiring banks to disclose information allowing markets to assess their capital adequacy.
Tier 1, 2 and 3 Capital based on the Basel II accordNahid Anjum
The document discusses the three tiers of capital requirements under the Basel II accord:
Tier 1 capital consists of core equity and reserves, and must comprise at least 50% of a bank's total capital base. Tier 2, or supplementary capital, includes undisclosed reserves, revaluation reserves, general provisions, and various subordinated debt instruments. Tier 3 capital is short-term subordinated debt limited to 250% of Tier 1 capital required to support market risks, with a minimum of 281⁄2% of market risks supported by Tier 1 capital.
Use of social media to leverage businessNahid Anjum
This document discusses using social media in business. It defines social media and outlines why businesses should use social media by highlighting statistics on internet and social media usage in India. It then explains how businesses can use major social media platforms like Facebook, Twitter, blogs, LinkedIn and Google to engage customers, track brands, execute online campaigns and use social media for customer relationship management. Finally, it provides examples of companies that are effectively using social media for activities like recruitment, contests, product design and advertising campaigns.
Recruitment and Selection in FMCG IndustryNahid Anjum
This document provides an overview of the FMCG sector including its characteristics, levels, job roles, requirements, and how it differs from other sectors like IT and financial. It analyzes 4 FMCG players - Cadbury, GSK, ABD, and Heinz. It discusses the FMCG sector in terms of its characteristics like stability, growth potential, and nationwide opportunities. It outlines the different levels and job roles in the sector and how one can progress between the roles. It also covers the requirements, schemes, policies, and benefits of working in the FMCG sector.
The document provides a report on measuring brand equity for the Sony brand. It includes an introduction, executive summary, methodology, questionnaire, findings and recommendations. The findings section analyzes Sony's brand equity based on brand satisfaction, loyalty, perceived quality, personality and leveragability. It was found that customers are highly satisfied with Sony and have high brand loyalty. Sony also has strong perceptions of quality, a good personality and potential for brand extensions.
The document discusses the Mumbai Dabbawalas lunch delivery system. It summarizes that the Dabbawalas were successful due to their [1] operational efficiency through coding, teamwork, and logistics; [2] work culture of ethics, customer focus, and unity; and [3] low expectations and good reputation over time with no competitors. Some challenges they may face are low earnings, increased competition, and changing roles of housewives. However, the document predicts the Dabbawalas will survive for 50 more years due to their customer-centric philosophy and rising costs of outside food. It suggests the Dabbawalas could find new customers.
The document presents the results of a survey about operating system preferences. It finds that compatibility, ease of use, performance, and support are the most important features to respondents. The survey also examines attitudes towards Mac OS and whether recommendations from friends/family influence choices. While 80% of respondents said they would try Mac OS for free, only 35% said they would use Mac if it could be installed on any computer. The survey identifies areas where Mac is lacking compared to importance ratings, such as family ties to Apple and prestige. Trend analyses show Mac receiving less attention than Microsoft in news, search queries, discussions, and social media.
The document discusses the means-end-chain framework and applies it to laptops. It introduces means-end-chain theory, then discusses a laptop product by outlining its concrete and abstract attributes, functional and psycho-social benefits, and instrumental and terminal values according to the means-end-chain model. The document aims to analyze how attributes, benefits, and values are related for laptops using the means-end-chain approach.
Cadbury Dairy Milk has been the market leader in chocolate in India for years. It was first launched in 1905 and became Cadbury's best-selling line by 1913. In the early 1990s, Cadbury repositioned Dairy Milk from being "just for kids" to appealing to the "kid in all of us" through campaigns focusing on spontaneity and shared feelings. In the late 1990s, Cadbury expanded its product line and shifted its focus to wider chocolate consumption among adults and celebrating special occasions through advertisement campaigns providing reasons to enjoy chocolate.
XYZ Business School presents its distance learning program. It is a top 10 business school in India established in 1992 in Kolkata. It offers full-time and distance learning programs affiliated with a US university and recognized by DEC New Delhi. The distance learning program addresses the need for continued technical education in the growing IT sector and allows professionals to remain updated despite lack of time. It offers customized courses using cutting-edge curriculum, reputed faculty with industry experience, and latest technology like video conferencing and online courses. The program benefits employees through greater retention, equity, productivity and stronger client base. The 52-week program meets for 6 hours weekly and includes written tests every 3 months. Fees include program, course materials, and learning
This document outlines a research study to understand and address the problem of gender selection of fetuses in India. It presents an agenda that includes defining the management decision and marketing research problems, as well as the proposed research design and recommendations. The research design involves collecting both qualitative and quantitative data through surveys of families to understand the psychographic profiles and motivational factors for preferring male children, and to assess the effectiveness of government efforts. Recommendations include government programs for women's employment and financial support for educating girl children, especially in lower income groups, to reduce viewing females as economic liabilities.
This document discusses reward management strategies at Shoppers Stop and Spencers. It outlines various award programs like "Jo Jeeta Wohi Sikander" and "Ubharta Sitara" at Shoppers Stop that aim to promote performance and encourage new employee development. Similarly, it describes Spencers' strategies like Best Store Award, Best Customer Service Associate Award, and Honesty Award which target objectives like sales growth, customer service and integrity. Selection criteria and frequencies for these different programs are also provided.
LAND USE LAND COVER AND NDVI OF MIRZAPUR DISTRICT, UPRAHUL
This Dissertation explores the particular circumstances of Mirzapur, a region located in the
core of India. Mirzapur, with its varied terrains and abundant biodiversity, offers an optimal
environment for investigating the changes in vegetation cover dynamics. Our study utilizes
advanced technologies such as GIS (Geographic Information Systems) and Remote sensing to
analyze the transformations that have taken place over the course of a decade.
The complex relationship between human activities and the environment has been the focus
of extensive research and worry. As the global community grapples with swift urbanization,
population expansion, and economic progress, the effects on natural ecosystems are becoming
more evident. A crucial element of this impact is the alteration of vegetation cover, which plays a
significant role in maintaining the ecological equilibrium of our planet.Land serves as the foundation for all human activities and provides the necessary materials for
these activities. As the most crucial natural resource, its utilization by humans results in different
'Land uses,' which are determined by both human activities and the physical characteristics of the
land.
The utilization of land is impacted by human needs and environmental factors. In countries
like India, rapid population growth and the emphasis on extensive resource exploitation can lead
to significant land degradation, adversely affecting the region's land cover.
Therefore, human intervention has significantly influenced land use patterns over many
centuries, evolving its structure over time and space. In the present era, these changes have
accelerated due to factors such as agriculture and urbanization. Information regarding land use and
cover is essential for various planning and management tasks related to the Earth's surface,
providing crucial environmental data for scientific, resource management, policy purposes, and
diverse human activities.
Accurate understanding of land use and cover is imperative for the development planning
of any area. Consequently, a wide range of professionals, including earth system scientists, land
and water managers, and urban planners, are interested in obtaining data on land use and cover
changes, conversion trends, and other related patterns. The spatial dimensions of land use and
cover support policymakers and scientists in making well-informed decisions, as alterations in
these patterns indicate shifts in economic and social conditions. Monitoring such changes with the
help of Advanced technologies like Remote Sensing and Geographic Information Systems is
crucial for coordinated efforts across different administrative levels. Advanced technologies like
Remote Sensing and Geographic Information Systems
9
Changes in vegetation cover refer to variations in the distribution, composition, and overall
structure of plant communities across different temporal and spatial scales. These changes can
occur natural.
ISO/IEC 27001, ISO/IEC 42001, and GDPR: Best Practices for Implementation and...PECB
Denis is a dynamic and results-driven Chief Information Officer (CIO) with a distinguished career spanning information systems analysis and technical project management. With a proven track record of spearheading the design and delivery of cutting-edge Information Management solutions, he has consistently elevated business operations, streamlined reporting functions, and maximized process efficiency.
Certified as an ISO/IEC 27001: Information Security Management Systems (ISMS) Lead Implementer, Data Protection Officer, and Cyber Risks Analyst, Denis brings a heightened focus on data security, privacy, and cyber resilience to every endeavor.
His expertise extends across a diverse spectrum of reporting, database, and web development applications, underpinned by an exceptional grasp of data storage and virtualization technologies. His proficiency in application testing, database administration, and data cleansing ensures seamless execution of complex projects.
What sets Denis apart is his comprehensive understanding of Business and Systems Analysis technologies, honed through involvement in all phases of the Software Development Lifecycle (SDLC). From meticulous requirements gathering to precise analysis, innovative design, rigorous development, thorough testing, and successful implementation, he has consistently delivered exceptional results.
Throughout his career, he has taken on multifaceted roles, from leading technical project management teams to owning solutions that drive operational excellence. His conscientious and proactive approach is unwavering, whether he is working independently or collaboratively within a team. His ability to connect with colleagues on a personal level underscores his commitment to fostering a harmonious and productive workplace environment.
Date: May 29, 2024
Tags: Information Security, ISO/IEC 27001, ISO/IEC 42001, Artificial Intelligence, GDPR
-------------------------------------------------------------------------------
Find out more about ISO training and certification services
Training: ISO/IEC 27001 Information Security Management System - EN | PECB
ISO/IEC 42001 Artificial Intelligence Management System - EN | PECB
General Data Protection Regulation (GDPR) - Training Courses - EN | PECB
Webinars: https://pecb.com/webinars
Article: https://pecb.com/article
-------------------------------------------------------------------------------
For more information about PECB:
Website: https://pecb.com/
LinkedIn: https://www.linkedin.com/company/pecb/
Facebook: https://www.facebook.com/PECBInternational/
Slideshare: http://www.slideshare.net/PECBCERTIFICATION
A review of the growth of the Israel Genealogy Research Association Database Collection for the last 12 months. Our collection is now passed the 3 million mark and still growing. See which archives have contributed the most. See the different types of records we have, and which years have had records added. You can also see what we have for the future.
The simplified electron and muon model, Oscillating Spacetime: The Foundation...RitikBhardwaj56
Discover the Simplified Electron and Muon Model: A New Wave-Based Approach to Understanding Particles delves into a groundbreaking theory that presents electrons and muons as rotating soliton waves within oscillating spacetime. Geared towards students, researchers, and science buffs, this book breaks down complex ideas into simple explanations. It covers topics such as electron waves, temporal dynamics, and the implications of this model on particle physics. With clear illustrations and easy-to-follow explanations, readers will gain a new outlook on the universe's fundamental nature.
हिंदी वर्णमाला पीपीटी, hindi alphabet PPT presentation, hindi varnamala PPT, Hindi Varnamala pdf, हिंदी स्वर, हिंदी व्यंजन, sikhiye hindi varnmala, dr. mulla adam ali, hindi language and literature, hindi alphabet with drawing, hindi alphabet pdf, hindi varnamala for childrens, hindi language, hindi varnamala practice for kids, https://www.drmullaadamali.com
How to Setup Warehouse & Location in Odoo 17 InventoryCeline George
In this slide, we'll explore how to set up warehouses and locations in Odoo 17 Inventory. This will help us manage our stock effectively, track inventory levels, and streamline warehouse operations.
How to Build a Module in Odoo 17 Using the Scaffold MethodCeline George
Odoo provides an option for creating a module by using a single line command. By using this command the user can make a whole structure of a module. It is very easy for a beginner to make a module. There is no need to make each file manually. This slide will show how to create a module using the scaffold method.
How to Manage Your Lost Opportunities in Odoo 17 CRMCeline George
Odoo 17 CRM allows us to track why we lose sales opportunities with "Lost Reasons." This helps analyze our sales process and identify areas for improvement. Here's how to configure lost reasons in Odoo 17 CRM
This presentation includes basic of PCOS their pathology and treatment and also Ayurveda correlation of PCOS and Ayurvedic line of treatment mentioned in classics.
Exploiting Artificial Intelligence for Empowering Researchers and Faculty, In...Dr. Vinod Kumar Kanvaria
Exploiting Artificial Intelligence for Empowering Researchers and Faculty,
International FDP on Fundamentals of Research in Social Sciences
at Integral University, Lucknow, 06.06.2024
By Dr. Vinod Kumar Kanvaria
2. Praxis Business School
A Project report
for
Product Brand Management
On Brand Value Measurement
Submitted to
Prof. Srinivas Govindrajan
In partial fulfilment of the requirements of the course
Post Graduate Program in Business Management
On September 18th ‘2011
By
Nahid Anjum
Diya Mazumder
Abhishek Dujari
Ankit Jain
Ashwin Agarwal
Praxis Business School
Kolkata
(2010-2012)
2
3. Praxis Business School
Contents
1. Executive summary
2. Concept of Brand Valuation
3. Rationale for choosing the method of brand valuation
4. Different methods of brand valuation
a. Book to market
b. Price premia
c. Discounted cash flow
5. Recommendation
6. References
3
4. Praxis Business School
EXECUTIVE SUMMARY
The motive of this project was to calculate the brand value of Sony. We went about doing so by choosing
the three most applicable methods keeping our chosen brand in mind. These three methods were the
Discounted Cash Flow method, the Price Primia method and the Book to Market method.
The Discounted Cash Flow method calculates the brand value by taking into consideration the future
generation of cash flows by the brand. For calculating these discounted cash flows we found out the cost of
equity using the CAPM Model and determined the WACC (weighted average cost of capital) which has
been used as the discounting rate on the estimated future cash flows to arrive at their present value giving
the brand Value of Sony. The brand value of Sony comes to be ¥ 6, 73,46,42,54,034.51
The Price Premia model indicates how much more are consumers willing to pay for a product of a known
brand as compared to a product which is unbranded. This difference between these two values is the brand
value as this willingness to pay a premium is due to the brand name attached to the product. We asked
twenty respondents how much they are willing to pay for Sony and its known competitors and also for an
unbranded product. We then found out the average price that all the respondents were willing to pay for
those brands and unbranded products. We then calculated the premium percentage by subtracting the
average of the price that consumers were willing to pay for an unbranded product from the price for a Sony
product. This difference was divided by the price for a Sony product and multiplied by hundred to arrive at
the percentage figure. The brand value of Sony comes to be ¥38, 05,95,50,86,529.11
In the Book to Market method we calculated the market capitalisation of the brand by multiplying the
number of outstanding shares in the market with the average of the share prices for five years (annually).
We then calculated the book value by adding the reserves and surpluses and equity in the books of the
company and then subtracted it from the market capitalisation. This difference gives us the brand value of
Sony. The brand value of Sony comes to be ¥ 4, 50,43,79,63,600.00
Having calculated the brand value of Sony by three different methods we now had to choose the best
method for Sony. The best method according to us is the Price premia method for reasons such as,
meaningful and limited assumptions for calculating the brand value, usage of proper weights based on
revenue generated by all the brands, segregated and detailed calculation for each brand separately.
Sony is treading a very thin line when it comes to charging a very high premium and justifying the same
despite giving quality products. Therefore it needs to be careful as to stay on the positive side of this
perception of the consumers and since all of its products are highly technologically driven it is exposed to a
very high risk of obsolescence. To counter this risk it either needs to keep innovating and improving its
existing products or keep coming up with something new. It can do so by allocating a high budget to the
research and development team of the company.
4
5. Praxis Business School
Brand Valuation
What is a brand?
A brand is a name, term, design, symbol, or any other feature that identifies a seller’s good or
service as distinct from those of other sellers. A brand may identify one item, a family of
items, or all items of that seller. A brand can take many forms, including
a name, sign, symbol, colour combination or slogan. Brand is the personality that identifies a
product, service or company. Brand recognition and other reactions are created by the
accumulation of experiences with the specific product or service, both directly relating to its
use, and through the influence of advertising, design, and media commentary. Brand is the
proprietary visual, emotional, rational, and cultural image that one associates with a company
or a product. It is the future generator of cash flow.
Brand Valuation
Brand valuation is the process used to calculate the value of brands. Historically, most of a
company’s value was in tangible assets such as property, stock, machinery or land. This has
now changed and the majority of most company’s value is in intangible assets, such as their
brand name or names.
The value of brand has been recognised for over a hundred years. John Stuart, Chairman of
Quaker said in about 1900, "If this business were split up, I would give you the land and
bricks and mortar, and I would take the brands and trade marks, and I would fair better than
you." However, techniques to quantify brand value have become more sophisticated with the
advent of computerised software such as Excel in the mid 1980s. Brand valuations hit the
financial headlines when they were tabled to defend Rank Hovis McDougall (RHM) from a
hostile takeover from Goodman Fielder Wattie (GFW).
Since 1988, brand valuation methods have improved and consolidated, this was due to their
acceptance in 2005 under International Financial Reporting Standards (IFRS). IFRS stated
that, for the first time brands and other acquired intangible assets could be reported on a
company’s balance sheet. The past 20 years have witnessed a dramatic shift in the sources of
value creation from tangible assets (such as property, plant, equipment and inventory) to
intangible assets (such as skilled employees, patents, business systems and brands). This is
reflected in the growing divergence between the net asset value of companies and their market
capitalisation.
There are a number of recognised methods for valuing trademarks or brands as defined here.
We can look at historic costs – what did it cost to create? In the case of a brand one can look
at what it costs to design, register, and promote the trademarks and associated rights.
Alternatively, one can address what they might cost to replace. Both the historic cost method
and the replacement cost method are subjective but we are often asked to value this way
5
6. Praxis Business School
because courts may want to know what a brand might cost to create. It is also possible to
consider market value, though frequently there is no market value for intangibles, particularly
trademarks and brands. First there is the price premium or gross margin approach that
considers price premiums or superior margins versus a generic business as the metric for
quantifying the value that the brand contributes. However, the rise of private label means that
it is often hard to identify a generic against which the price or margin differential should be
measured.
Ten years ago Interbrand conducted the first ever brand valuation for Rank Hovis McDougal.
This exercise succeeded in putting the worth of the company's brands as a figure on the
balance sheet. RHM's management wanted this information to fight a hostile takeover bid.
With the brand value information, the RHM board was able to go back to investors and argue
that the bid was too low, and eventually repel it.
Brands are valued for many different reasons, such as for legal disputes, strategic
management, internal communications, business management, brand securitisation and M&A.
Brand valuation models follow standard guidelines. Models for valuing brands follow the
same principles of valuation that are used for valuing other tangible assets – economic income
approach, market approach and cost approach.
The term brand value can often confuse. Brand value in some contexts can mean the financial
value of a brand – its actual value. In other circumstances brand value means one of the
intangible measures that contribute to the brand’s financial value. Such brand value attributes
can include brand awareness, familiarity, relevance, heritage or understanding. These brand
values all contribute towards the financial value of the brand.
An important part of valuing brands is identifying what these values are that drive the brand’s
financial value. One could collate an exhaustive list of values but the shorter the list of brand
values the easier it is to monitor and manage. The second step when using these brand values
to value brands is to calculate how important each one is for the particular brand. For instance,
whilst awareness is clearly an important brand value measure, without consumer
understanding of what your brand stands for it is wasted. Market research is carried out within
defined market segments to determine what brand values are most important to the brand’s
customers.
Why are brands valued?
There are many reasons to put brand in a balance sheet. The advantage of brand valuation is
that it is extremely comprehensive and uses proven statistical techniques to reach its
conclusions. Some other main advantages are mentioned here:
The inclusion of brand value in balance sheet gives a better picture of the company as
having good assets and good brand value.
At the same time apparent return on assets (without inclusion of brands) will be brought
down to more realistic figures.
6
7. Praxis Business School
In many of the takeovers, goodwill element in the price of the net assets has been
increasing. Sometimes the price paid for goodwill is greater than the acquiring
company’s net worth with the result that the consolidated accounts show negative
shareholders equity. This looks preposterous. Some of the companies have reassessed the
assets acquired in take overs and reclassified the goodwill as brands.
Company’s brand management will certainly be sharpened up (e.g. brand P&L accounts)
The Company’s debt equity ratio is improved i.e. it reduces the gearing ratio and so
increases the Company’s borrowing capacity.
It particularly helps service sector companies where there are low assets levels, but
strong cash flow and customer bases.
The company is more expensive to acquire which may deter hostile bids.
The asset value does not come down as long as it is maintained by proper promotional
and advertising efforts. There is no depreciation and thus no impact on P&L.
The goodwill arising from an acquisition can be reduced.
Recognising the value of brands separately at the time of acquisition reduces the amount
of goodwill that must be written off either directly to reserves or by amortisation over a
number of years. Immediate write off has detrimental effect on consolidated reserves and
confuses the real value of acquisition of the business whereas amortisation has a
continuous adverse and unrealistic effect on future profits.
It helps better comparison between companies operating in similar markets, or between
companies with varying mixes of acquired and home grown brands.
Many creditors have found in an insolvency situation that some current assets such as
inventory are relatively worthless even though classified as current asset. Also, we
cannot recover goodwill but brands can be transferred and can be converted into cash.
For the businessmen brands are often the most important competitive advantage. It is the
success or failure of brands that so often determines the manager’s success or failure.
This concept will be translated into reality if brands are included in the balance sheet.
Methods used to measure brand value
The different methods used to measure the brand value are as follows-
1. Price premia model
In the price premia method, the ability of a brand to charge a premium over an unbranded or
generic equivalent can be tracked. The major advantage of this approach is that it is
transparent and easy to understand. It is possible to determine the market share for a given
product at a given price level. The relationship between brand equity and price is easily
explained. For a brand, the model gives the percentage of premium it can charge its consumers
over the generic substitutes. The brands can even compare their value of the brand vis-à-vis
competition.
7
8. Praxis Business School
2. Book to market model
Book to market model embraces the intangible asset that the company possesses as Brand
Value, is calculated by deducting Market Value of company with the Book Value. In this
method the book value of the company is deducted from its market capitalisation, to arrive at
the value of the intangible asset, i.e. the brand.
For most of the century, tangible assets were regarded as the main source of business value.
These included manufacturing assets, land and buildings or financial assets such as
receivables and investments. They would be valued at cost or outstanding value as shown in
the balance sheet. Categories of Intangible asset that support the superior market performance
of business are-
Knowledge Intangibles: For example patents, software, recipes, specific know how,
including manufacturing and operating guides and manuals, product research etc.
Business Process Intangibles: These include unique ways of organizing the business
including business models, technology, R&D, patents, flexible manufacturing
techniques etc.
Brand and Relationship intangibles: These includes trade names, trademarks and
trade symbols, domain name, design rights, logotypes, associated Goodwill general
predisposition of individuals to do business with brands are included.
Market position intangibles: For example, retail listings and contracts, distribution
rights, licenses such as landing slots, production or import quotas, third generation
telecom licenses, government permits and authorizations and raw materials sourcing
contracts.
3. Discounted cash flow method
In this method, the cash flows are estimated and discounted to come at the Present Value of
the firm. The discounted cash flow (or DCF) approach describes a method of valuing a
project, company, or asset using the concepts of the time value of money. All future cash
flows are estimated and discounted to give them a present value. Discounted cash flow
method helps us at arriving at the present value of the future cash flows. From the DCF
method we have tried to arrive at the present value of Sony and from the present value of the
company we will attribute a share to brand value, which will be the earnings from the brand
value and derive the brand value of Sony.
Rationale for choosing the above methods:
1. Book to market
The reason for choosing this method is that Sony is company which has been into existence for a
long period now. The market is well aware of its policies, strategies and the overall trend that the
company’s growth history has shown. Therefore, the market has got Sony figured out very well and
therefore, it will value Sony very close to what its true or correct value should be.
8
9. Praxis Business School
2. Price Premia
The reason for choosing this method originated from the previous two phases of the project. It was
seen that Sony is known to charge a high premium for its products and is justified by doing so by
giving an equally quality product. Therefore, we could not ignore this factor and decided to use this
method.
3. Discounted Cash Flow
The reason for choosing this method is it takes into account the cash flows which will be generated
in the future and it was extremely important to calculate Sony’s brand value using this method as it
is a technology driven brand and therefore is exposed to a high risk of obsolescence. This means its
duration of cash flows from a particular brand/product category is likely to be shorter. We have
factored in this particular point.
9
11. Praxis Business School
Book to Market:
METHODOLOGY
To find out the Brand Value of Sony as per Book to Market Method, we calculated the BOOK VALUE and
the MARKET CAPITALIZATION of the company. Book Value was found out by adding up the Reserves
& Surplus to the Equity Capital of Sony for the year 2010-11.
Book Value = Equity + Reserves & Surplus
Thereafter, we calculated the Market Capitalization of Sony by multiplying the Total Number of Shares
Issued to the average share price of Sony over the last year.
Market Capitalization = Number of Shares Issued * Average Share Price
The Calculation is done in Excel in the Book Value sheet.
Brand Value of SONY is ¥ 4, 50,43,79,63,600.00
11
13. Praxis Business School
Price Premia Model
In the price premium method, the ability of a brand to charge a premium over an unbranded or generic
equivalent can be tracked. Transparency and easy to comprehend are some of the main advantages of this
method. It is possible to determine the market share for a given product at a given price level. The
relationship between brand equity and price is easily explained. For a brand, the model gives the
percentage of premium it can charge its consumers over generic substitutes. The brands can even compare
their value of the brand vis-à-vis competition.
Limitations of Price Premia Model
The disadvantages are where a branded product does not command a price premium; the benefit arises on
the cost and market share dimensions. The model may bear little evidence to economic reality or serve
other useful purpose. This method is flawed because there are generic equivalents to which the premium
price of a branded product can be compared. The price difference between a brand and competing products
can be an indicator of its strength, but it does not represent the only and most important value contribution
a brand makes to the underlying business.
Objective:
To measure the brand value of Sony using Price premia model.
Methodology:
A sample size of 20 was taken for evaluation. The respondents were asked to state the price which they are
willing to pay for an unbranded LCD, Digital camera, Music system and laptop. Thereafter, they were
asked to quote an amount which they are willing to pay for an LCD, digital camera, music system and
laptop if a brand name is attached to it. The brands we chose as competitors of Sony are Samsung, Philips,
and LG for the category of LCD and Music system. We chose Nikon and Canon as competitors of Sony in
the category of digital cameras and HP, Dell and Acer in the category of laptops. The difference between
the amount which a consumer is willing to pay for a branded product and an unbranded product is the price
premium which a brand commands.
The weightages assigned to each product category was based on the revenue generated by them whose
source was the company website. The site showed a break up of all the product categories Sony was into
but we have ignored a few of them and then raised the ones we wanted to a sum total of hundred by
proportionately increasing their percentage figures.
13
14. Praxis Business School
Findings-
LCD Unbranded Samsung LG Philips Sony
Average Price 15 25.12 23.41 22.225 30.995
Premium (%) 67.47% 56.07% 48.17% 106.63%
No of buyer 0 7 3 2 15
Music System Unbranded Sony Philips LG Samsung
Average Price 5.9 18.675 14.65 13.265 14.525
Premium (%) 216.53% 148.31% 124.83% 146.19%
No of buyer 0 12 6 3 1
Camera Unbranded Sony Nikon Canon Samsung
Average Price 2.855 11.505 10.24 10.875 7.84
Premium (%) 302.98% 258.67% 280.91% 174.61%
No of buyer 0 7 9 6 3
Laptop Unbranded Vaio HP Dell Acer
Average Price 14.375 36.145 33.6 37.17 27.095
Premium (%) 151.44% 133.74% 158.57% 88.49%
No of buyer 0 5 4 14 3
Data Analysis and interpretation-
LCD- Sony’s range of LCD television is a strong player in the market for LCDs. Out of the 20 respondents,
15 were willing to buy Sony LCD TV. Samsung comes second to Sony with 7 respondents who were
willing to buy a Samsung LCD. The average price a consumer is willing to pay for an unbranded LCD is
Rs 15,000. Sony charges a premium of 106.63% over an unbranded LCD. Hence, it can be inferred that
most of the consumers are willing to buy a Sony LCD and pay a premium for it too.
Music system- Sony is a strong player even in the category of Music systems. Out of 20 respondents, 12
are willing to buy music system by Sony. Next to Sony comes Philips. 6 respondents were willing to buy
the Philips music system. A consumer is willing to pay an average price of Rs5, 900 for an unbranded
music system. Sony charges a premium of 216.53% over an unbranded music system. There is a close fight
between Philips (148.31%) and Samsung (146.19%) when it comes to charging a premium. Although, only
1 out of 20 consumers would purchase a Samsung music system, consumers have a good perception about
the brand and hence the premium.
14
15. Praxis Business School
Digital camera- Sony is leading in the category of digital cameras when it comes to charging a premium.
But when it comes to purchasing a digital camera, 9 out of 20 respondents said they are willing to buy a
Nikon digital camera. Here again there is a close call between Nikon and Canon when it comes to charging
a premium. Canon is charging a premium of 280.91% over an unbranded digital camera but only 6 out of
20 consumers are willing to buy it. Hence, it is perception about the brand that allows it to charge a
premium. Sony because of its brand name charges the highest premium of 302.98% over an unbranded
digital camera.
Laptops- In the category of laptops, Dell stole the thunder with 14 out of 20 respondents willing to buy a
Dell laptop and even pay a premium of 158.57% over an unbranded laptop. Vaio comes second to Dell
laptops. Hence, when it comes to laptop it is Dell which has captured the market and consumers are even
willing to pay a premium to purchase a Dell laptop.
Brand value of SONY is ¥38, 05,95,50,86,529.11
15
17. Praxis Business School
Discounted Cash flow Valuation Method
Crucial Assumption and Explanation
Sales Growth
We have taken last three years Free Cash flows of Sony from the statement of Cash flows of Sony
Annual report. Then we determined the percentage change in the cash flows for the last three year.
For the sales growth rate we have then taken the average of the percentage change in the cash flows
which was 45.86%. Since other factors like Inflation rates and various other rates will influence this
average growth rate we have assumed a growth rate which is lower then the calculated average
growth rate that is 30% for the estimated 5 years(since SONY is a technology driven brand the risk
of obsolescence is high as compared to other brands such as FMCG etc. therefore the flow of cash
flow generating from a particular product has been kept shorter i.e. 5 years instead of a perpetuity)
and hence calculated the free cash flows for the next 5 years.
Discount factor is 1/(1+WACC)
Derivation of WACC
Cost of Equity (Re)
Re= Rm + beta (Rm-Rf)
Where,
Re=Cost of Capita
Rm= Expected marker return
Rf= Risk Free Return
Beta= Sensitivity of stock to market changes
For the Risk free rate we have taken the US government bond rate.
Cost of debt
Cost of debt= Interest paid/ Average debt
WACC is calculated by multiplying the cost of each capital component by its proportional weight
and then summing. For this we have taken Tax rate as 30%. The WACC for the present year comes
to 17.37% which is the represents the discounting rate of the DCF.
Terminal value is :{ FCF (1+G)/ (WACC-G)}*discount factor.
In the end we do: Discount DCF+Terminal Value
Finally, we derive the present value of the company.
The Brand Value of SONY is calculated in the Excel sheet in the DCF sheet and the WACC calculation is in WACC sheet.
Brand Value of Sony is ¥ 6, 73,46,42,54,034.51
17
18. Praxis Business School
RECOMMENDATION
Having calculated the brand Value of Sony by three completely different methods we got varied
values of the brand. We then had to decide which method was the one that had gotten the closest to
depicting the true value of the chosen brand.
The Discounted Cash Flow method and the Market to Book Value method threw up rather similar
values of the brand Sony whereas the Price Primia method’s value was huge as compared to the
other two methods.
Despite the brand value calculated through the Price Premia method being so different we would go
ahead and say that this is the best method amongst the three. The reasons for this are:
Minimum number of assumptions as compared to the other two methods
Detailed calculations by segregating each product category and assigning appropriate
weightages to the same
The method uses the matrix of premium which at the end of the day is perhaps the most
important matrix for a brand as a brand is nothing but an ability to charge premium.
The brand Sony has a very high brand value which is nothing but a reflection of most of the things that it
has got right. It is the market leader in most of the product categories it is present in. It is perceived to be
offering cutting edge technology products which are of high quality and expensive. Sony is treading a tight
rope here and has to watch out from overdoing it here giving the customers the feeling that despite the high
quality of the products they r still being overcharged comparatively.
Since all Sony’s products are technology driven they are exposed to high risk of obsolescence and therefore
need to ensure continuous innovation either within the particular products or keep coming out with new
ones replacing the obsolete ones. This can be ensured by setting aside a bigger budget for the research and
development department.
18
19. Praxis Business School
Reference
http://www.sony.net/SonyInfo/IR/financial/ar/2011/
http://www.bloomberg.com/markets/rates-bonds/government-bonds/us/
19