![Some sources
Peter Good, et al., An updated review of developments in climate
science research since the IPCC Fourth Assessment Report. [An
extended (177 page) analysis by British Met Office and affiliated
analysts, up to date to November, 2010.]
Kelly Levin and D. Tirpak, Climate Science 2008 - Major New
Discoveries. World Resource Institute “Issue Brief”, 28 pp, July,
2009.
R. vanDorland et al.,News in Climate Science since IPCC 2007:
Topics of interest in the scientific basis of climate change, KNMI,
de Bilt, November, 2009.](https://image.slidesharecdn.com/1merrillmay5climatechangesymposium-110711094410-phpapp02/85/Some-Developments-in-Climate-Science-Since-IPCC-AR4-Prepared-for-the-Climate-Change-Science-Symposium-11-320.jpg)

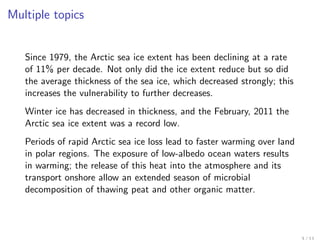
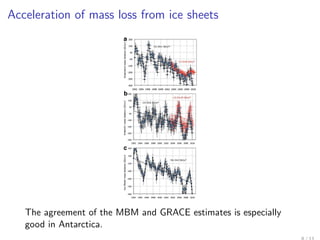
The document discusses recent developments in climate science since the IPCC AR4, highlighting significant declines in Arctic sea ice extent and thickness, as well as observed warming trends in Antarctica. It reports on the acceleration of mass loss from ice sheets, with projected contributions to sea level rise outpacing other factors. The findings indicate that ice sheet loss could become the dominant source of sea level rise in the coming century if current trends continue.


