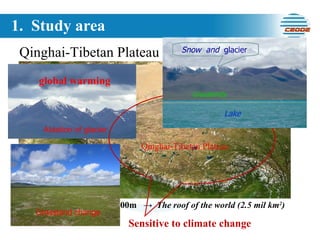
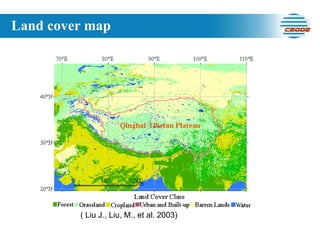
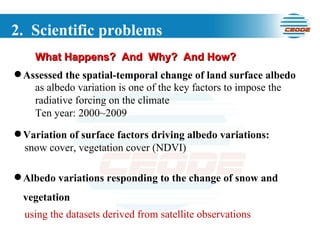
1. The document analyzes changes in land surface albedo over the Qinghai-Tibetan Plateau from 2000 to 2009 using satellite data on albedo, snow cover, and vegetation indices.
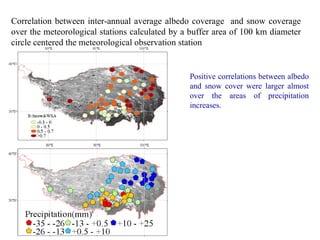
2. Results show albedo is strongly correlated with snow cover, with higher albedo corresponding to more frequent snow cover. Summer albedo is correlated with vegetation indices.
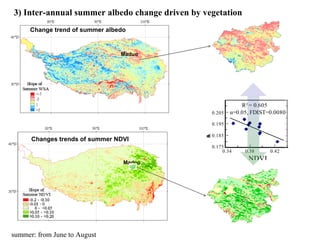
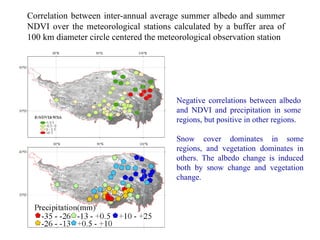
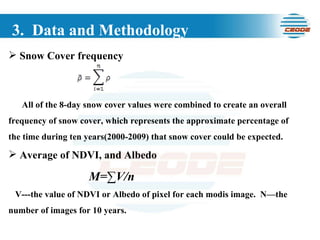
3. Interannual trends found albedo changes were driven by changes in snow cover and vegetation in different regions of the plateau, with snow cover dominating in some areas and vegetation in others.


![3. Data and Methodology Inter-annal Trends of Albedo or NDVI (2000-2009) j: for values of different MODIS data within a year; j: certain year, such as 2000, 2001 V---the value of NDVI or Albedo of pixel for each modis image Correlation coefficients COV(X, Y ) =E([X-E(X)][Y-E(Y)])](https://image.slidesharecdn.com/igarssoral-zhang-july-110727141520-phpapp02/85/IGARSSoral_Zhang_July-ppt-8-320.jpg)