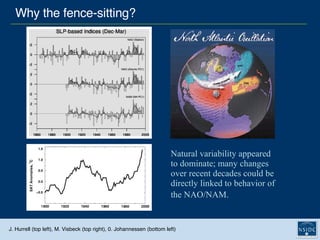
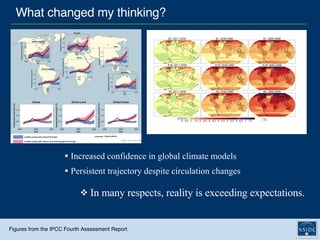
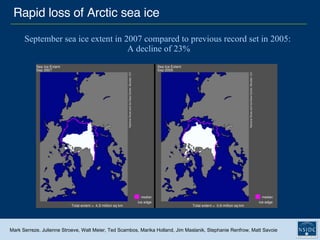
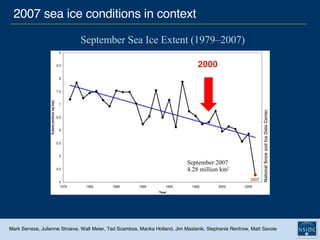
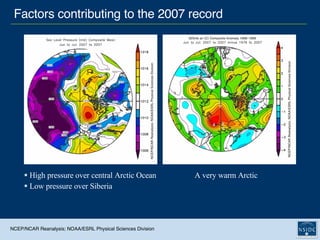
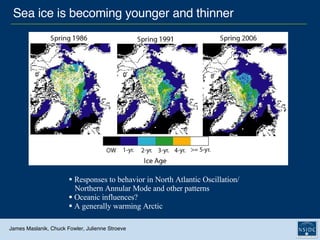
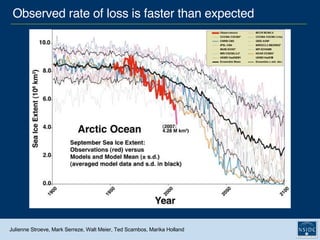
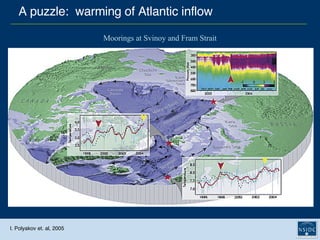
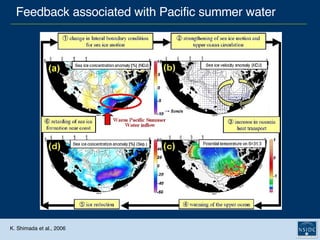
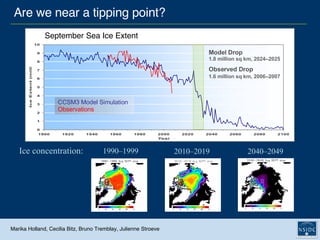
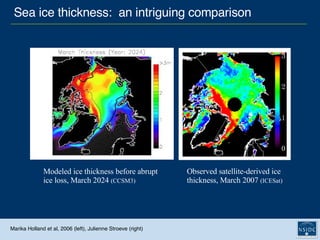
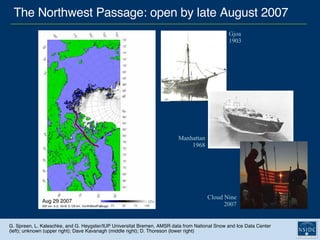
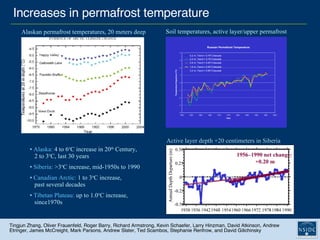
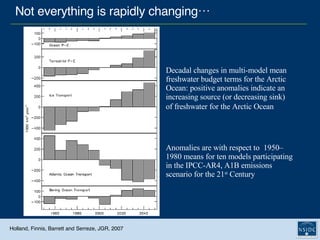
Arctic Climate Change:  Where Reality Exceeds Expectations Mark C. Serreze National Snow and Ice Data Center (NSIDC) Cooperative Institute for Research in Environmental Sciences  at the University of Colorado at Boulder With thanks to the entire community.
Serreze et al., 2000:  Observational evidence of recent  change in the Northern high-latitude environment,  Climatic Change , 46,  159-207. “ Taken together, these results paint  a reasonably coherent picture of change,  but their interpretation as signals of enhanced  greenhouse warming is open to debate.” Seven years ago…
Why the fence-sitting? Natural variability appeared to dominate; many changes  over recent decades could be  directly linked to behavior of  the NAO/NAM.   J. Hurrell (top left), M. Visbeck (top right), 0. Johannessen (bottom left)
What changed my thinking? Increased confidence in global climate models In many respects, reality is exceeding expectations. Figures from the IPCC Fourth Assessment Report Persistent trajectory despite circulation changes
Rapid loss of Arctic sea ice September sea ice extent in 2007 compared to previous record set in 2005:  A decline of 23% Mark Serreze, Julienne Stroeve, Walt Meier, Ted Scambos, Marika Holland, Jim Maslanik, Stephanie Renfrow, Matt Savoie
2007 sea ice conditions in context Mark Serreze, Julienne Stroeve, Walt Meier, Ted Scambos, Marika Holland, Jim Maslanik, Stephanie Renfrow, Matt Savoie September Sea Ice Extent (1979–2007) September 2007 4.28 million km 2 2000
Some useful comparisons Donald Perovich, Cold Regions Research & Engineering Laboratory
Factors contributing to the 2007 record A very warm Arctic High pressure over central Arctic Ocean Low pressure over Siberia NCEP/NCAR Reanalysis; NOAA/ESRL Physical Sciences Division
Sea ice is becoming younger and thinner James Maslanik, Chuck Fowler, Julienne Stroeve Responses to behavior in North Atlantic Oscillation/   Northern Annular Mode and other patterns Oceanic influences? A generally warming Arctic
Observed rate of loss is faster than expected Julienne Stroeve, Mark Serreze, Walt Meier, Ted Scambos, Marika Holland
Moorings at Svinoy and Fram Strait I. Polyakov et. al, 2005 A puzzle:  warming of Atlantic inflow
K. Shimada et al., 2006 Feedback associated with Pacific summer water
Are we near a tipping point? Ice concentration: Marika Holland, Cecilia Bitz, Bruno Tremblay, Julienne Stroeve 1990–1999 2010–2019 2040–2049 CCSM3 Model Simulation Observations Model Drop 1.8 million sq km, 2024–2025 Observed Drop 1.6 million sq km, 2006–2007   September Sea Ice Extent
Sea ice thickness:  an intriguing comparison Modeled ice thickness before abrupt ice loss, March 2024  (CCSM3) Observed   satellite-derived ice thickness, March 2007  (ICESat) Marika Holland et al, 2006 (left), Julienne Stroeve (right)
Declining polar bear habitat George Durner et al., 2007
The Northwest Passage: open by late August 2007 G. Spreen, L. Kaleschke, and G. Heygster/IUP Universitat Bremen, AMSR data from National Snow and Ice Data Center (left); unknown (upper right); Dave Kavanagh (middle right); D. Thoreson (lower right) Manhattan 1968 Gjoa 1903 Cloud Nine 2007
As the sea ice cover  continues to retreat,  the Arctic will become  increasingly accessible,  not just to commercial  shipping, but to oil  extraction.   Mike Keefe, 08/18/2007  Denver Post An accessible Arctic
Model-Projected Arctic Amplification  Mark Serreze, Andy Barrett, Marika Holland Model projection of 2-meter temperature anomalies by month and year for 70–90 degrees North latitude, compared to 1979–1998 means (CCSM3)   Latitude by height dependence of zonally averaged October–March temperature anomalies for  2050–2059, compared to 1979–1998 means (CCSM3)
Arctic Amplification appears to have emerged  Corresponding anomalies in 2-meter temperature  (NCEP/NCAR)   Anomalies  observed sea ice extent by year and month,  relative to 1979-2007 means,  for an Arctic Ocean domain  (SSMR and SSM/I)   Seasonality is as expected Andy Barrett, Mark Serreze, Matt Savoie
The vertical structure also looks correct  Latitude (0 to 90 degrees North) by height (1,000 to 100 hectopascals)  dependence of temperature anomalies, 1995–2007 minus 1979–2007 October November NCEP/NCAR,  Climate Diagnostics Center
Surface melt over Greenland 2007 Melting Day Anomalies Melting Index Time Series Marco Tedesco, City College of New York-CUNY
Melt-induced ice flow and moulins  Konrad Steffen, CIRES at the University of Colorado at Boulder
Cryospheric sea-level rise: glaciers and ice sheets Konrad Steffen, CIRES at the University of Colorado at Boulder
“ Greening” of the Arctic Trends in vegetation synthetic activity from1982–2005  (GIMMS-G AVHRR Vegetation indices) Significant positive trends Significant negative trends   Scott Goetz, Woods Hole
Increases in permafrost temperature Alaska:   4 to 6 o C increase in 20 th  Century,   2 to 3 o C, last 30 years Siberia:   >3 o C increase, mid-1950s to 1990 Canadian Arctic:   1 to 3 o C increase,    past several decades Tibetan Plateau:   up to 1.0 o C increase,    since1970s Alaskan permafrost temperatures, 20 meters deep Soil temperatures, active layer/upper permafrost Active layer depth +20 centimeters in Siberia Tingjun Zhang, Oliver Frauenfeld, Roger Barry, Richard Armstrong, Kevin Schaefer, Larry Hinzman, David Atkinson, Andrew Etringer, James McCreight, Mark Parsons, Andrew Slater, Ted Scambos, Stephanie Renfrow, and David Gilichinsky
Decadal changes in multi-model mean  freshwater budget terms for the Arctic Ocean: positive anomalies indicate an increasing source (or decreasing sink)  of freshwater for the Arctic Ocean   Holland, Finnis, Barrett and Serreze, JGR, 2007 Anomalies are with respect to  1950–1980 means for ten models participating in the IPCC-AR4, A1B emissions scenario for the 21 st  Century Not everything is rapidly changing…
Concluding Comments The future is today. Even our earliest climate models projected that effects of greenhouse    gas loading would be seen first in the Arctic. Even seven years ago,  attribution of observed changes was uncertain. Despite strong imprints of natural variability,  I am now convinced    of a role of greenhouse gas loading. A number of key changes are exceeding expectations from climate  models.  Could we lose the summer sea ice cover by 2030? Much remains to be understood—the idea of “tipping points”    has emerged as a key issue.  Not everything is rapidly changing (hydrologic cycle).

1 Nye Serreze 12062007

  • 1.
    Arctic Climate Change: Where Reality Exceeds Expectations Mark C. Serreze National Snow and Ice Data Center (NSIDC) Cooperative Institute for Research in Environmental Sciences at the University of Colorado at Boulder With thanks to the entire community.
  • 2.
    Serreze et al.,2000: Observational evidence of recent change in the Northern high-latitude environment, Climatic Change , 46, 159-207. “ Taken together, these results paint a reasonably coherent picture of change, but their interpretation as signals of enhanced greenhouse warming is open to debate.” Seven years ago…
  • 3.
    Why the fence-sitting?Natural variability appeared to dominate; many changes over recent decades could be directly linked to behavior of the NAO/NAM. J. Hurrell (top left), M. Visbeck (top right), 0. Johannessen (bottom left)
  • 4.
    What changed mythinking? Increased confidence in global climate models In many respects, reality is exceeding expectations. Figures from the IPCC Fourth Assessment Report Persistent trajectory despite circulation changes
  • 5.
    Rapid loss ofArctic sea ice September sea ice extent in 2007 compared to previous record set in 2005: A decline of 23% Mark Serreze, Julienne Stroeve, Walt Meier, Ted Scambos, Marika Holland, Jim Maslanik, Stephanie Renfrow, Matt Savoie
  • 6.
    2007 sea iceconditions in context Mark Serreze, Julienne Stroeve, Walt Meier, Ted Scambos, Marika Holland, Jim Maslanik, Stephanie Renfrow, Matt Savoie September Sea Ice Extent (1979–2007) September 2007 4.28 million km 2 2000
  • 7.
    Some useful comparisonsDonald Perovich, Cold Regions Research & Engineering Laboratory
  • 8.
    Factors contributing tothe 2007 record A very warm Arctic High pressure over central Arctic Ocean Low pressure over Siberia NCEP/NCAR Reanalysis; NOAA/ESRL Physical Sciences Division
  • 9.
    Sea ice isbecoming younger and thinner James Maslanik, Chuck Fowler, Julienne Stroeve Responses to behavior in North Atlantic Oscillation/ Northern Annular Mode and other patterns Oceanic influences? A generally warming Arctic
  • 10.
    Observed rate ofloss is faster than expected Julienne Stroeve, Mark Serreze, Walt Meier, Ted Scambos, Marika Holland
  • 11.
    Moorings at Svinoyand Fram Strait I. Polyakov et. al, 2005 A puzzle: warming of Atlantic inflow
  • 12.
    K. Shimada etal., 2006 Feedback associated with Pacific summer water
  • 13.
    Are we neara tipping point? Ice concentration: Marika Holland, Cecilia Bitz, Bruno Tremblay, Julienne Stroeve 1990–1999 2010–2019 2040–2049 CCSM3 Model Simulation Observations Model Drop 1.8 million sq km, 2024–2025 Observed Drop 1.6 million sq km, 2006–2007 September Sea Ice Extent
  • 14.
    Sea ice thickness: an intriguing comparison Modeled ice thickness before abrupt ice loss, March 2024 (CCSM3) Observed satellite-derived ice thickness, March 2007 (ICESat) Marika Holland et al, 2006 (left), Julienne Stroeve (right)
  • 15.
    Declining polar bearhabitat George Durner et al., 2007
  • 16.
    The Northwest Passage:open by late August 2007 G. Spreen, L. Kaleschke, and G. Heygster/IUP Universitat Bremen, AMSR data from National Snow and Ice Data Center (left); unknown (upper right); Dave Kavanagh (middle right); D. Thoreson (lower right) Manhattan 1968 Gjoa 1903 Cloud Nine 2007
  • 17.
    As the seaice cover continues to retreat, the Arctic will become increasingly accessible, not just to commercial shipping, but to oil extraction. Mike Keefe, 08/18/2007 Denver Post An accessible Arctic
  • 18.
    Model-Projected Arctic Amplification Mark Serreze, Andy Barrett, Marika Holland Model projection of 2-meter temperature anomalies by month and year for 70–90 degrees North latitude, compared to 1979–1998 means (CCSM3) Latitude by height dependence of zonally averaged October–March temperature anomalies for 2050–2059, compared to 1979–1998 means (CCSM3)
  • 19.
    Arctic Amplification appearsto have emerged Corresponding anomalies in 2-meter temperature (NCEP/NCAR) Anomalies observed sea ice extent by year and month, relative to 1979-2007 means, for an Arctic Ocean domain (SSMR and SSM/I) Seasonality is as expected Andy Barrett, Mark Serreze, Matt Savoie
  • 20.
    The vertical structurealso looks correct Latitude (0 to 90 degrees North) by height (1,000 to 100 hectopascals) dependence of temperature anomalies, 1995–2007 minus 1979–2007 October November NCEP/NCAR, Climate Diagnostics Center
  • 21.
    Surface melt overGreenland 2007 Melting Day Anomalies Melting Index Time Series Marco Tedesco, City College of New York-CUNY
  • 22.
    Melt-induced ice flowand moulins Konrad Steffen, CIRES at the University of Colorado at Boulder
  • 23.
    Cryospheric sea-level rise:glaciers and ice sheets Konrad Steffen, CIRES at the University of Colorado at Boulder
  • 24.
    “ Greening” ofthe Arctic Trends in vegetation synthetic activity from1982–2005 (GIMMS-G AVHRR Vegetation indices) Significant positive trends Significant negative trends Scott Goetz, Woods Hole
  • 25.
    Increases in permafrosttemperature Alaska: 4 to 6 o C increase in 20 th Century, 2 to 3 o C, last 30 years Siberia: >3 o C increase, mid-1950s to 1990 Canadian Arctic: 1 to 3 o C increase, past several decades Tibetan Plateau: up to 1.0 o C increase, since1970s Alaskan permafrost temperatures, 20 meters deep Soil temperatures, active layer/upper permafrost Active layer depth +20 centimeters in Siberia Tingjun Zhang, Oliver Frauenfeld, Roger Barry, Richard Armstrong, Kevin Schaefer, Larry Hinzman, David Atkinson, Andrew Etringer, James McCreight, Mark Parsons, Andrew Slater, Ted Scambos, Stephanie Renfrow, and David Gilichinsky
  • 26.
    Decadal changes inmulti-model mean freshwater budget terms for the Arctic Ocean: positive anomalies indicate an increasing source (or decreasing sink) of freshwater for the Arctic Ocean Holland, Finnis, Barrett and Serreze, JGR, 2007 Anomalies are with respect to 1950–1980 means for ten models participating in the IPCC-AR4, A1B emissions scenario for the 21 st Century Not everything is rapidly changing…
  • 27.
    Concluding Comments Thefuture is today. Even our earliest climate models projected that effects of greenhouse gas loading would be seen first in the Arctic. Even seven years ago, attribution of observed changes was uncertain. Despite strong imprints of natural variability, I am now convinced of a role of greenhouse gas loading. A number of key changes are exceeding expectations from climate models. Could we lose the summer sea ice cover by 2030? Much remains to be understood—the idea of “tipping points” has emerged as a key issue. Not everything is rapidly changing (hydrologic cycle).