Downloaded 20 times

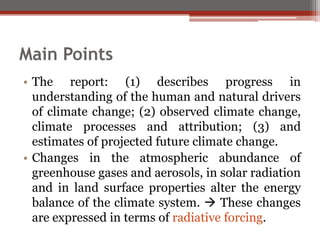
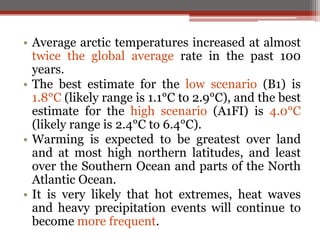
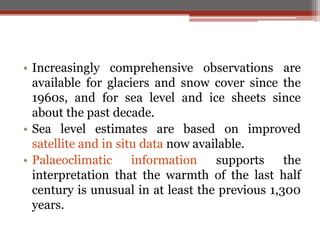
![• Increase in carbon CH4 concentration
agriculture.
• The global atmospheric concentration of CH4 has
increased from a pre-industrial value of about 715
ppb to 1774 ppb in 2005 (exceeding by far the
natural range of the last 650,000 years - 320 to 790
ppb).
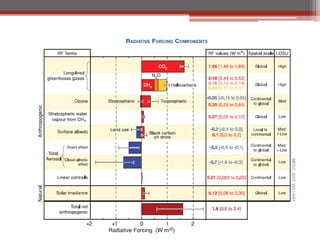
• The combined radiative forcing due to increases in
of CO2, CH4, N2O is +2.30 [+2.07 to +2.53] W m–
2, and its rate of increase during the industrial era is
very likely (90%) to have been unprecedented in
more than 10,000 years.](https://image.slidesharecdn.com/summary-ipcc4thassessment-131001151838-phpapp02/85/Summary-IPCC-4th-assessment-5-320.jpg)
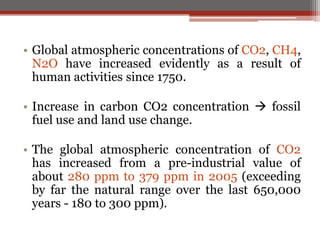
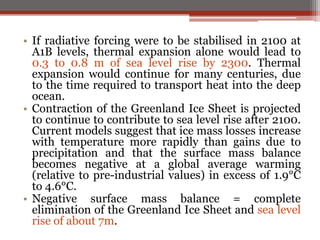
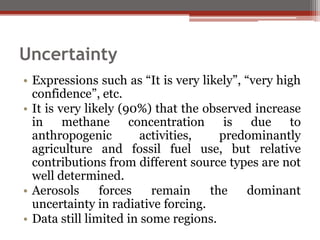
![• Anthropogenic contributions to aerosols
together produce a cooling effect, with a total
direct radiative forcing of –0.5 [–0.9 to –0.1] W
m–2 and an indirect cloud albedo forcing of –
0.7 [–1.8 to –0.3] W m–2.
• Changes in solar irradiance since 1750 are
estimated to cause a radiative forcing of +0.12 W
m–2.
• Eleven of the last twelve years (1995–2006) rank
among the 12 warmest years in the instrumental
record of global surface temperature (since
1850).](https://image.slidesharecdn.com/summary-ipcc4thassessment-131001151838-phpapp02/85/Summary-IPCC-4th-assessment-6-320.jpg)

This document summarizes key findings from the IPCC report on the physical science of climate change. It finds that increases in greenhouse gases like CO2 and methane are extremely likely due to human activity since 1750 and are causing the planet to warm. Global temperatures and sea levels have risen over the past century and models project further increases of 1-6°C and 0.3-0.8 meters respectively by 2100 depending on emissions scenarios. While uncertainty remains, effects like more extreme heat waves are very likely to continue worsening if emissions are not reduced.


![Climate: Past, Present, Future [Prof John McClatchey]](https://cdn.slidesharecdn.com/ss_thumbnails/uhiclimatechangev2johnmcclatchey-100705044157-phpapp01-thumbnail.jpg?width=640&height=640&fit=bounds)