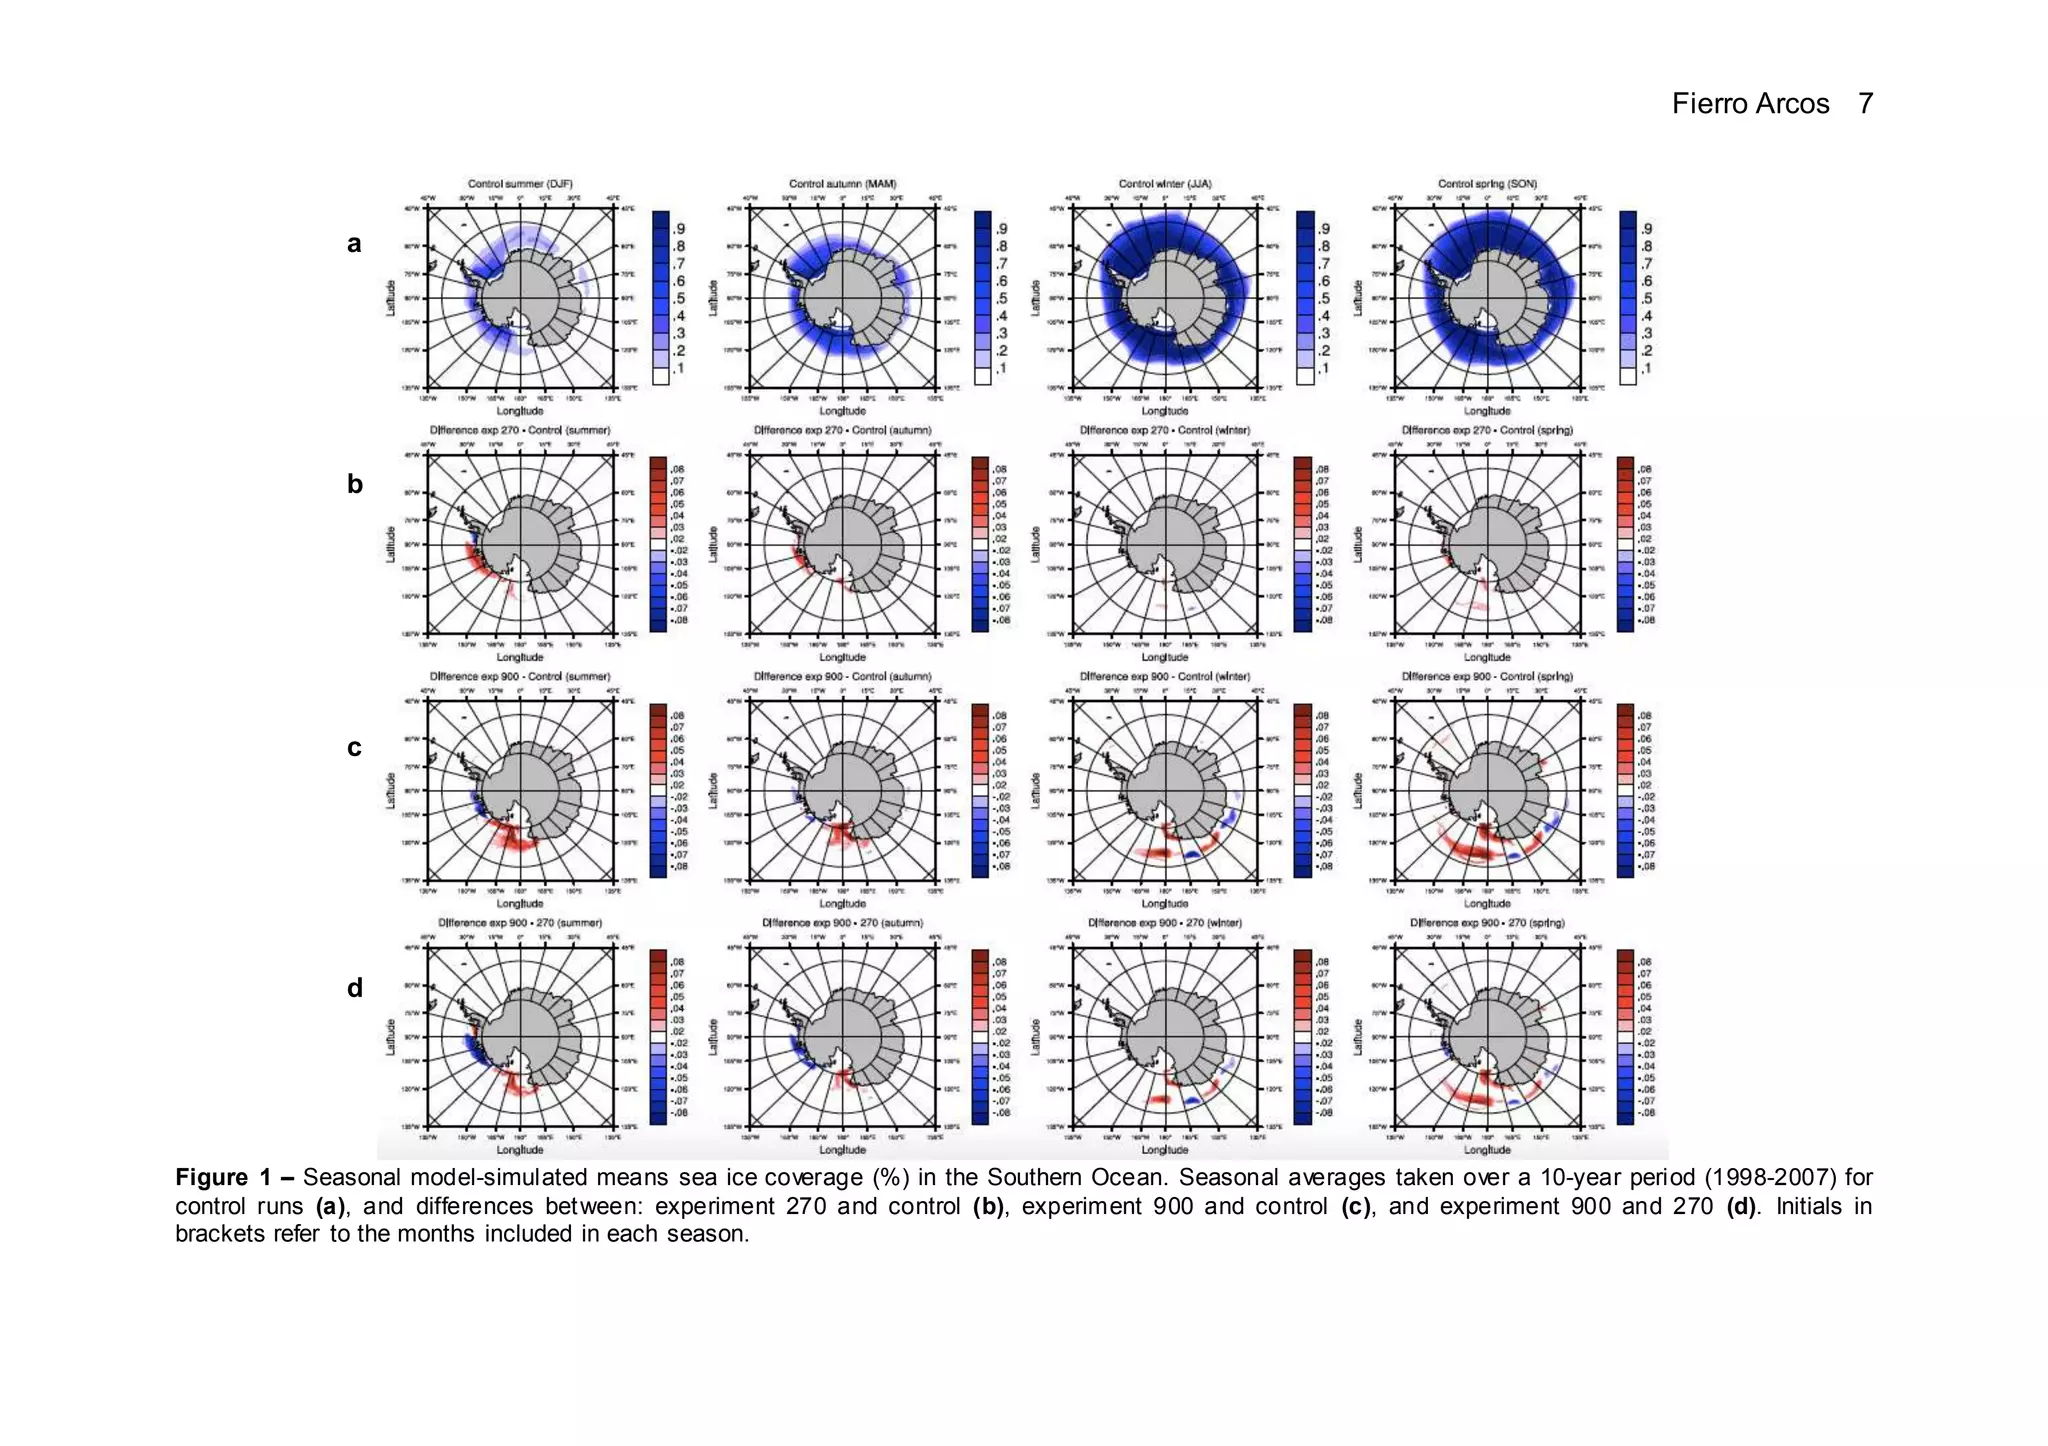
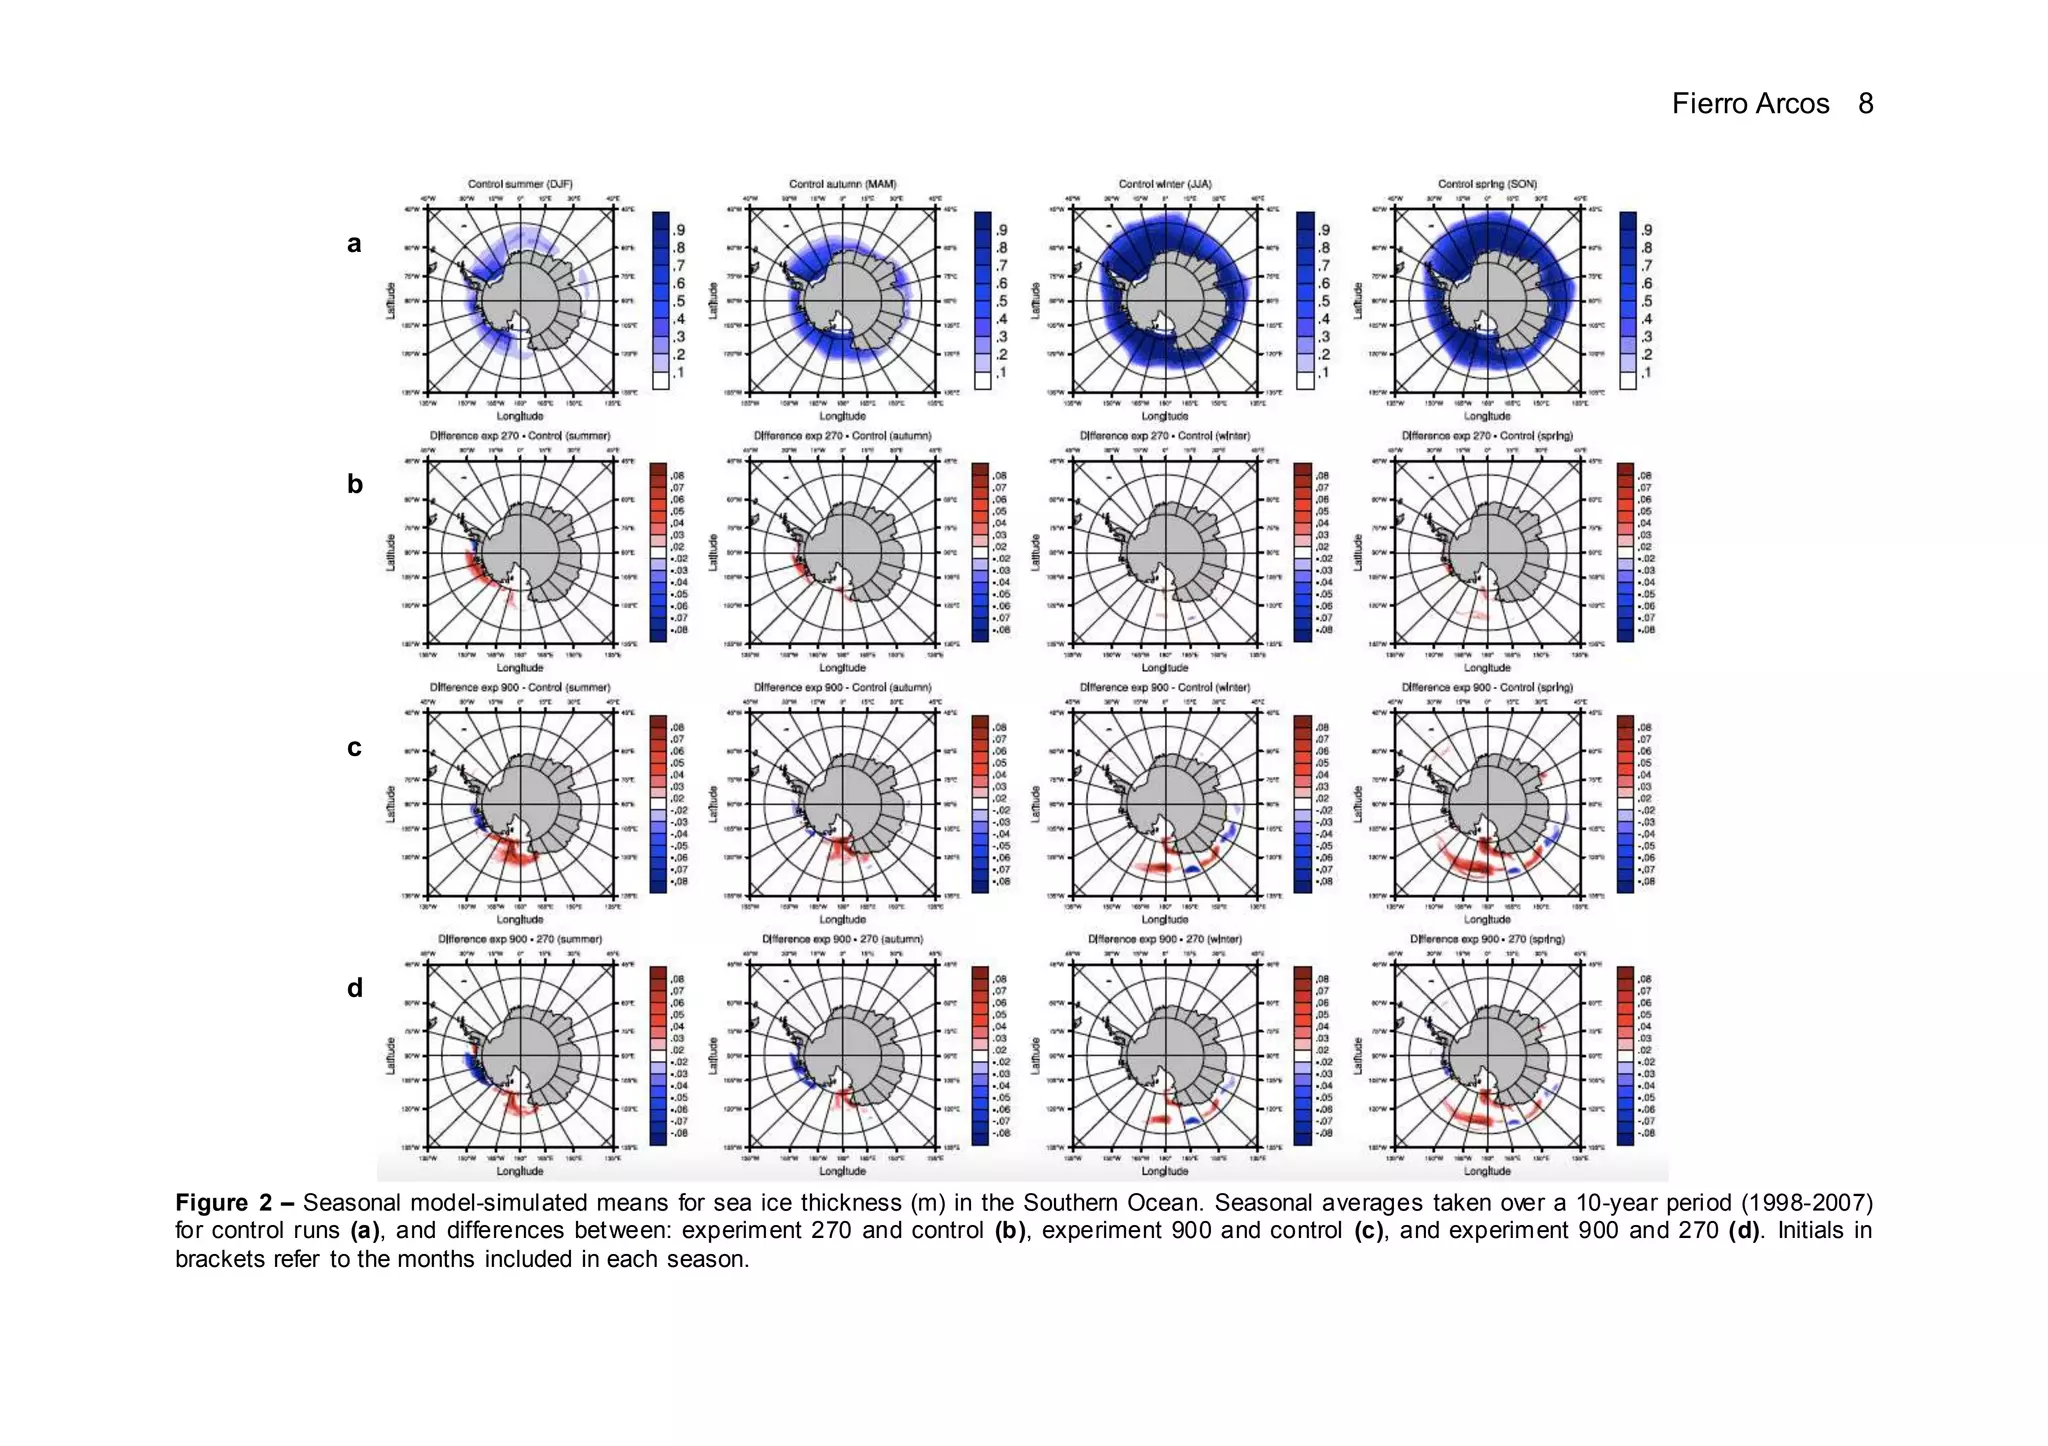
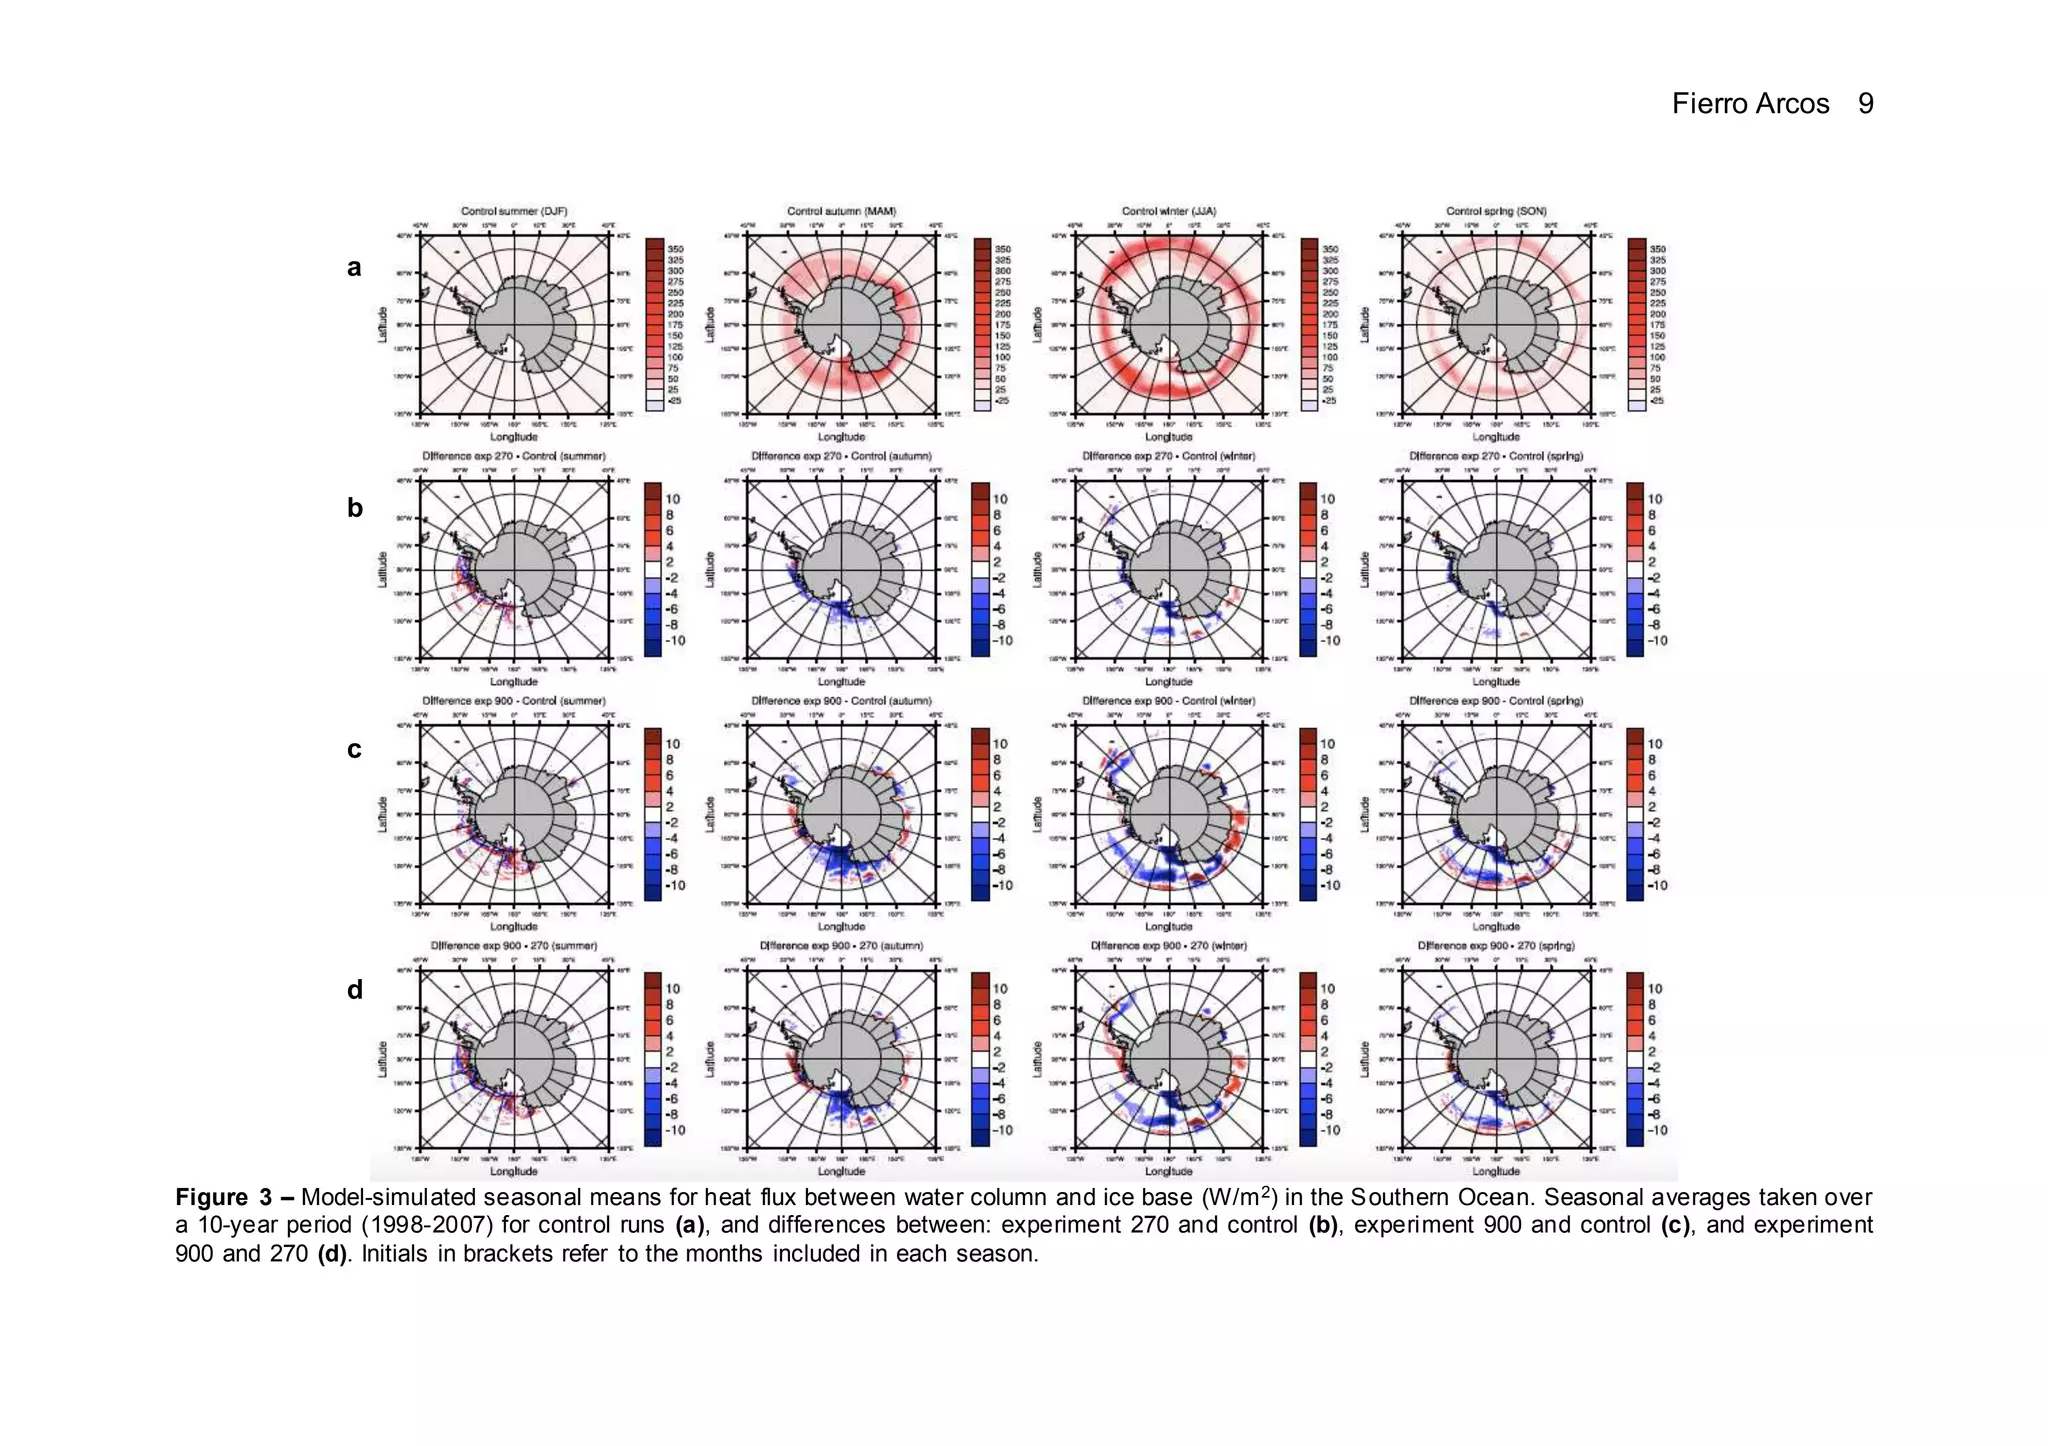
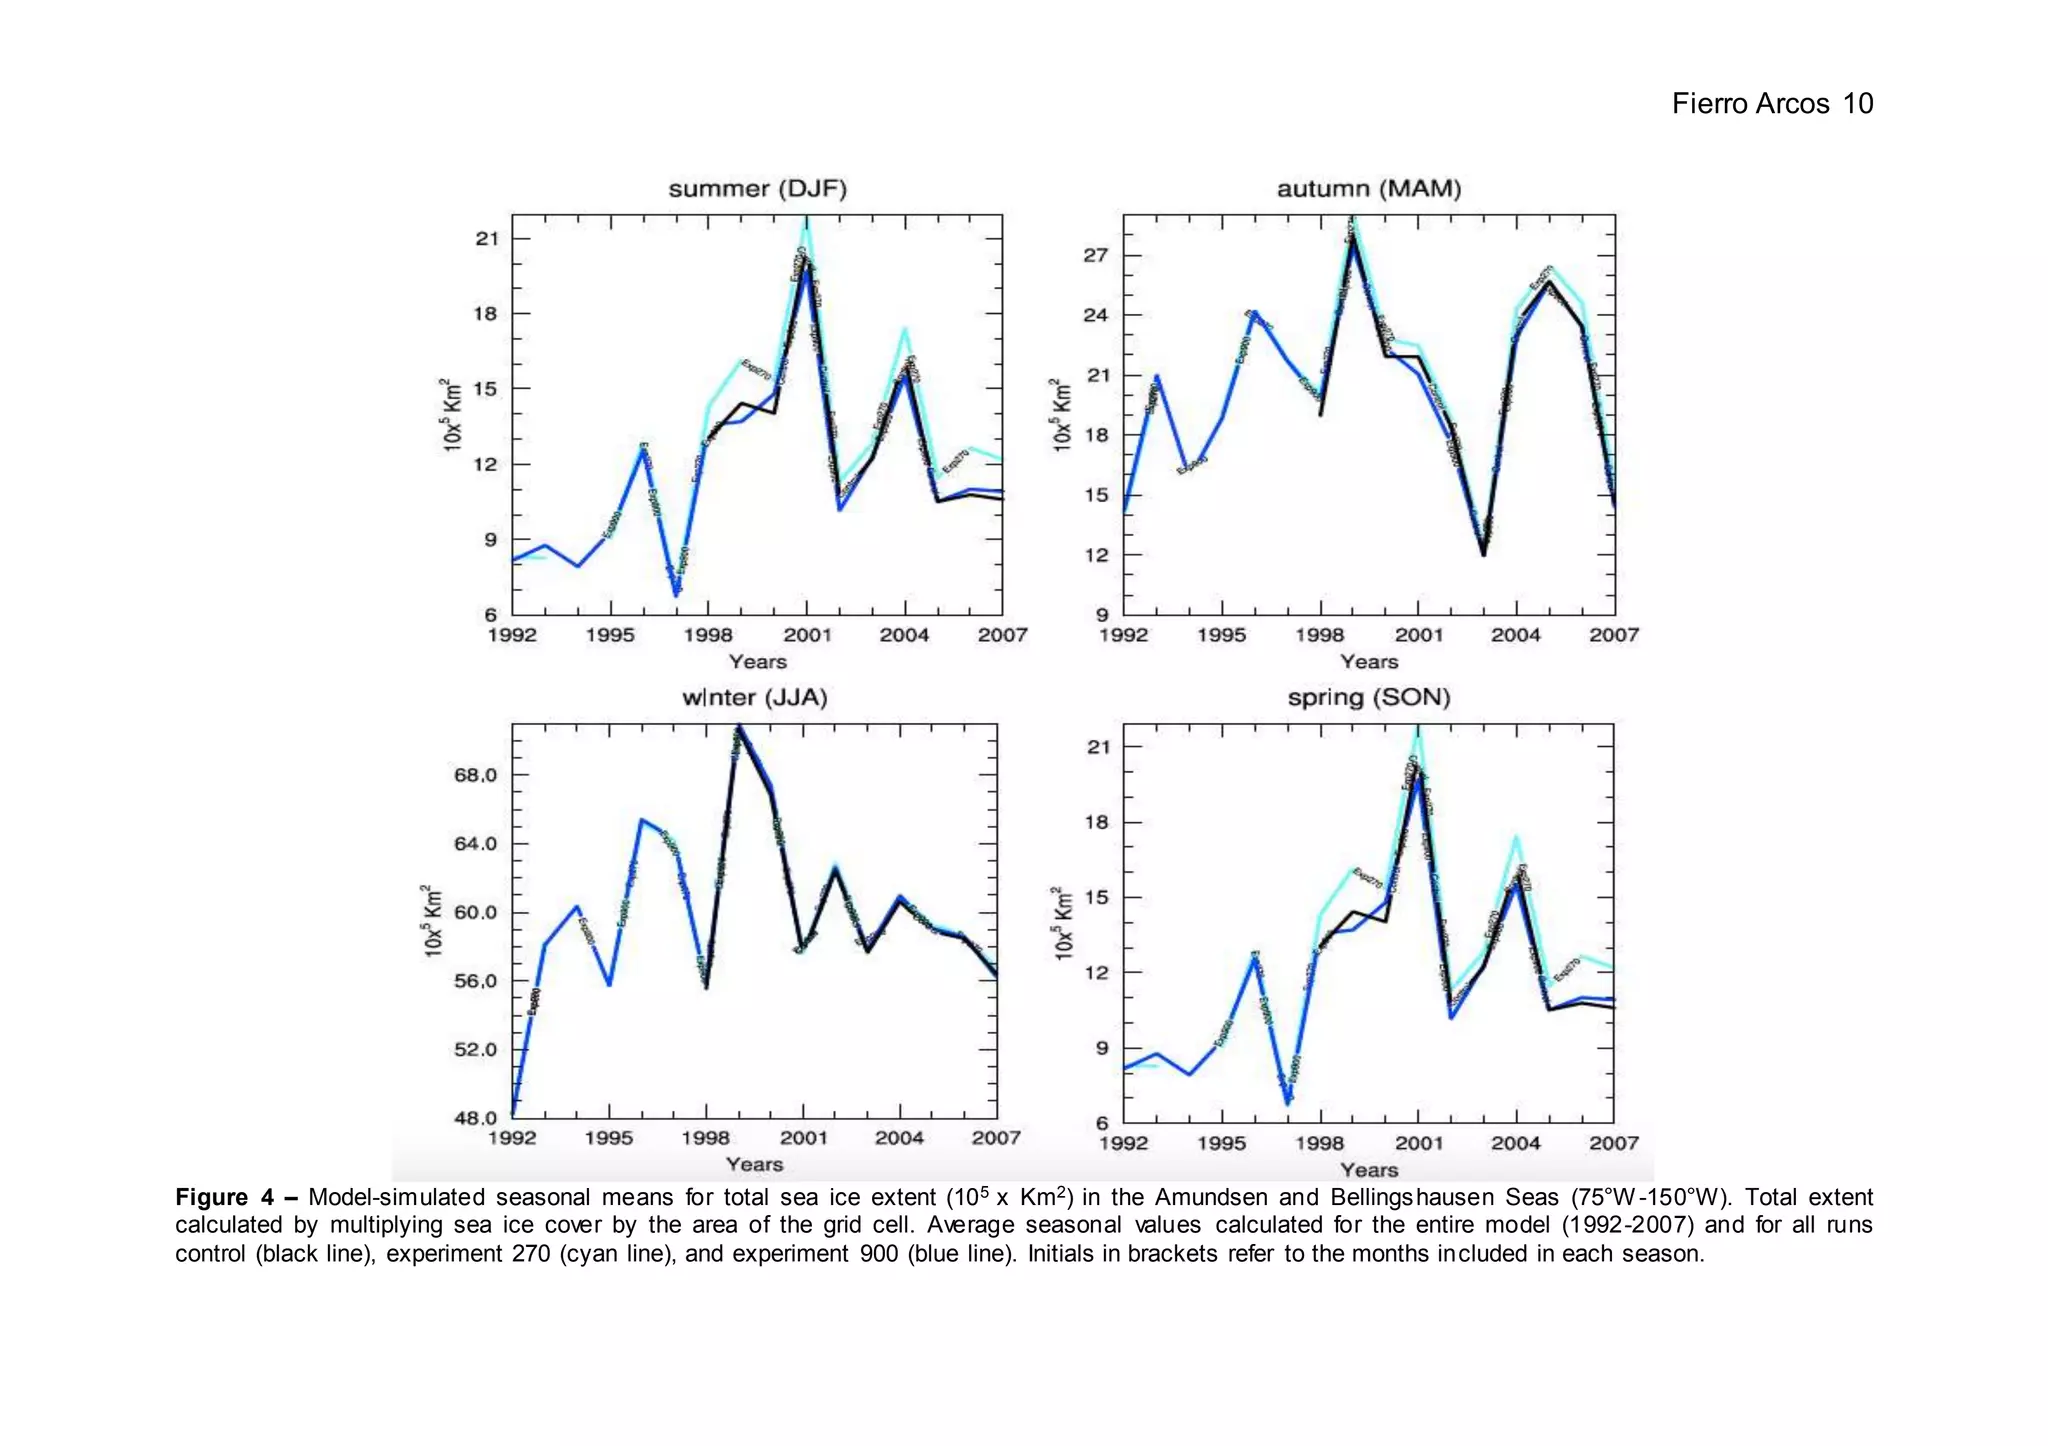
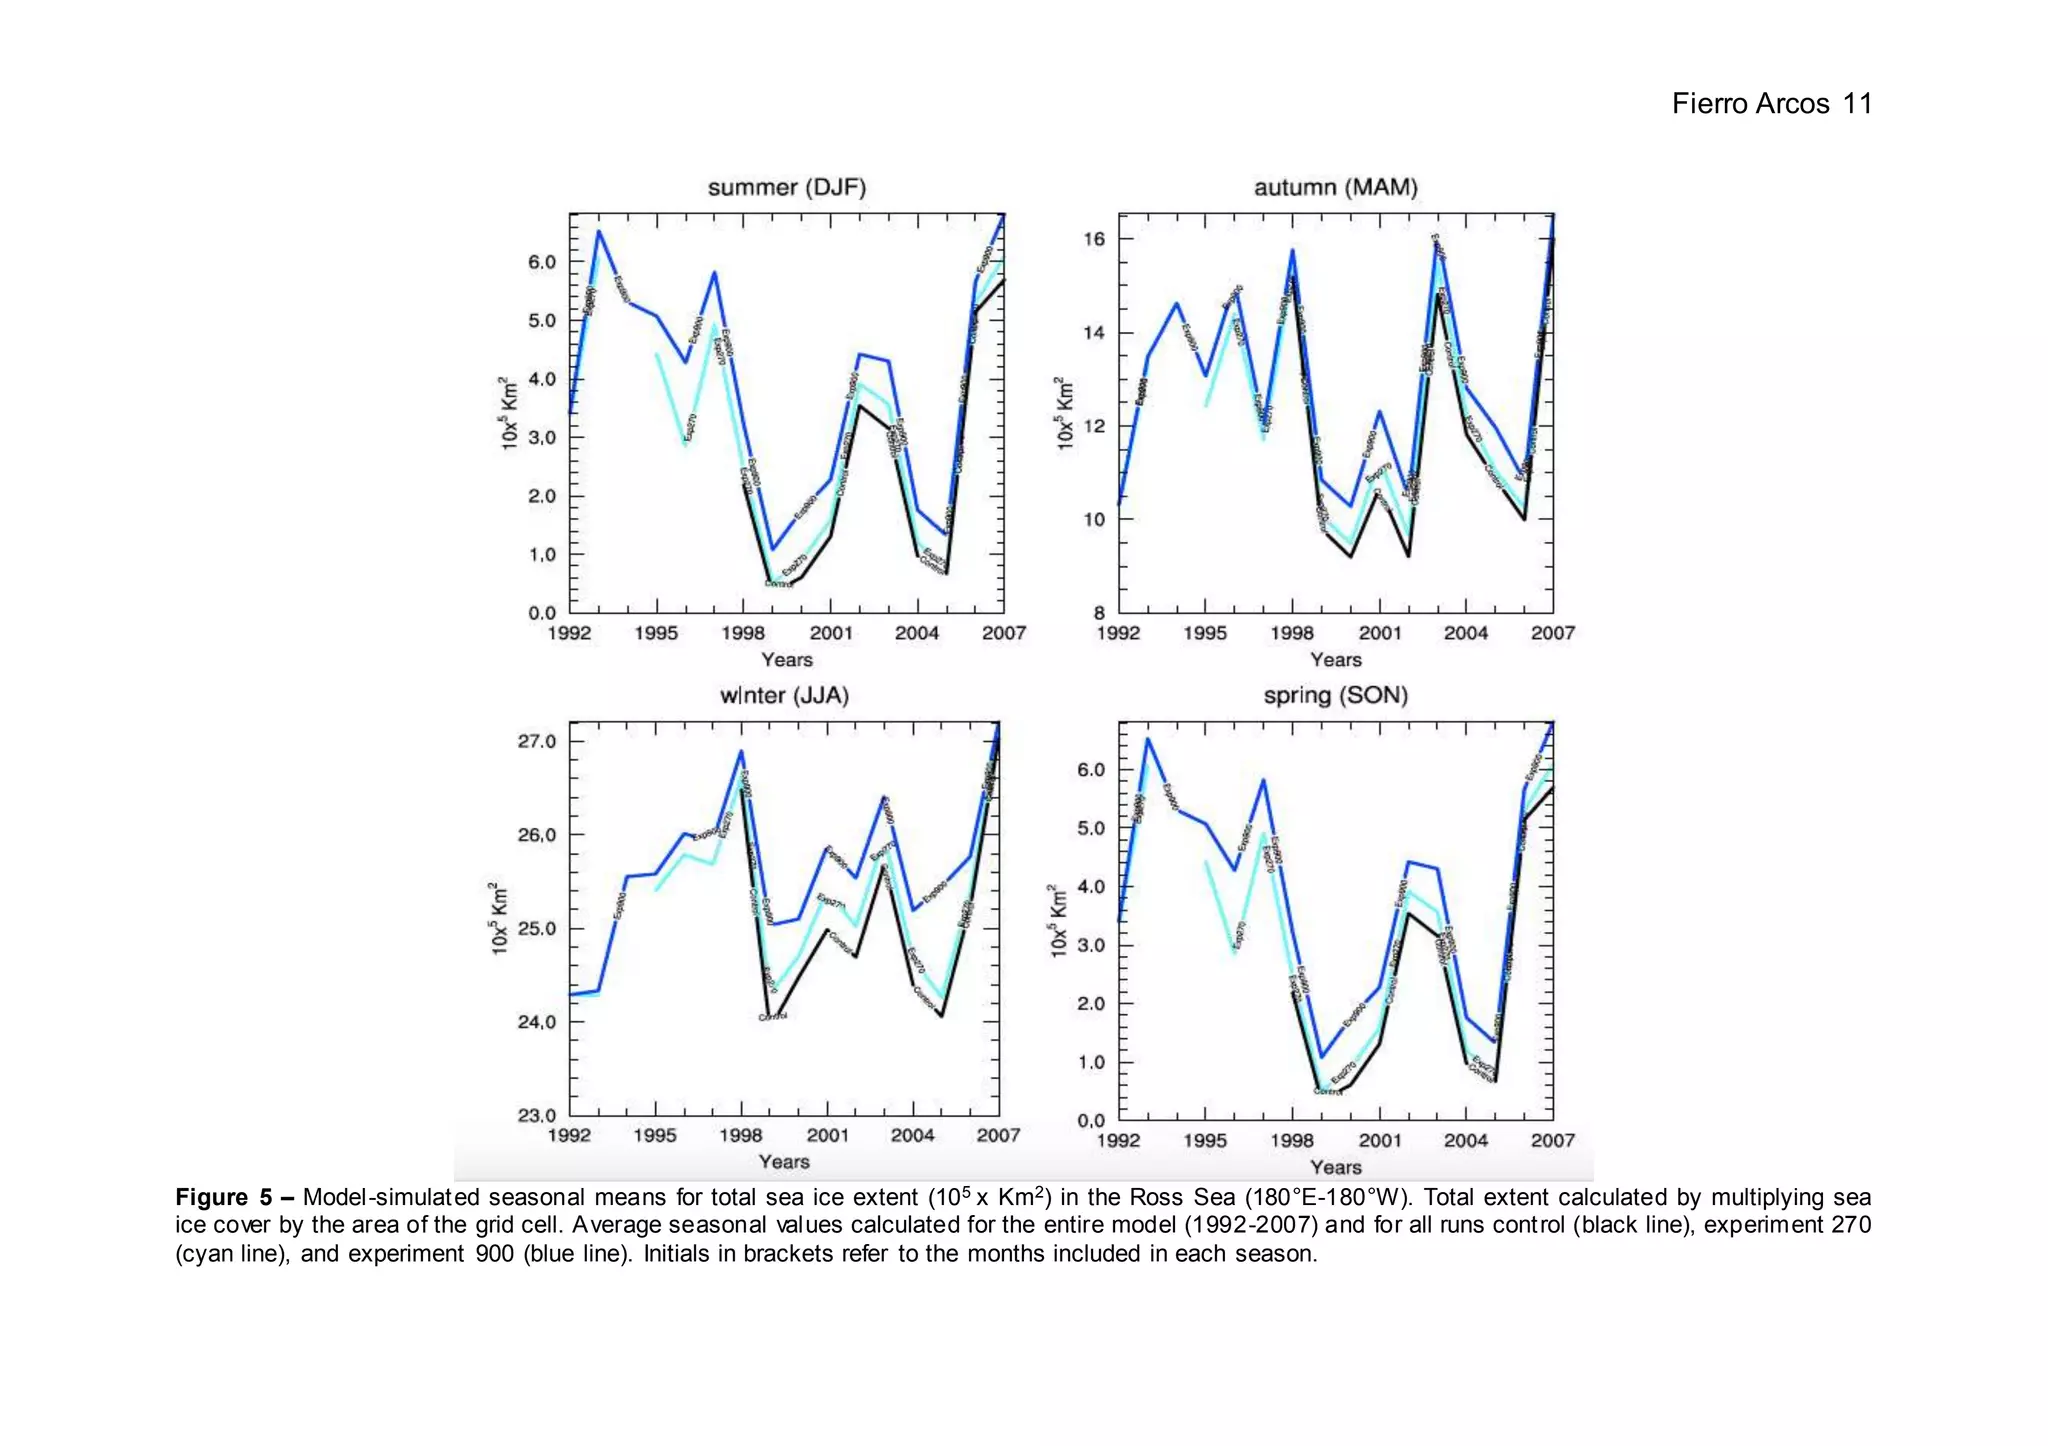
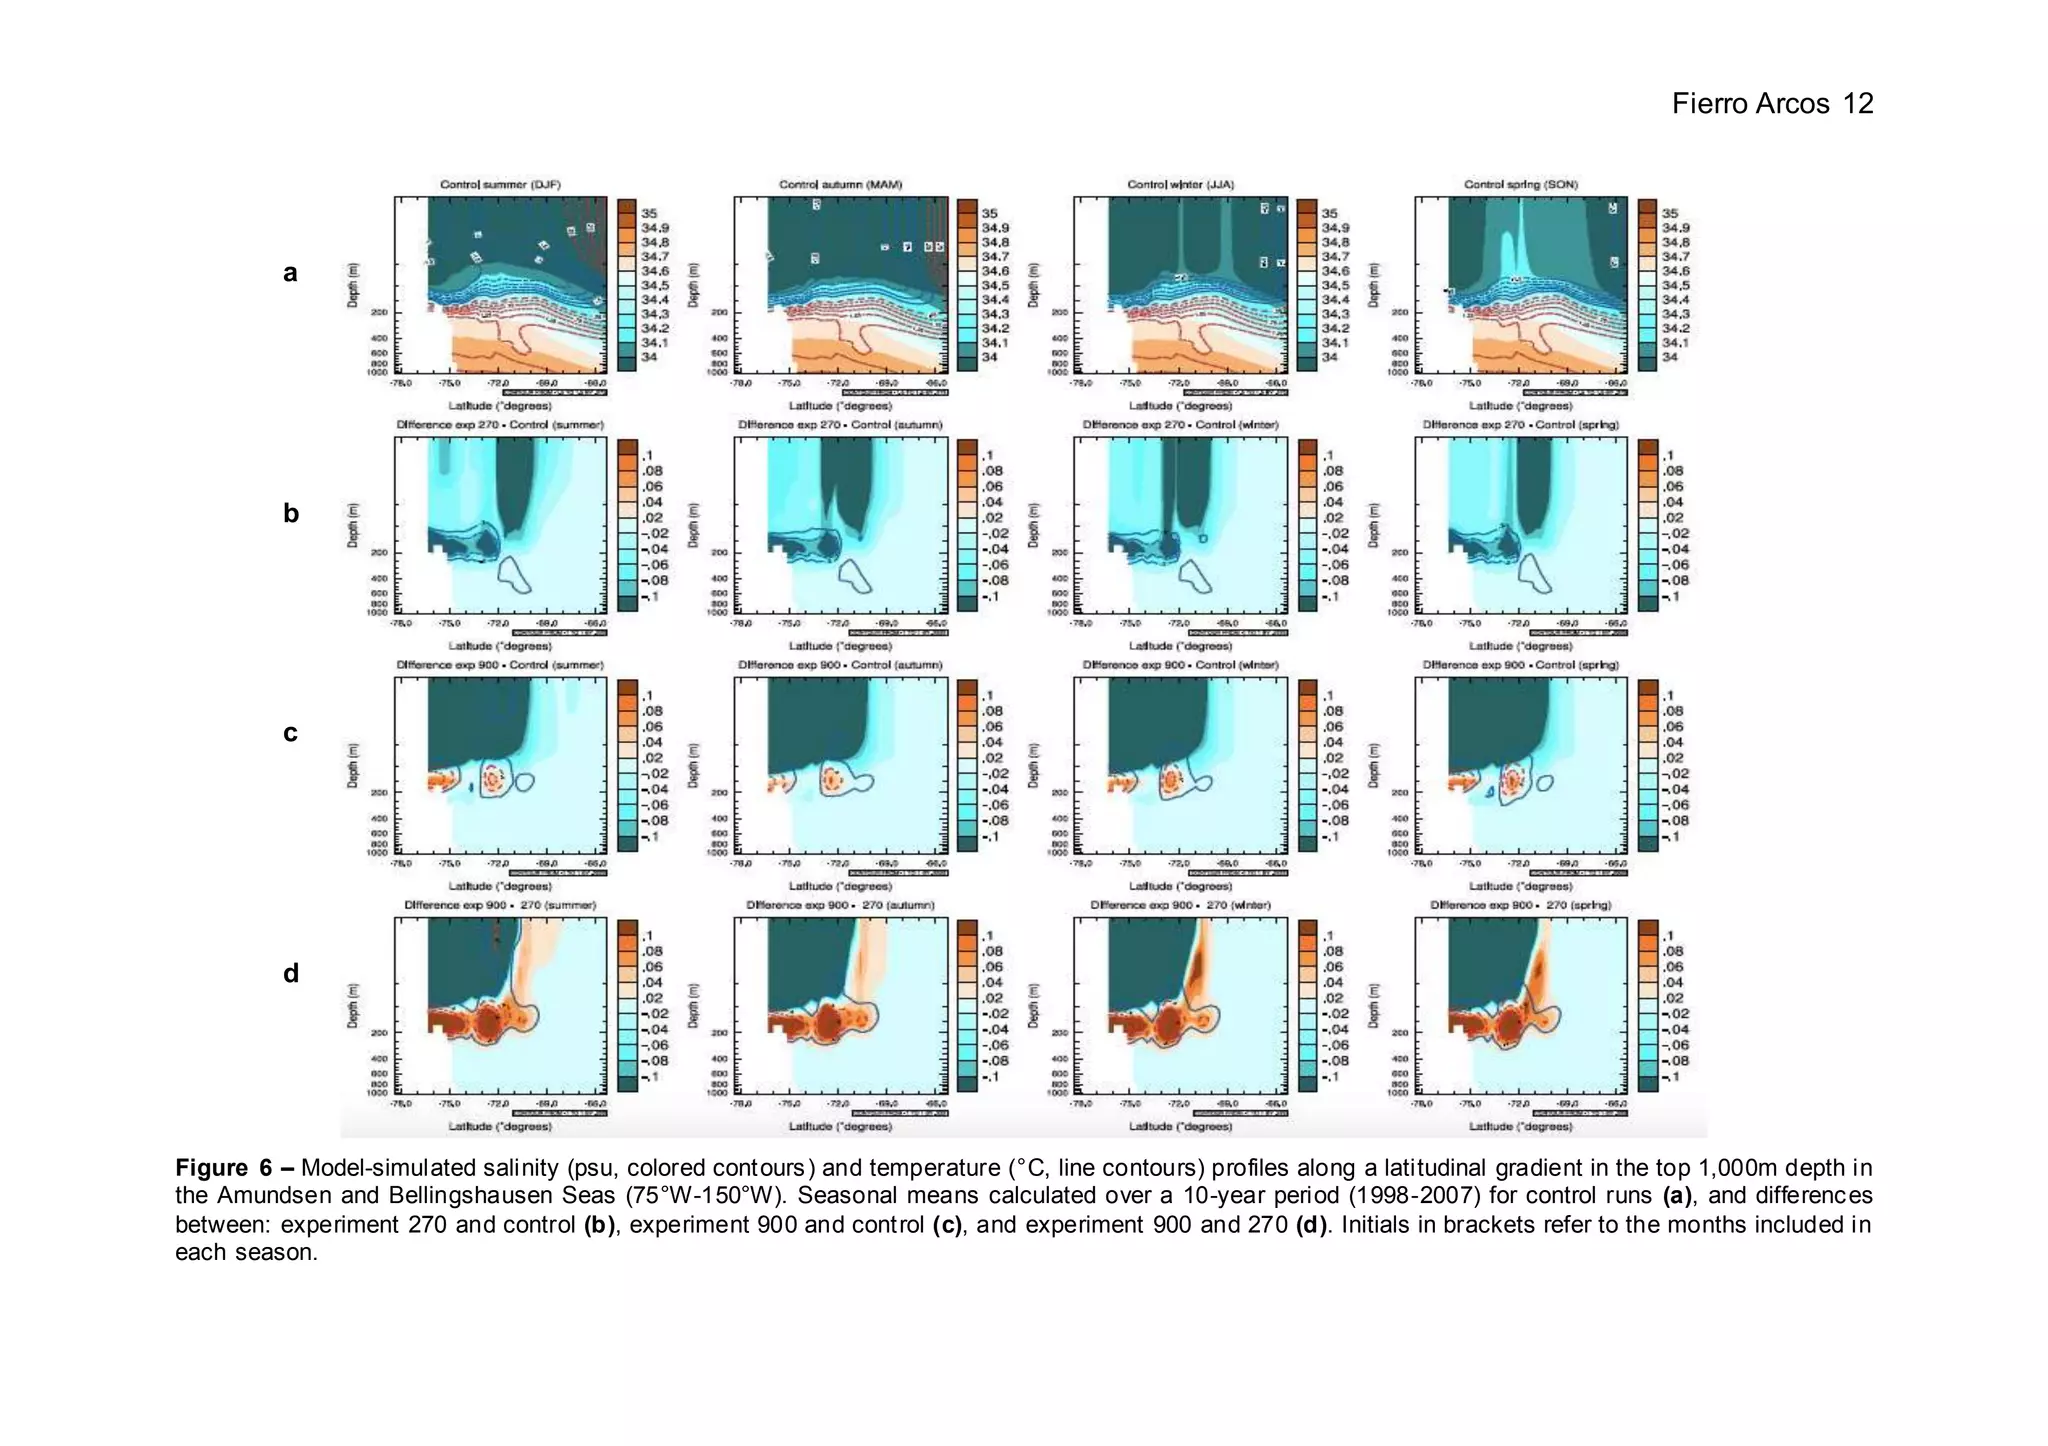
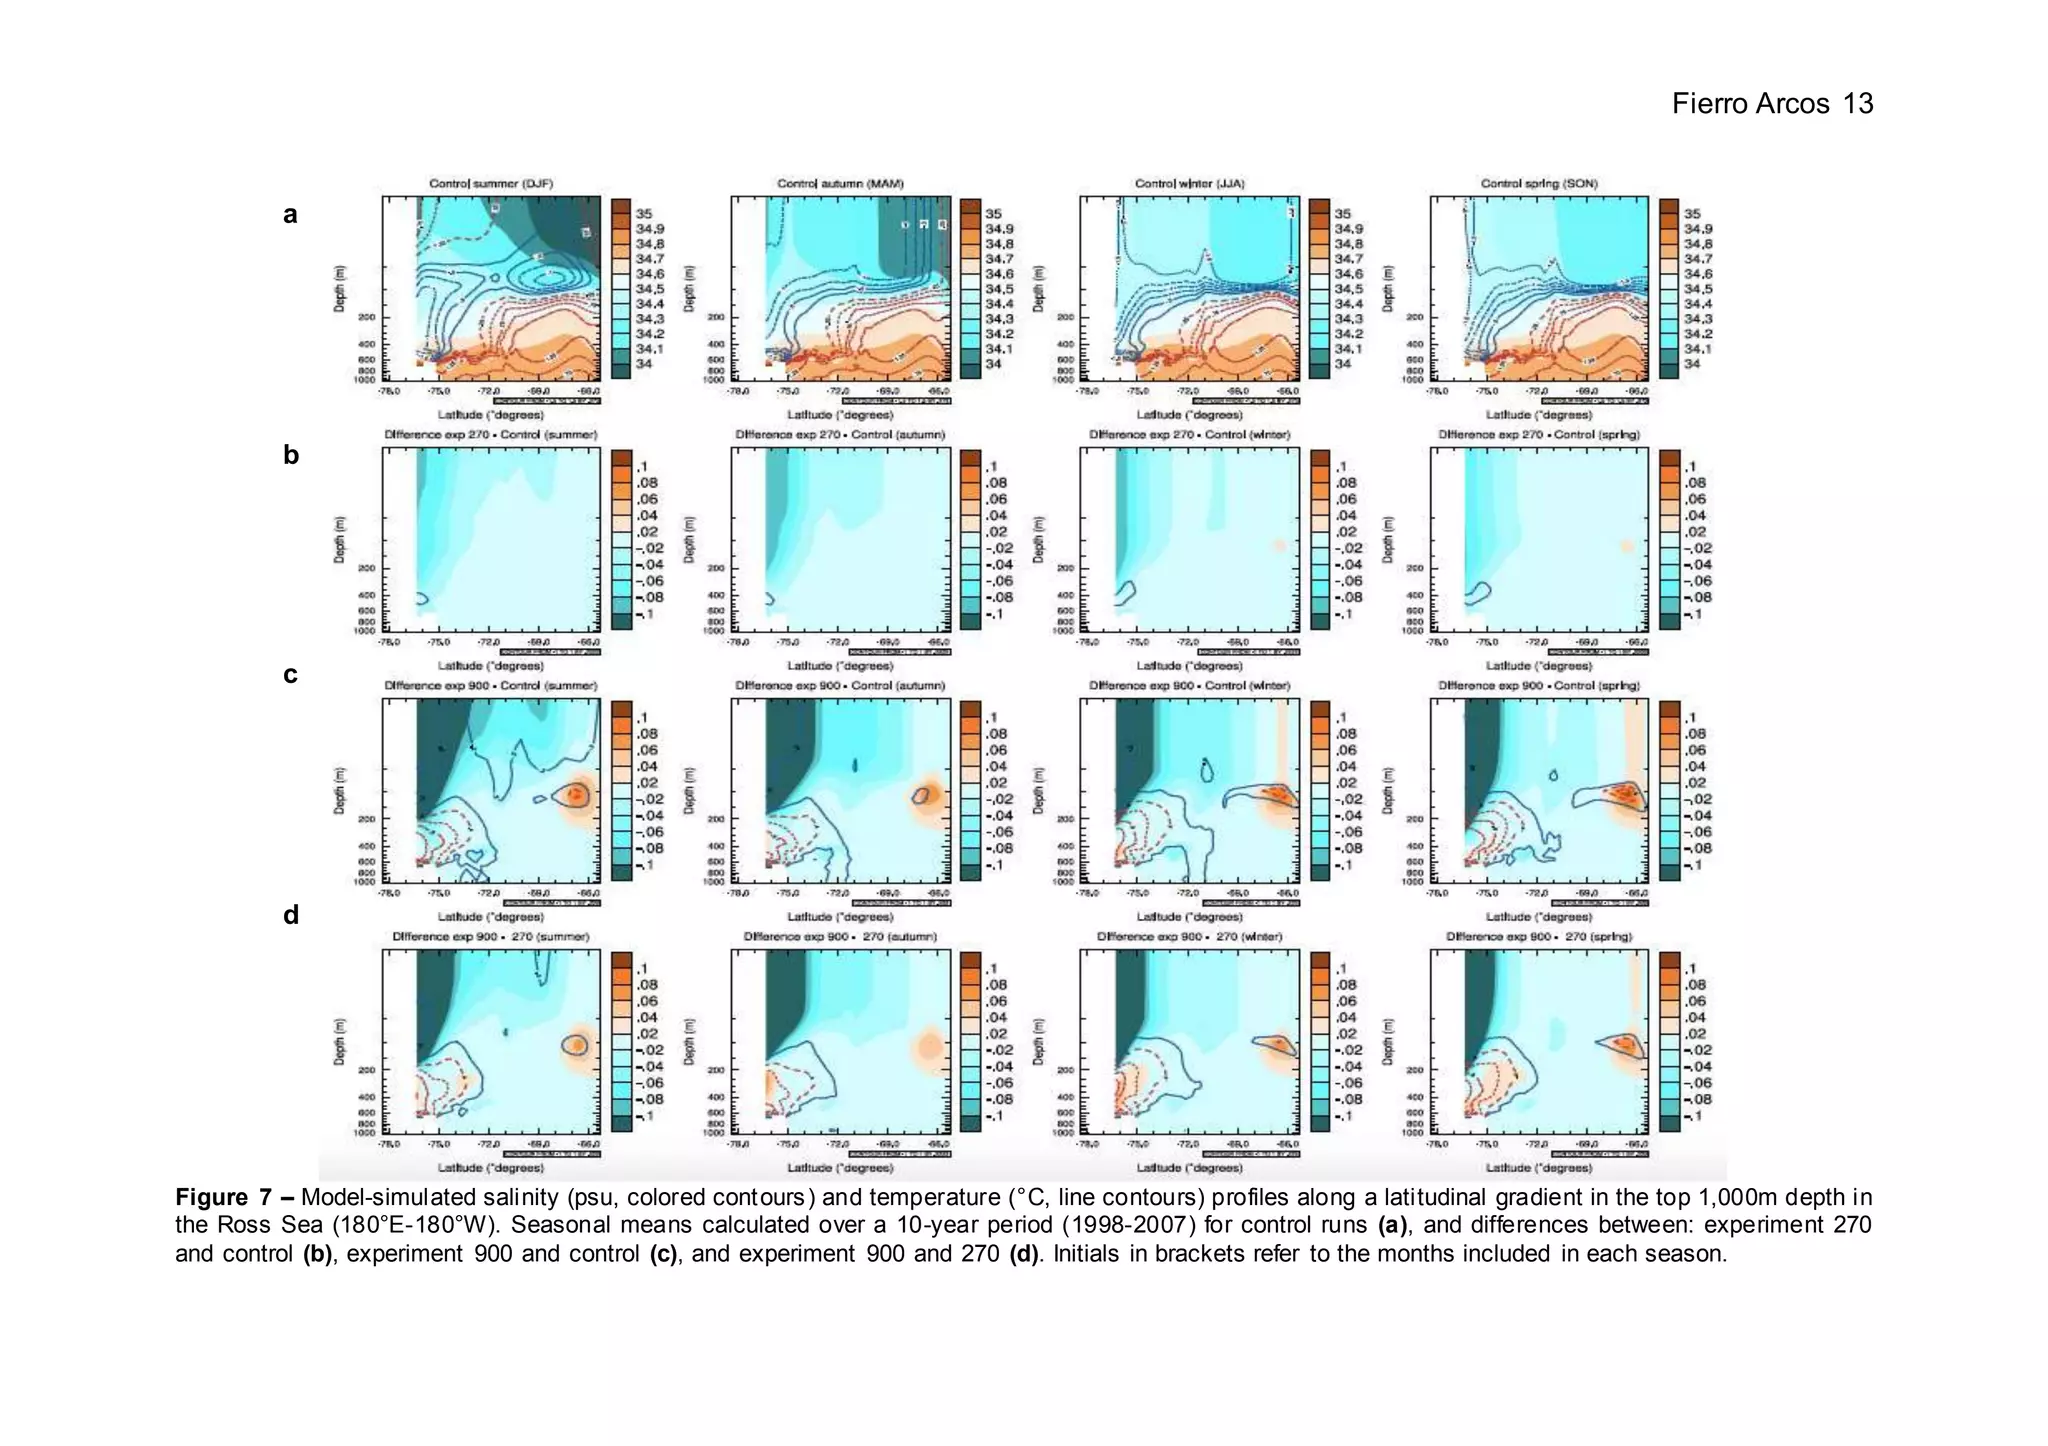
Fierro Arcos 1
Effects of increased freshwater input due to melting of ice sheets on sea ice
concentration in the Southern Ocean
Introduction
Sea ice formation and expansion in the Arctic and Antarctic regions is heavily
influenced by changes in global climatic patterns at a seasonal and multiyear scale
(Bintanja et al., 2013). However, changes in sea ice also have an effect on regional
and global climate because it acts as an insulation barrier that reduces ocean
evaporation rates, and heat transfer between the ocean and the atmosphere
(Bintanja et al., 2013, Scott, 2009). Additionally, the high albedo of ice is responsible
for reflecting back more solar energy than ocean water alone (Bintanja et al., 2013,
Scott, 2009). Furthermore, as ice is created, it changes the physical properties of the
surrounding waters, thus creating different water masses, such as the Antarctic
Bottom Water (AABW), which in turn affects ocean circulation at a local and global
scale (Bintanja et al., 2013, Hellmer, 2004, Rye et al., 2014, Scott, 2009).
As atmospheric and ocean temperatures continue to increase in response to
global warming, we expect ice extent and volume to decrease in the poles. In the
Arctic, a negative trend in sea ice cover and volume has been recorded, with an
average loss of 5.3±0.6% per decade since 1985 (Bintanja et al., 2013). However,
Antarctica shows an increase in total sea ice cover of 1.9±1.3% per decade since
1985, with peaks recorded spatially (near the sea ice margin and around the Ross
Sea), and temporally (austral autumn and early winter) (Bintanja et al., 2013).
Moreover, this increase in sea ice is linked to a decrease in sea surface
temperatures (SSTs) in the Southern Ocean (Bintanja et al., 2013).
The reason for this increase in Antarctic sea ice is not immediately clear, and
several explanations have been proposed, which are related to changes in either
atmospheric or oceanic conditions promoting cooling of the upper surface of the
ocean. One theory suggests that a positive Southern Annular Mode (SAM) index,
which results in the polar migration and strengthening of westerly winds in the
Southern Ocean, is responsible for atmospheric cooling over Antarctica and hence
promoting sea ice expansion (Bintanja et al., 2013). Increases in the SAM index
have been recorded between the 1980s and 2000 during austral autumn and winter,
but researchers found that it only explains about 25% of the observed trends in sea
ice (Bintanja et al., 2013).
Fierro Arcos 2
An alternative explanation looks at changes in the Southern Ocean.
Subsurface Antarctic waters (deeper than 200m) have warmed in line with global
trends, with the Circumpolar Deep Water (CDW) responsible for most of the melting
of ice shelves has been increasing in temperature at an even faster rate (Bintanja et
al., 2013). As CDW continuous to warm, it significantly increases the basal ice shelf
melt rate as it reaches the continental shelves. The Amundsen and Bellingshausen
Seas in West Antarctica is the area where most of the melting occurs, with observed
ice mass losses of between 250Gt and 350Gt per year (Bintanja et al., 2013, Rye et
al., 2014, Rignot and Jacobs, 2002). However, surface waters have been cooling in
most of Antarctica, with the exception of the Bellingshausen Sea (Bintanja et al.,
2013). This cooler surface is the result of basal melting as melt water is fresher and
cooler, therefore less dense than surrounding waters, so it tends to accumulate in
the top layer. Differences in density and temperature between the surface and
subsurface layers lead to a more stratified water column where less convective
mixing and heat exchange occurs (Bintanja et al., 2013, Hellmer, 2004, Rignot and
Jacobs, 2002). As the top layer is cooler and stable, it is more effective cooled by the
atmosphere and sea ice formation results (Bintanja et al., 2013).
To test the freshwater input hypothesis, 10 years worth of data from an ocean
circulation model with two freshwater runoff levels was analyzed. Preliminary
findings are reported below.
Methods
Results from a global ocean circulation model used by Rye et al. (2014) were
analyzed. This simulation used the NEMO (Nucleus for European Modeling of the
Ocean) model with a 1° resolution tri-polar grid (ORCA1). The simulation covered a
total of 15 years (1992-2007) with one control and two experimental runs. The
control run used freshwater input levels similar to those recorded in Antarctica, while
the experiments had a higher than observed freshwater flux of 270 and 900 Gt/year
respectively, which was applied on the surface on a 8° by 2° area centered on the
Amundsen-Bellingshausen continental shelves. All experiments were subjected to
the same conditions, so any observed changes are a result of changes in freshwater
input levels. More information can be obtained from the Supplementary Methods in
Rye et al. (2014).
Fierro Arcos 3
Results
Overall seasonal changes in sea ice cover and thickness as well as changes
in heat flux were examined at a regional level. The review looked at a 10-year period
between 1998 and 2007.
Average Seasonal Sea Ice Cover
Sea ice cover increased in all seasons in experiment 270 (Figure 1). Little
change was seen in winter, with small gains in the Ross Sea. Gains were seen in the
Amundsen Sea Embayment in spring. Most of the gain in cover happened during
autumn and summer in the Amundsen Sea and the western side of the
Bellingshausen Sea (approx. between 90°W-150°W). Small decreases were seen
during these seasons, but they were confined to the eastern side of the
Bellingshausen Sea, just east from Alexander Island (approx. between 75°W-90°W)
during summer.
Experiment 900 showed further gains in sea ice cover in the Ross Sea all
year, with a peak reached in summer (Figure 1). However, the Amundsen and
Bellingshausen Seas (particularly around Thurston Island) saw widespread loses
with most of the decrease happening in summer. East Antarctica, off the coast of
Wilkes and Victoria Lands also experienced loss in cover.
In both experiments, most of the change occurred along the coastal margin.
Average Seasonal Sea Ice Thickness
Changes in sea ice thickness follow the same patterns observed in sea ice
cover with the only difference that changes in thickness extended further out to sea
in both experiments (Figure 2).
In experiment 270, gains in sea ice thickness in the Ross Sea were seen in
winter and spring only. Summer and autumn is when most of the gains in sea ice
thickness happened in the Amundsen Sea. Furthermore, a very small area in the
Bellingshausen Sea showed a small negative trend year round (Figure 2).
Same pattern as cover is repeated in experiment 900, with an increase in
freshwater results in thicker sea ice in the Ross Sea with most of the gains
happening in spring. On the contrary, the Amundsen and Bellingshausen Seas
experienced a decrease in sea ice thickness (Figure 2). Small losses were also seen
Fierro Arcos 4
in the Weddell Sea (all seasons), and off the coast of Wilkes Land (winter and spring
only).
Average heat flux between ocean and ice base
Heat flux changes in summer do not seem to have a clear pattern; the reason
behind this is unknown as it goes beyond the scope of this analysis (Figure 3).
Between autumn and spring there is an overall decrease in heat flux along the
West Antarctica coastline from the Bellingshausen to the Ross Sea under
experiment 270, with most of the decline was observed seen in autumn (Figure 3).
Under experiment 900, we see two patterns: one of heat flux loss in the Ross
Sea and one of gain in the Amundsen and Bellingshausen Seas, as well as parts of
East Antarctica (Figure 3).
The first part of this analysis revealed that most of the changes in sea ice
coverage and thickness occur mostly in two areas: the Amundsen and
Bellingshausen Seas (75°W-150°W), and the Ross Sea (180°E-180°W). To
understand what is driving these changes, further analysis were completed.
Total Sea Ice Extent
Sea Ice Extent was calculated by multiplying the sea ice percentage cover
and the total area for each grid cell. In the Amundsen and Bellingshausen Seas,
changes in sea ice extent start to occur at the end of 1997, almost six years after
extra freshwater was applied. Under experiment 270 shows gains in sea ice extent,
but losses under experiment 900. However, almost no difference is seen among all
runs in this area during winter (Figure 5).
In the Ross Sea, changes in sea ice extent are seen since at least 1995, but
since the data for 1994 is not available, changes may have occurred from this point.
Under both experiments there is an increase in total extent during all seasons
(Figure 5).
Salinity and temperature profiles
In the Amundsen and Bellingshausen Seas, under experiment 270 there is a
freshening of the surface layer (up to 100m), with the biggest change happening
between 70°S and 73°S in autumn and winter. Freshening and cooling is also seen
in subsurface layers from the coast up until 71°S. Under experiment 900, strong
Fierro Arcos 5
freshening of the water column reaches bigger depths (until ~150m) and covers a
bigger area, extending from the coastal margins to 69°S. In this experiment we also
see pockets of saltier, warmer water just below the area of freshening extending up
to 200Km away from the coast (Figure 6).
The Ross Sea follows similar patterns in both experiments, with the difference
that as extra water is added to the model, the area of freshening of water increases
in depth and distance from the coastline. A peak in freshening is seen in summer.
Another difference between the two experiments is that temperature differences are
not seen in experiment 270, but the water closest to the coast does experience some
cooling under experiment 900. Temperature and salinity increases are also seen in
small pockets between 200 and 600m depth in experiment 900 (Figure 7).
Discussion
Analysis of the model data shows a positive relationship between freshwater
flux, sea ice extent and thickness, and a negative relationship with salinity,
temperature, and heat flux (between the ocean and the base of the sea ice) in the
Ross Sea. The same trends are seen in the Amundsen and Bellingshausen Seas at
low freshwater influx levels, but under experiment 900, these relationships reverse.
The mechanisms influence these non-linear trends in the Amundsen and
Bellingshausen region have not been identified as that is beyond the scope of this
analysis. Observations in Antarctica point towards an increase in SSTs and
subsequently a decrease in sea ice in the Bellingshausen Sea, but researchers are
still unsure about the causes for this increase (Bintanja et al., 2013). Perhaps a
bigger area of more stable and stratified water leads to further warming, as that
appears to be the major difference between all the experimental runs. Further
research needs to be carried out to clarify the source of this non-linearity.
Fierro Arcos 6
References
BINTANJA, R., OLDENBORGH, G. J. V., DRIJFHOUT, S. S., WOUTERS, B. &
KATSMAN, C. A. 2013. Important role for ocean warming and increased ice-
shelf melt in Antarctic sea-ice expansion. Nature Geoscience, 6, 376-379.
HELLMER, H. H. 2004. Impact of Antarctic ice shelf basal melting on sea ice and
deep ocean properties. Geophysical Research Letters, 31, L10307.
RIGNOT, E. & JACOBS, S. S. 2002. Rapid Bottom Melting Widespread near
Antarctic Ice Sheet Grounding Lines. Science, 296, 2020-2023.
RYE, C. D., NAVEIRA-GARABATO, A. C., HOLLAND, P. R., MEREDITH, M. P.,
NURSER, A. J. G., HUGHES, C. W., COWARD, A. C. & WEBB, D. J. 2014.
Rapid sea-level rise along the Antarctic margins in response to increased
glacial discharge. Nature Geoscience, 7, 732-735.
SCOTT, M. 2009. Sea Ice [Online]. NASA - EOS Project Science Office. Available:
http://earthobservatory.nasa.gov/Features/SeaIce/ [Accessed February 17th
2016].
Fierro Arcos 7
Figure 1 – Seasonal model-simulated means sea ice coverage (%) in the Southern Ocean. Seasonal averages taken over a 10-year period (1998-2007) for
control runs (a), and differences between: experiment 270 and control (b), experiment 900 and control (c), and experiment 900 and 270 (d). Initials in
brackets refer to the months included in each season.
a
b
c
d
Fierro Arcos 8
Figure 2 – Seasonal model-simulated means for sea ice thickness (m) in the Southern Ocean. Seasonal averages taken over a 10-year period (1998-2007)
for control runs (a), and differences between: experiment 270 and control (b), experiment 900 and control (c), and experiment 900 and 270 (d). Initials in
brackets refer to the months included in each season.
a
b
c
d
Fierro Arcos 9
Figure 3 – Model-simulated seasonal means for heat flux between water column and ice base (W/m2) in the Southern Ocean. Seasonal averages taken over
a 10-year period (1998-2007) for control runs (a), and differences between: experiment 270 and control (b), experiment 900 and control (c), and experiment
900 and 270 (d). Initials in brackets refer to the months included in each season.
a
b
c
d
Fierro Arcos 10
Figure 4 – Model-simulated seasonal means for total sea ice extent (105 x Km2) in the Amundsen and Bellingshausen Seas (75°W -150°W). Total extent
calculated by multiplying sea ice cover by the area of the grid cell. Average seasonal values calculated for the entire model (1992-2007) and for all runs
control (black line), experiment 270 (cyan line), and experiment 900 (blue line). Initials in brackets refer to the months included in each season.
Fierro Arcos 11
Figure 5 – Model-simulated seasonal means for total sea ice extent (105 x Km2) in the Ross Sea (180°E-180°W). Total extent calculated by multiplying sea
ice cover by the area of the grid cell. Average seasonal values calculated for the entire model (1992-2007) and for all runs control (black line), experiment 270
(cyan line), and experiment 900 (blue line). Initials in brackets refer to the months included in each season.
Fierro Arcos 12
Figure 6 – Model-simulated salinity (psu, colored contours) and temperature (°C, line contours) profiles along a latitudinal gradient in the top 1,000m depth in
the Amundsen and Bellingshausen Seas (75°W-150°W). Seasonal means calculated over a 10-year period (1998-2007) for control runs (a), and differences
between: experiment 270 and control (b), experiment 900 and control (c), and experiment 900 and 270 (d). Initials in brackets refer to the months included in
each season.
c
d
b
a
Fierro Arcos 13
Figure 7 – Model-simulated salinity (psu, colored contours) and temperature (°C, line contours) profiles along a latitudinal gradient in the top 1,000m depth in
the Ross Sea (180°E-180°W). Seasonal means calculated over a 10-year period (1998-2007) for control runs (a), and differences between: experiment 270
and control (b), experiment 900 and control (c), and experiment 900 and 270 (d). Initials in brackets refer to the months included in each season.
c
d
b
a

Final Report

  • 1.
    Fierro Arcos 1 Effectsof increased freshwater input due to melting of ice sheets on sea ice concentration in the Southern Ocean Introduction Sea ice formation and expansion in the Arctic and Antarctic regions is heavily influenced by changes in global climatic patterns at a seasonal and multiyear scale (Bintanja et al., 2013). However, changes in sea ice also have an effect on regional and global climate because it acts as an insulation barrier that reduces ocean evaporation rates, and heat transfer between the ocean and the atmosphere (Bintanja et al., 2013, Scott, 2009). Additionally, the high albedo of ice is responsible for reflecting back more solar energy than ocean water alone (Bintanja et al., 2013, Scott, 2009). Furthermore, as ice is created, it changes the physical properties of the surrounding waters, thus creating different water masses, such as the Antarctic Bottom Water (AABW), which in turn affects ocean circulation at a local and global scale (Bintanja et al., 2013, Hellmer, 2004, Rye et al., 2014, Scott, 2009). As atmospheric and ocean temperatures continue to increase in response to global warming, we expect ice extent and volume to decrease in the poles. In the Arctic, a negative trend in sea ice cover and volume has been recorded, with an average loss of 5.3±0.6% per decade since 1985 (Bintanja et al., 2013). However, Antarctica shows an increase in total sea ice cover of 1.9±1.3% per decade since 1985, with peaks recorded spatially (near the sea ice margin and around the Ross Sea), and temporally (austral autumn and early winter) (Bintanja et al., 2013). Moreover, this increase in sea ice is linked to a decrease in sea surface temperatures (SSTs) in the Southern Ocean (Bintanja et al., 2013). The reason for this increase in Antarctic sea ice is not immediately clear, and several explanations have been proposed, which are related to changes in either atmospheric or oceanic conditions promoting cooling of the upper surface of the ocean. One theory suggests that a positive Southern Annular Mode (SAM) index, which results in the polar migration and strengthening of westerly winds in the Southern Ocean, is responsible for atmospheric cooling over Antarctica and hence promoting sea ice expansion (Bintanja et al., 2013). Increases in the SAM index have been recorded between the 1980s and 2000 during austral autumn and winter, but researchers found that it only explains about 25% of the observed trends in sea ice (Bintanja et al., 2013).
  • 2.
    Fierro Arcos 2 Analternative explanation looks at changes in the Southern Ocean. Subsurface Antarctic waters (deeper than 200m) have warmed in line with global trends, with the Circumpolar Deep Water (CDW) responsible for most of the melting of ice shelves has been increasing in temperature at an even faster rate (Bintanja et al., 2013). As CDW continuous to warm, it significantly increases the basal ice shelf melt rate as it reaches the continental shelves. The Amundsen and Bellingshausen Seas in West Antarctica is the area where most of the melting occurs, with observed ice mass losses of between 250Gt and 350Gt per year (Bintanja et al., 2013, Rye et al., 2014, Rignot and Jacobs, 2002). However, surface waters have been cooling in most of Antarctica, with the exception of the Bellingshausen Sea (Bintanja et al., 2013). This cooler surface is the result of basal melting as melt water is fresher and cooler, therefore less dense than surrounding waters, so it tends to accumulate in the top layer. Differences in density and temperature between the surface and subsurface layers lead to a more stratified water column where less convective mixing and heat exchange occurs (Bintanja et al., 2013, Hellmer, 2004, Rignot and Jacobs, 2002). As the top layer is cooler and stable, it is more effective cooled by the atmosphere and sea ice formation results (Bintanja et al., 2013). To test the freshwater input hypothesis, 10 years worth of data from an ocean circulation model with two freshwater runoff levels was analyzed. Preliminary findings are reported below. Methods Results from a global ocean circulation model used by Rye et al. (2014) were analyzed. This simulation used the NEMO (Nucleus for European Modeling of the Ocean) model with a 1° resolution tri-polar grid (ORCA1). The simulation covered a total of 15 years (1992-2007) with one control and two experimental runs. The control run used freshwater input levels similar to those recorded in Antarctica, while the experiments had a higher than observed freshwater flux of 270 and 900 Gt/year respectively, which was applied on the surface on a 8° by 2° area centered on the Amundsen-Bellingshausen continental shelves. All experiments were subjected to the same conditions, so any observed changes are a result of changes in freshwater input levels. More information can be obtained from the Supplementary Methods in Rye et al. (2014).
  • 3.
    Fierro Arcos 3 Results Overallseasonal changes in sea ice cover and thickness as well as changes in heat flux were examined at a regional level. The review looked at a 10-year period between 1998 and 2007. Average Seasonal Sea Ice Cover Sea ice cover increased in all seasons in experiment 270 (Figure 1). Little change was seen in winter, with small gains in the Ross Sea. Gains were seen in the Amundsen Sea Embayment in spring. Most of the gain in cover happened during autumn and summer in the Amundsen Sea and the western side of the Bellingshausen Sea (approx. between 90°W-150°W). Small decreases were seen during these seasons, but they were confined to the eastern side of the Bellingshausen Sea, just east from Alexander Island (approx. between 75°W-90°W) during summer. Experiment 900 showed further gains in sea ice cover in the Ross Sea all year, with a peak reached in summer (Figure 1). However, the Amundsen and Bellingshausen Seas (particularly around Thurston Island) saw widespread loses with most of the decrease happening in summer. East Antarctica, off the coast of Wilkes and Victoria Lands also experienced loss in cover. In both experiments, most of the change occurred along the coastal margin. Average Seasonal Sea Ice Thickness Changes in sea ice thickness follow the same patterns observed in sea ice cover with the only difference that changes in thickness extended further out to sea in both experiments (Figure 2). In experiment 270, gains in sea ice thickness in the Ross Sea were seen in winter and spring only. Summer and autumn is when most of the gains in sea ice thickness happened in the Amundsen Sea. Furthermore, a very small area in the Bellingshausen Sea showed a small negative trend year round (Figure 2). Same pattern as cover is repeated in experiment 900, with an increase in freshwater results in thicker sea ice in the Ross Sea with most of the gains happening in spring. On the contrary, the Amundsen and Bellingshausen Seas experienced a decrease in sea ice thickness (Figure 2). Small losses were also seen
  • 4.
    Fierro Arcos 4 inthe Weddell Sea (all seasons), and off the coast of Wilkes Land (winter and spring only). Average heat flux between ocean and ice base Heat flux changes in summer do not seem to have a clear pattern; the reason behind this is unknown as it goes beyond the scope of this analysis (Figure 3). Between autumn and spring there is an overall decrease in heat flux along the West Antarctica coastline from the Bellingshausen to the Ross Sea under experiment 270, with most of the decline was observed seen in autumn (Figure 3). Under experiment 900, we see two patterns: one of heat flux loss in the Ross Sea and one of gain in the Amundsen and Bellingshausen Seas, as well as parts of East Antarctica (Figure 3). The first part of this analysis revealed that most of the changes in sea ice coverage and thickness occur mostly in two areas: the Amundsen and Bellingshausen Seas (75°W-150°W), and the Ross Sea (180°E-180°W). To understand what is driving these changes, further analysis were completed. Total Sea Ice Extent Sea Ice Extent was calculated by multiplying the sea ice percentage cover and the total area for each grid cell. In the Amundsen and Bellingshausen Seas, changes in sea ice extent start to occur at the end of 1997, almost six years after extra freshwater was applied. Under experiment 270 shows gains in sea ice extent, but losses under experiment 900. However, almost no difference is seen among all runs in this area during winter (Figure 5). In the Ross Sea, changes in sea ice extent are seen since at least 1995, but since the data for 1994 is not available, changes may have occurred from this point. Under both experiments there is an increase in total extent during all seasons (Figure 5). Salinity and temperature profiles In the Amundsen and Bellingshausen Seas, under experiment 270 there is a freshening of the surface layer (up to 100m), with the biggest change happening between 70°S and 73°S in autumn and winter. Freshening and cooling is also seen in subsurface layers from the coast up until 71°S. Under experiment 900, strong
  • 5.
    Fierro Arcos 5 fresheningof the water column reaches bigger depths (until ~150m) and covers a bigger area, extending from the coastal margins to 69°S. In this experiment we also see pockets of saltier, warmer water just below the area of freshening extending up to 200Km away from the coast (Figure 6). The Ross Sea follows similar patterns in both experiments, with the difference that as extra water is added to the model, the area of freshening of water increases in depth and distance from the coastline. A peak in freshening is seen in summer. Another difference between the two experiments is that temperature differences are not seen in experiment 270, but the water closest to the coast does experience some cooling under experiment 900. Temperature and salinity increases are also seen in small pockets between 200 and 600m depth in experiment 900 (Figure 7). Discussion Analysis of the model data shows a positive relationship between freshwater flux, sea ice extent and thickness, and a negative relationship with salinity, temperature, and heat flux (between the ocean and the base of the sea ice) in the Ross Sea. The same trends are seen in the Amundsen and Bellingshausen Seas at low freshwater influx levels, but under experiment 900, these relationships reverse. The mechanisms influence these non-linear trends in the Amundsen and Bellingshausen region have not been identified as that is beyond the scope of this analysis. Observations in Antarctica point towards an increase in SSTs and subsequently a decrease in sea ice in the Bellingshausen Sea, but researchers are still unsure about the causes for this increase (Bintanja et al., 2013). Perhaps a bigger area of more stable and stratified water leads to further warming, as that appears to be the major difference between all the experimental runs. Further research needs to be carried out to clarify the source of this non-linearity.
  • 6.
    Fierro Arcos 6 References BINTANJA,R., OLDENBORGH, G. J. V., DRIJFHOUT, S. S., WOUTERS, B. & KATSMAN, C. A. 2013. Important role for ocean warming and increased ice- shelf melt in Antarctic sea-ice expansion. Nature Geoscience, 6, 376-379. HELLMER, H. H. 2004. Impact of Antarctic ice shelf basal melting on sea ice and deep ocean properties. Geophysical Research Letters, 31, L10307. RIGNOT, E. & JACOBS, S. S. 2002. Rapid Bottom Melting Widespread near Antarctic Ice Sheet Grounding Lines. Science, 296, 2020-2023. RYE, C. D., NAVEIRA-GARABATO, A. C., HOLLAND, P. R., MEREDITH, M. P., NURSER, A. J. G., HUGHES, C. W., COWARD, A. C. & WEBB, D. J. 2014. Rapid sea-level rise along the Antarctic margins in response to increased glacial discharge. Nature Geoscience, 7, 732-735. SCOTT, M. 2009. Sea Ice [Online]. NASA - EOS Project Science Office. Available: http://earthobservatory.nasa.gov/Features/SeaIce/ [Accessed February 17th 2016].
  • 7.
    Fierro Arcos 7 Figure1 – Seasonal model-simulated means sea ice coverage (%) in the Southern Ocean. Seasonal averages taken over a 10-year period (1998-2007) for control runs (a), and differences between: experiment 270 and control (b), experiment 900 and control (c), and experiment 900 and 270 (d). Initials in brackets refer to the months included in each season. a b c d
  • 8.
    Fierro Arcos 8 Figure2 – Seasonal model-simulated means for sea ice thickness (m) in the Southern Ocean. Seasonal averages taken over a 10-year period (1998-2007) for control runs (a), and differences between: experiment 270 and control (b), experiment 900 and control (c), and experiment 900 and 270 (d). Initials in brackets refer to the months included in each season. a b c d
  • 9.
    Fierro Arcos 9 Figure3 – Model-simulated seasonal means for heat flux between water column and ice base (W/m2) in the Southern Ocean. Seasonal averages taken over a 10-year period (1998-2007) for control runs (a), and differences between: experiment 270 and control (b), experiment 900 and control (c), and experiment 900 and 270 (d). Initials in brackets refer to the months included in each season. a b c d
  • 10.
    Fierro Arcos 10 Figure4 – Model-simulated seasonal means for total sea ice extent (105 x Km2) in the Amundsen and Bellingshausen Seas (75°W -150°W). Total extent calculated by multiplying sea ice cover by the area of the grid cell. Average seasonal values calculated for the entire model (1992-2007) and for all runs control (black line), experiment 270 (cyan line), and experiment 900 (blue line). Initials in brackets refer to the months included in each season.
  • 11.
    Fierro Arcos 11 Figure5 – Model-simulated seasonal means for total sea ice extent (105 x Km2) in the Ross Sea (180°E-180°W). Total extent calculated by multiplying sea ice cover by the area of the grid cell. Average seasonal values calculated for the entire model (1992-2007) and for all runs control (black line), experiment 270 (cyan line), and experiment 900 (blue line). Initials in brackets refer to the months included in each season.
  • 12.
    Fierro Arcos 12 Figure6 – Model-simulated salinity (psu, colored contours) and temperature (°C, line contours) profiles along a latitudinal gradient in the top 1,000m depth in the Amundsen and Bellingshausen Seas (75°W-150°W). Seasonal means calculated over a 10-year period (1998-2007) for control runs (a), and differences between: experiment 270 and control (b), experiment 900 and control (c), and experiment 900 and 270 (d). Initials in brackets refer to the months included in each season. c d b a
  • 13.
    Fierro Arcos 13 Figure7 – Model-simulated salinity (psu, colored contours) and temperature (°C, line contours) profiles along a latitudinal gradient in the top 1,000m depth in the Ross Sea (180°E-180°W). Seasonal means calculated over a 10-year period (1998-2007) for control runs (a), and differences between: experiment 270 and control (b), experiment 900 and control (c), and experiment 900 and 270 (d). Initials in brackets refer to the months included in each season. c d b a