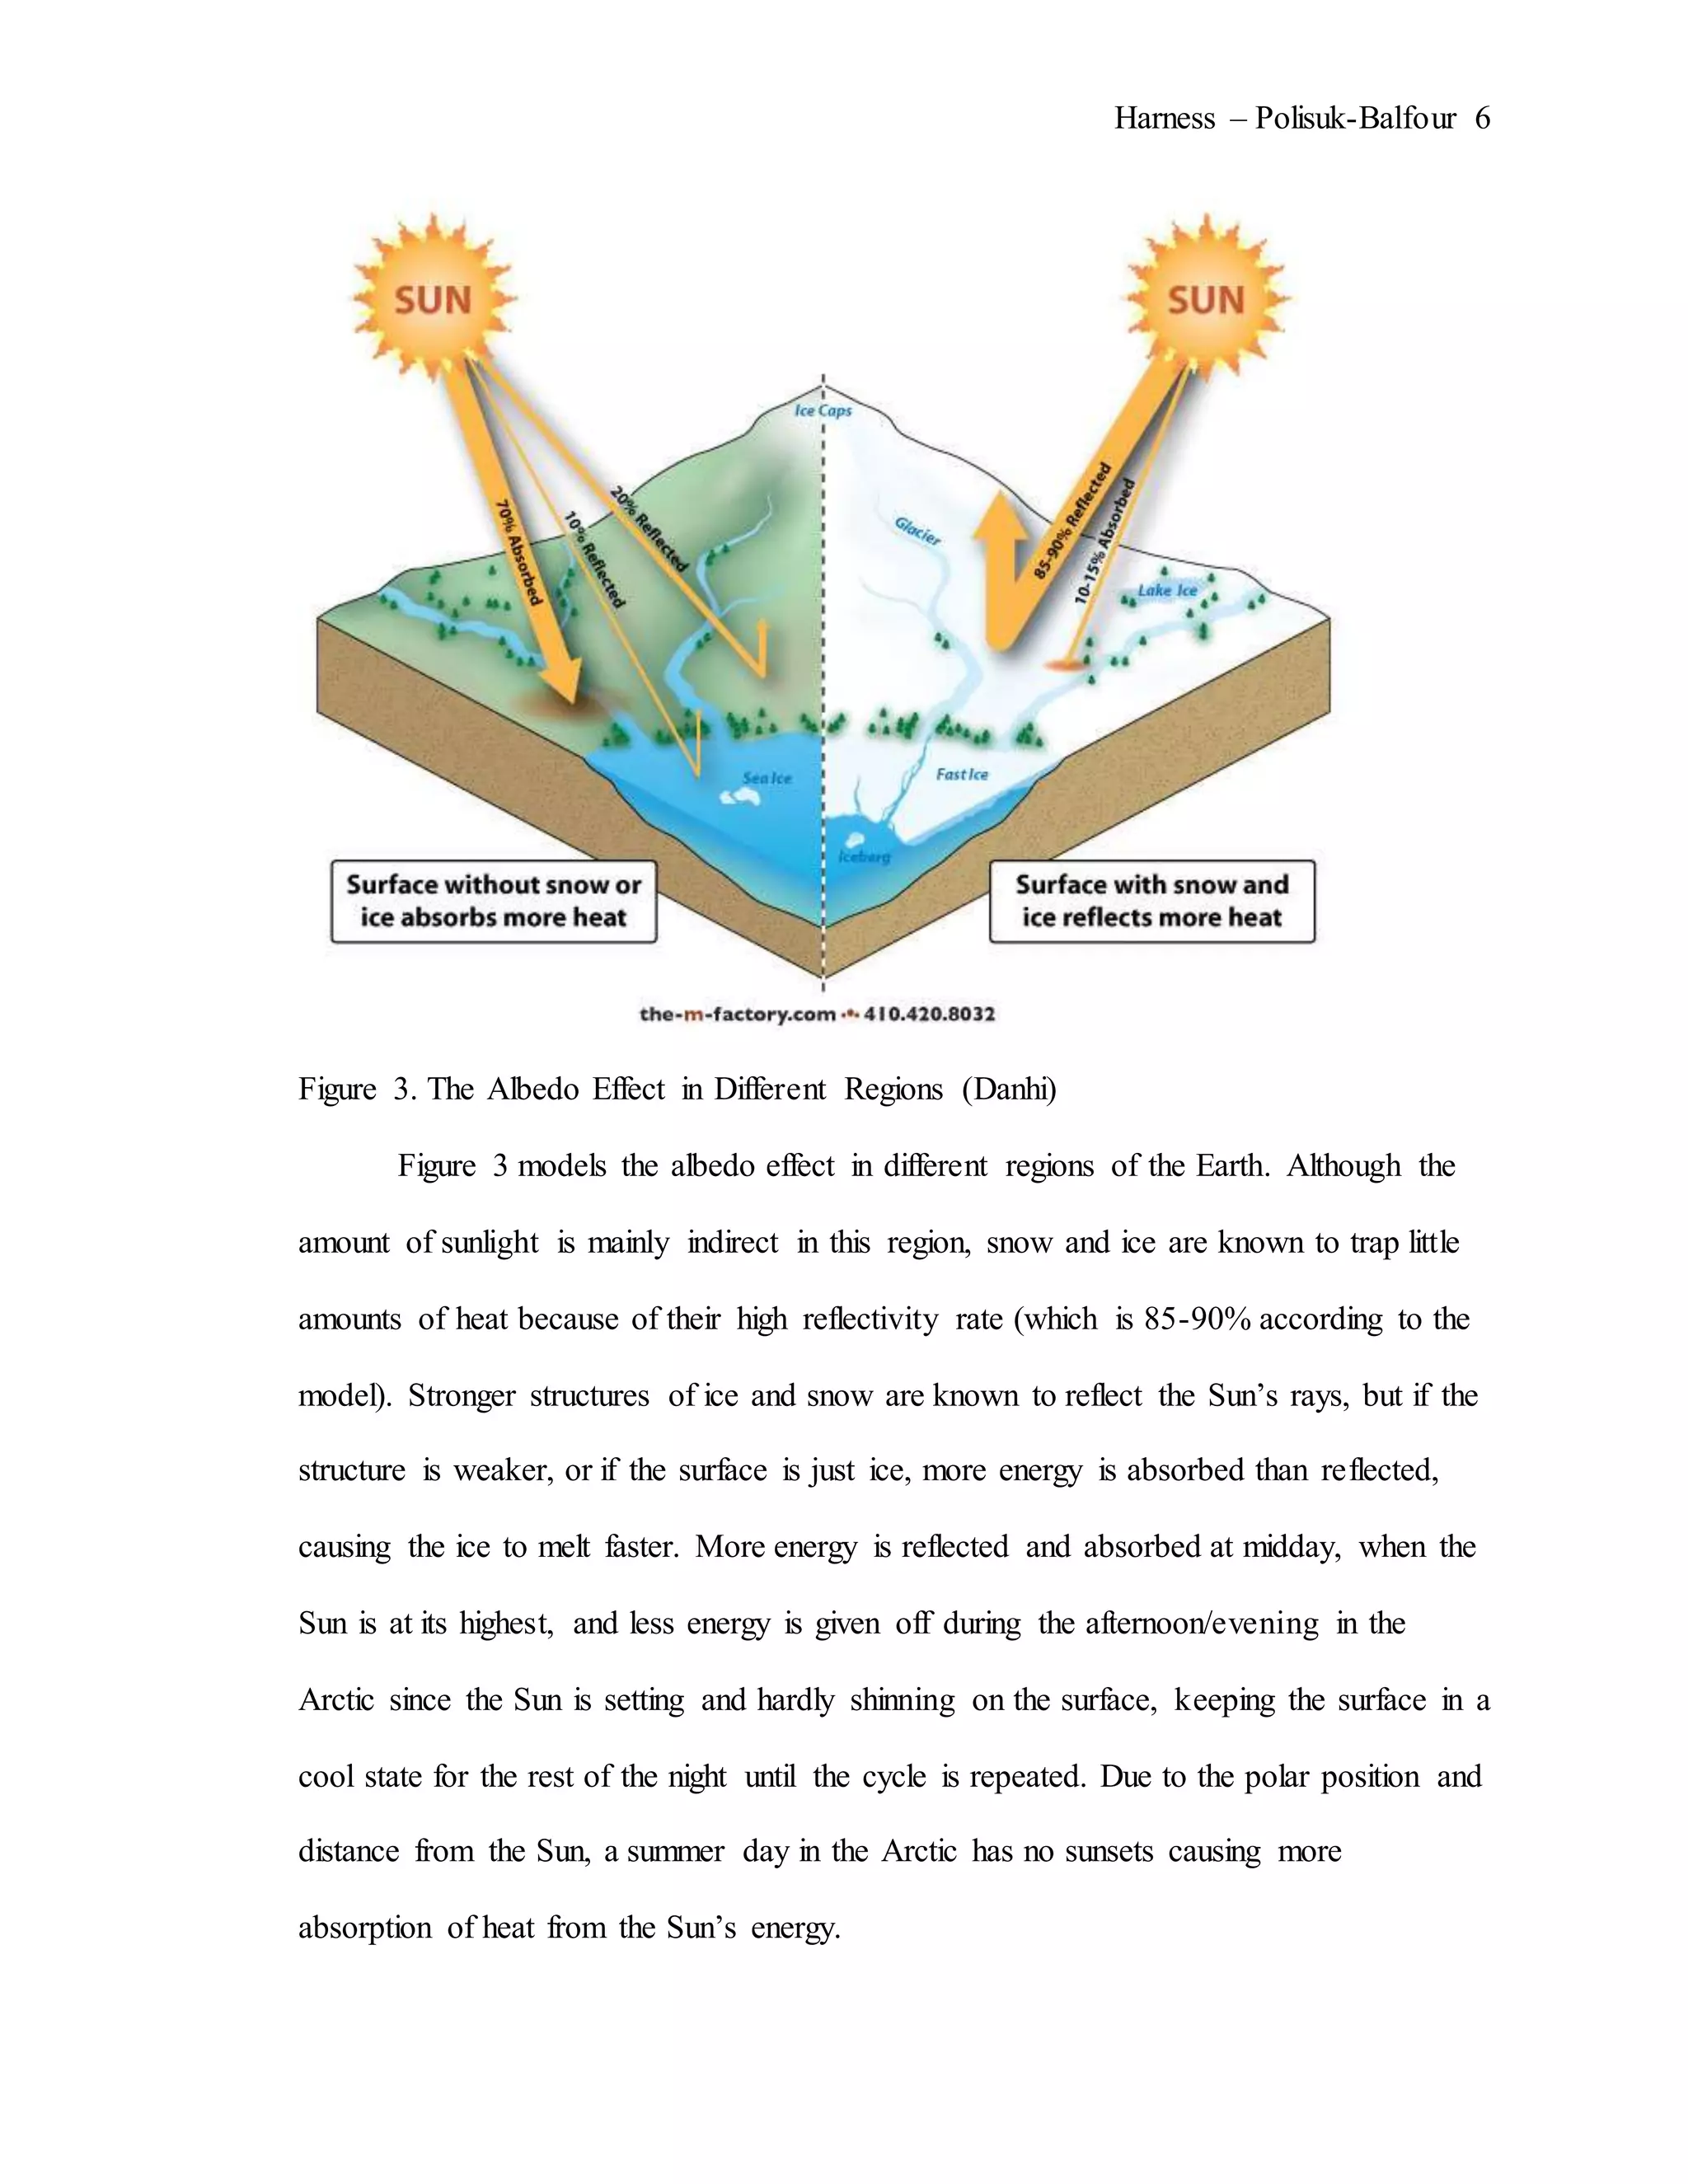
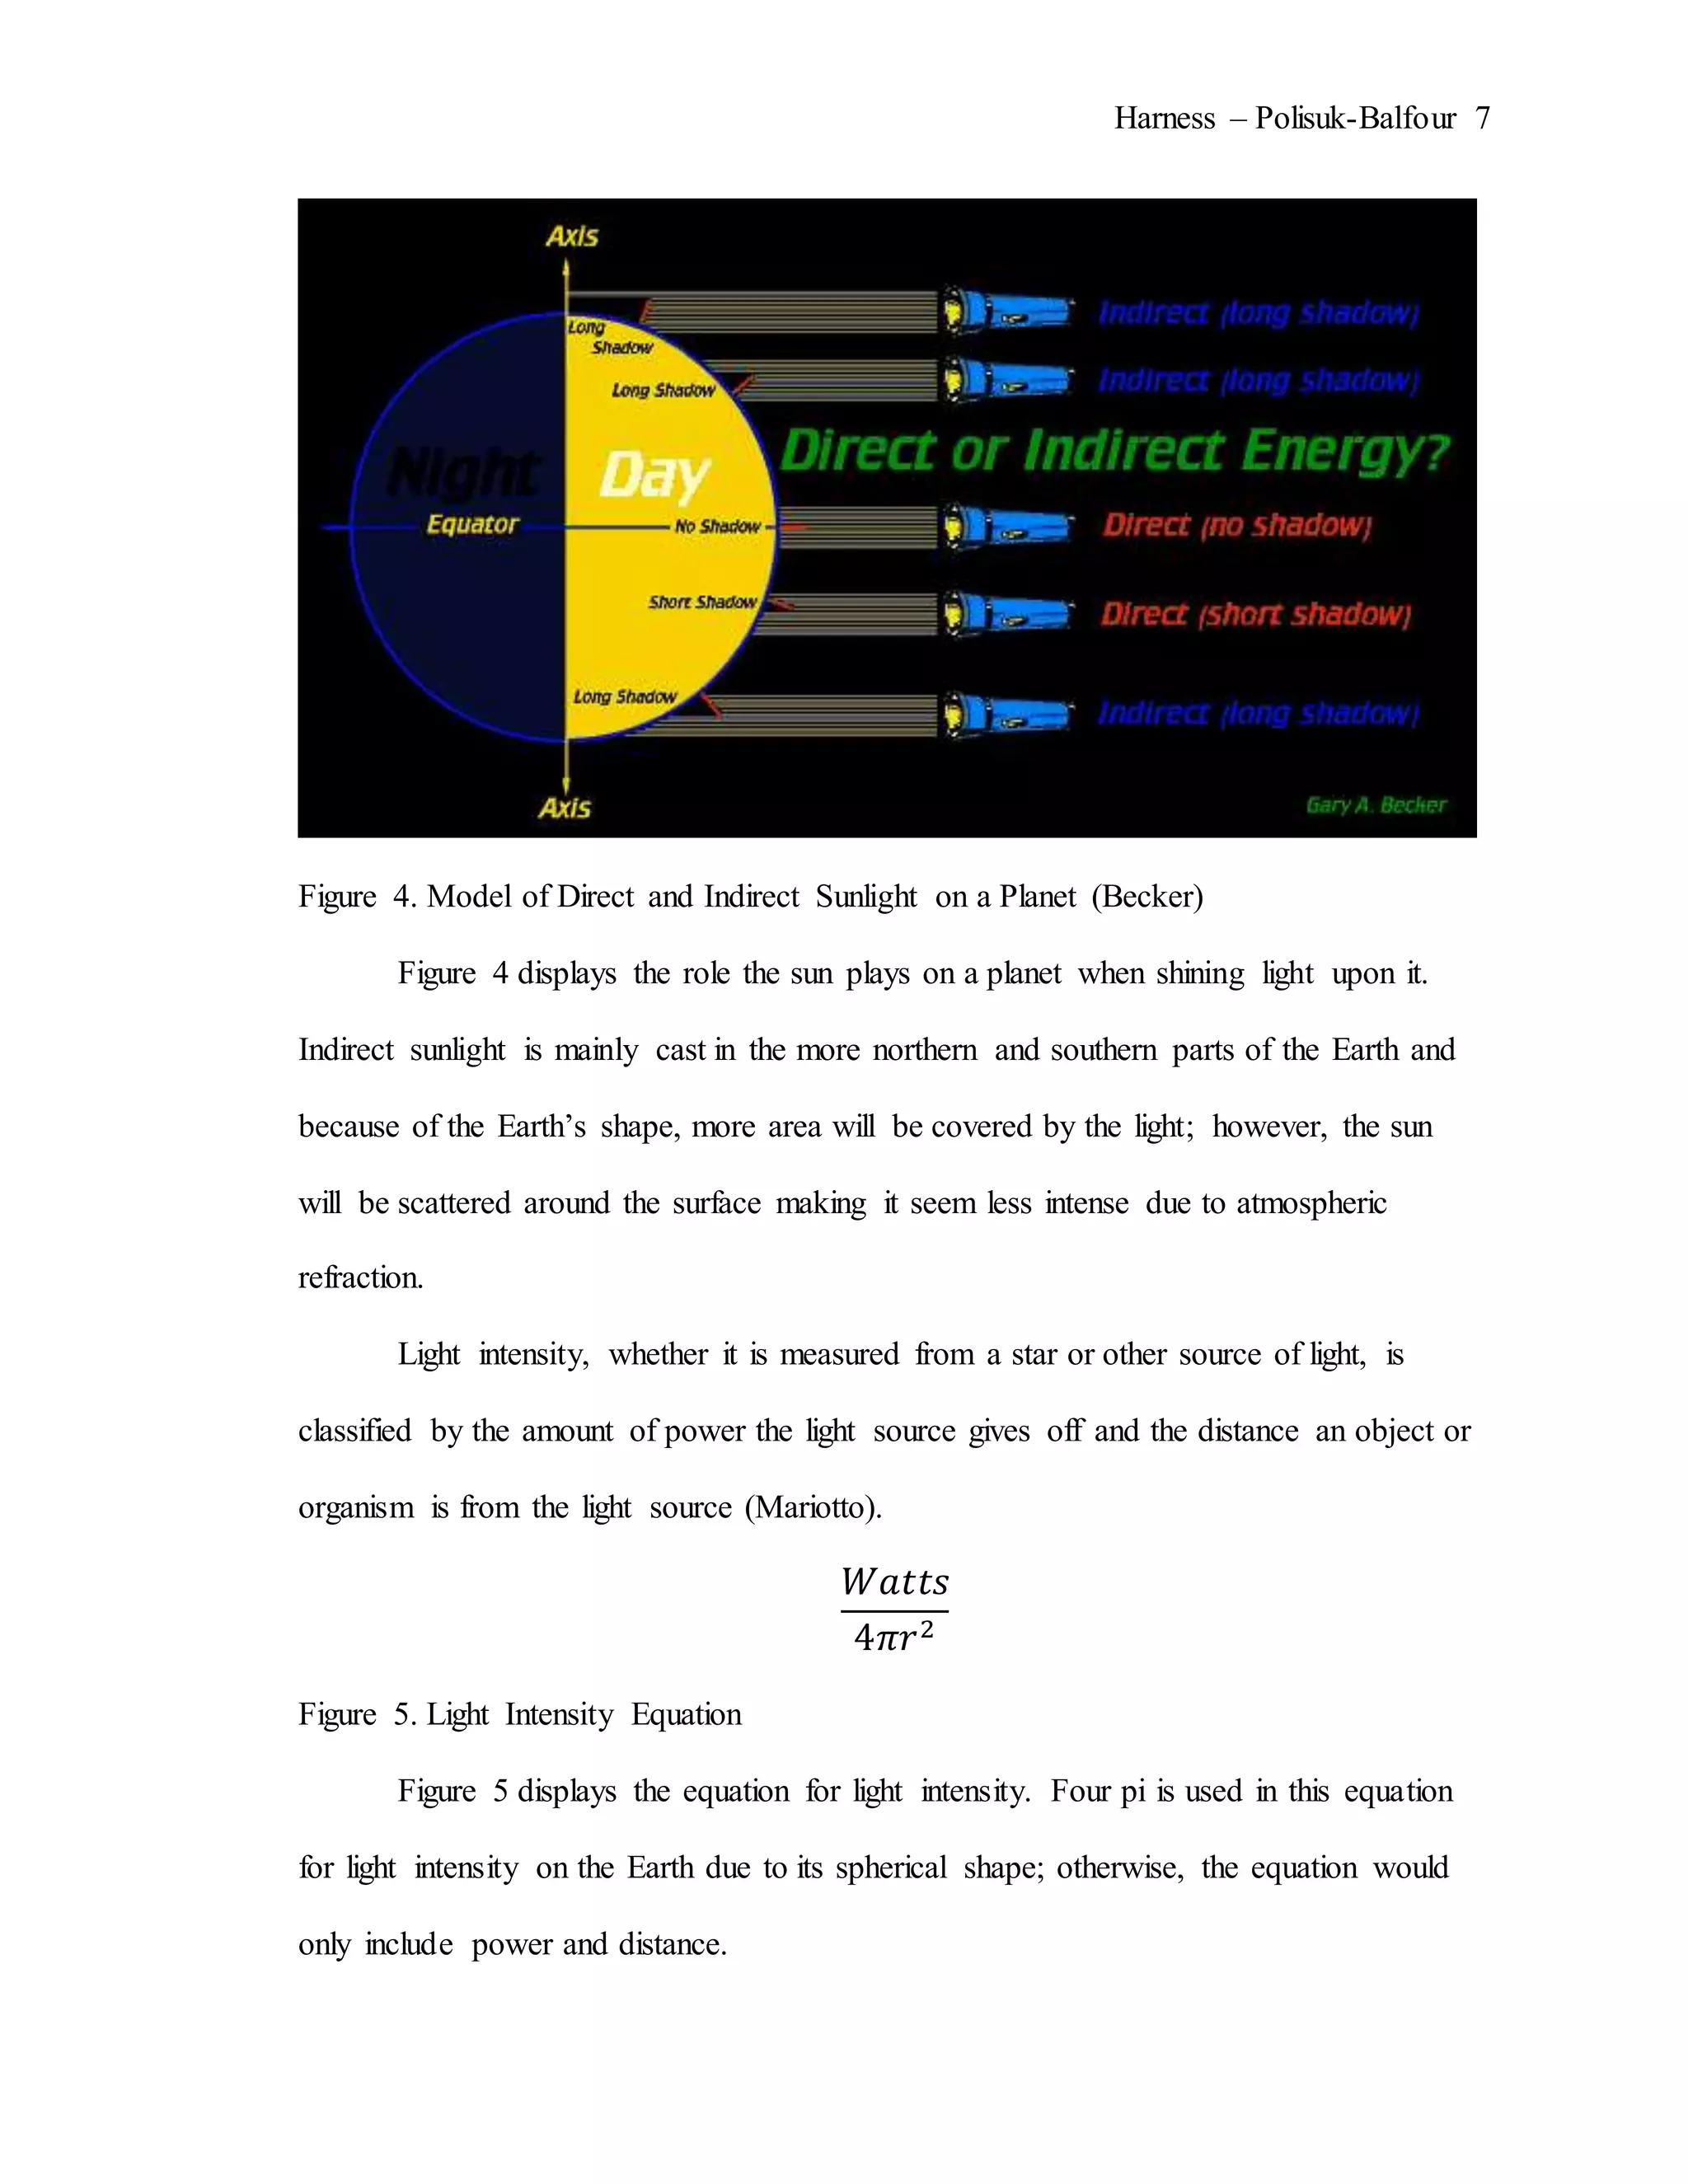
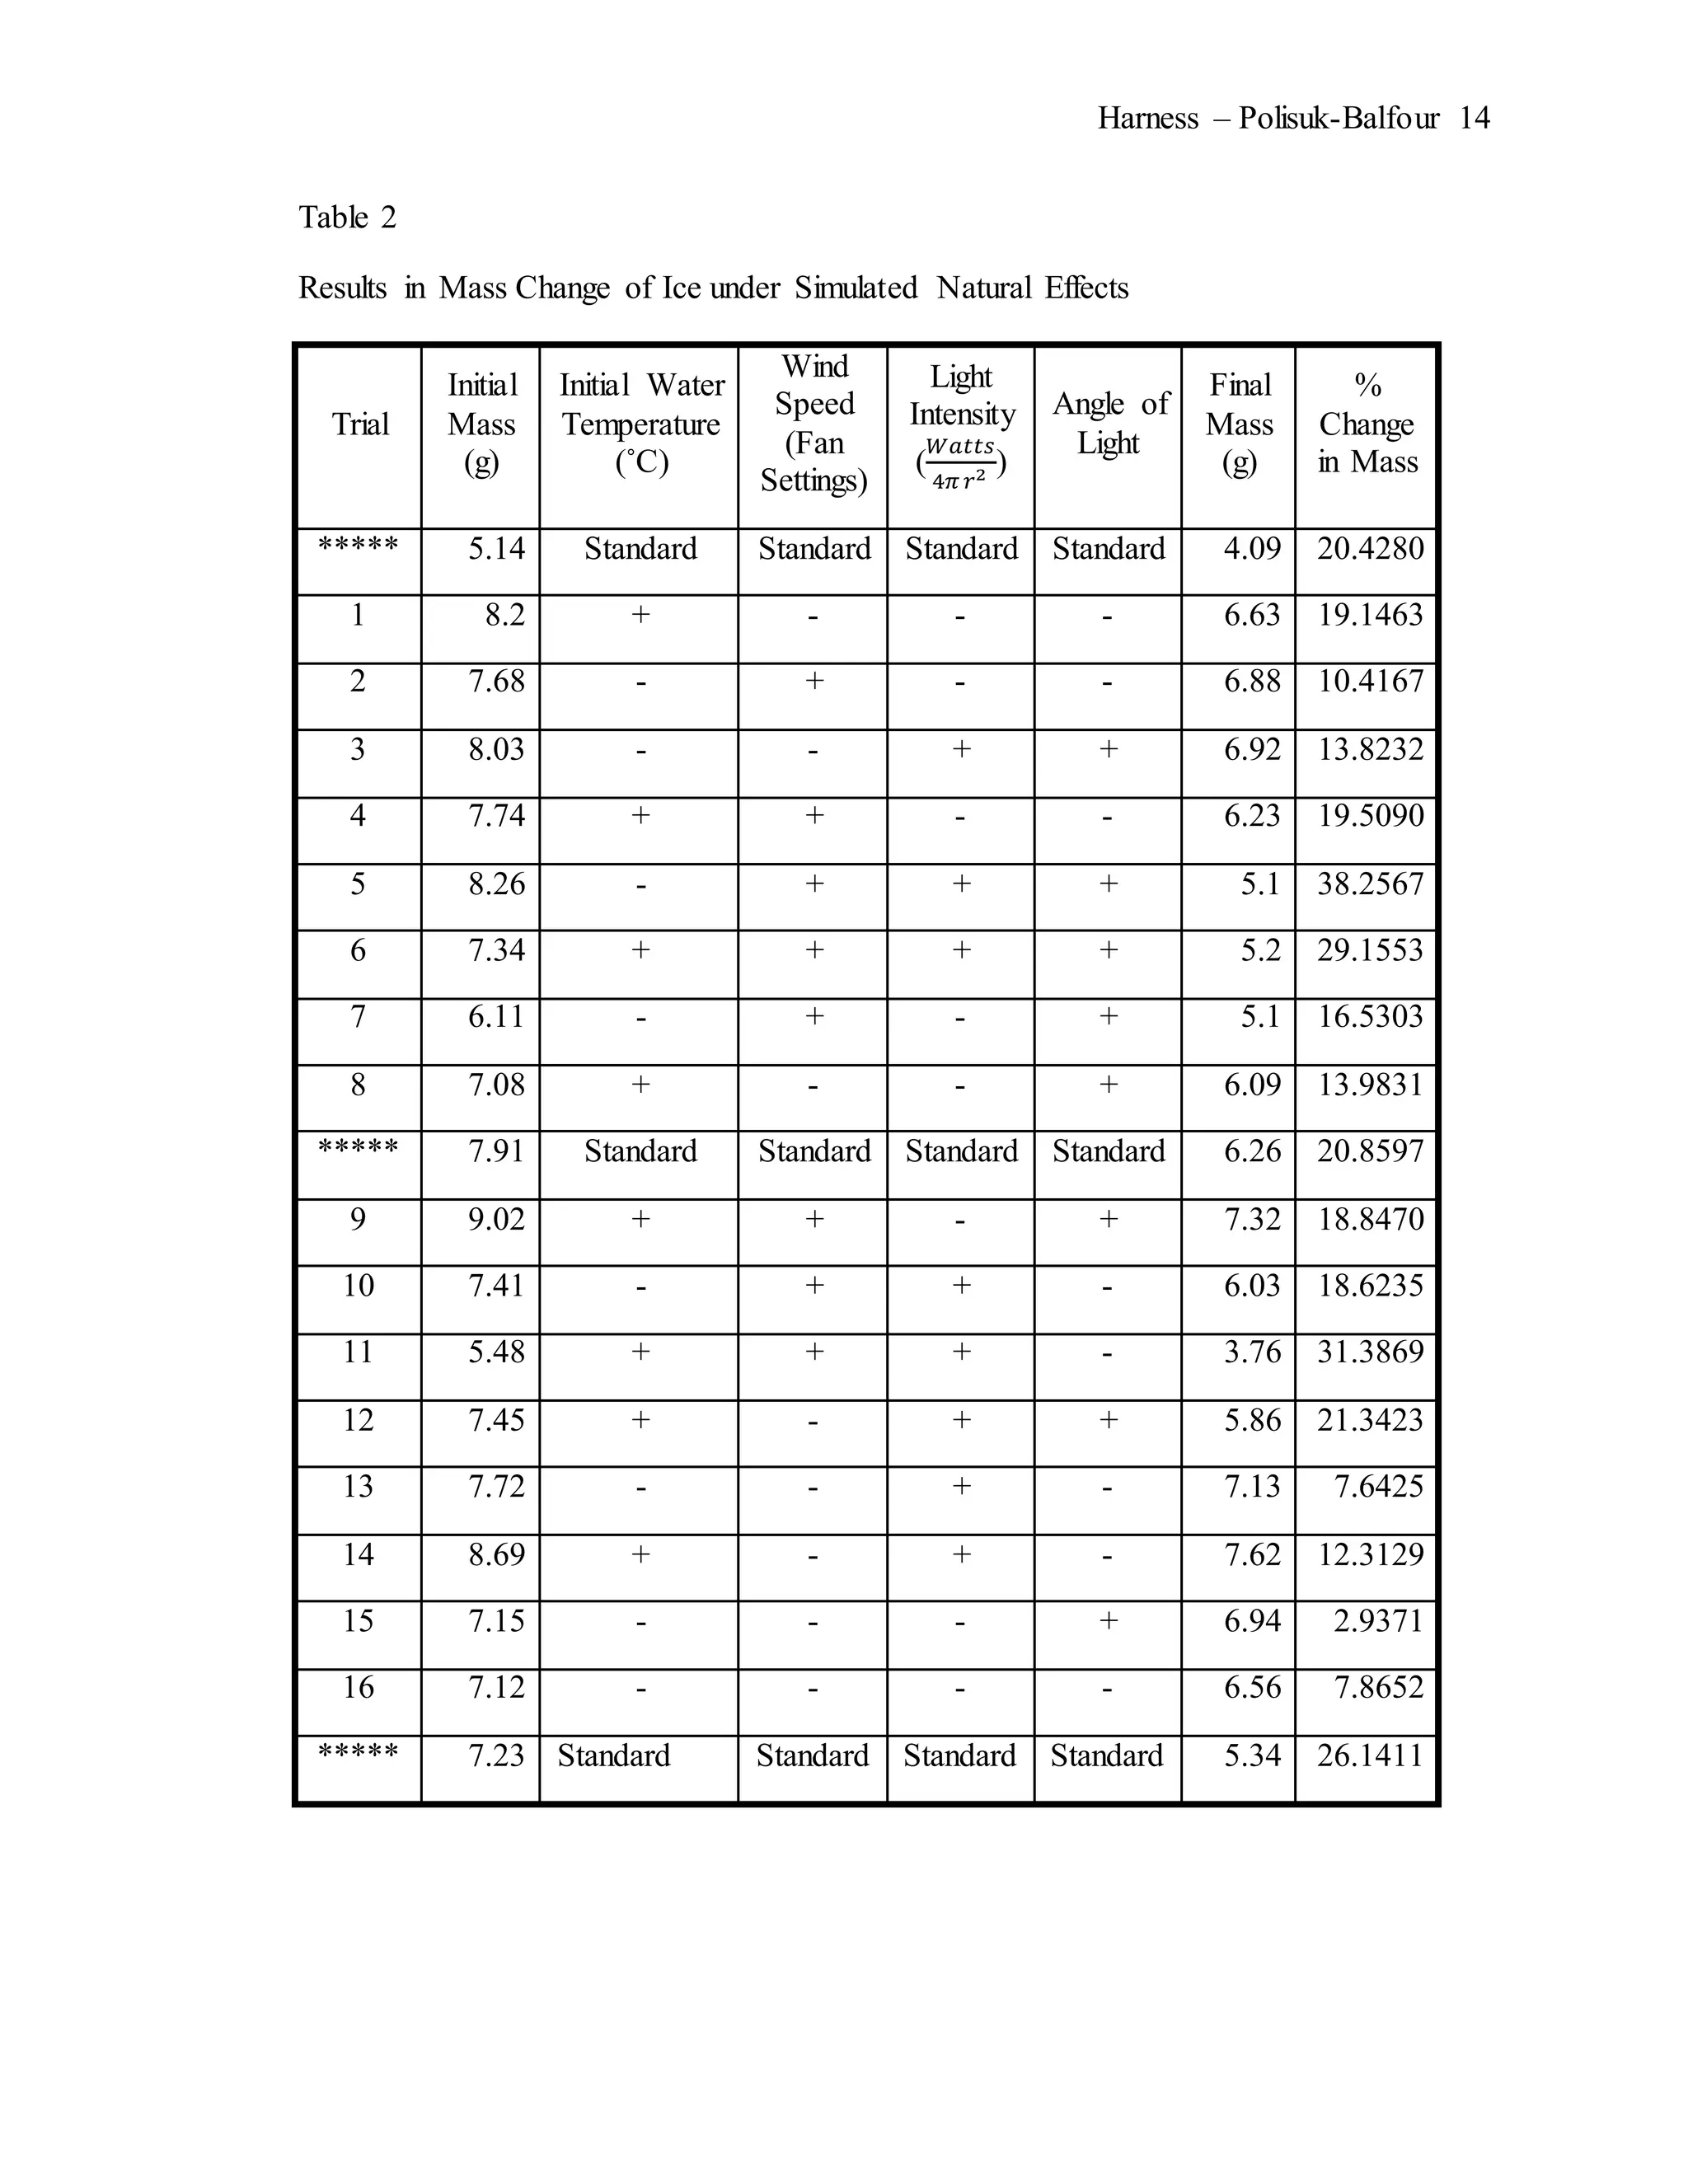
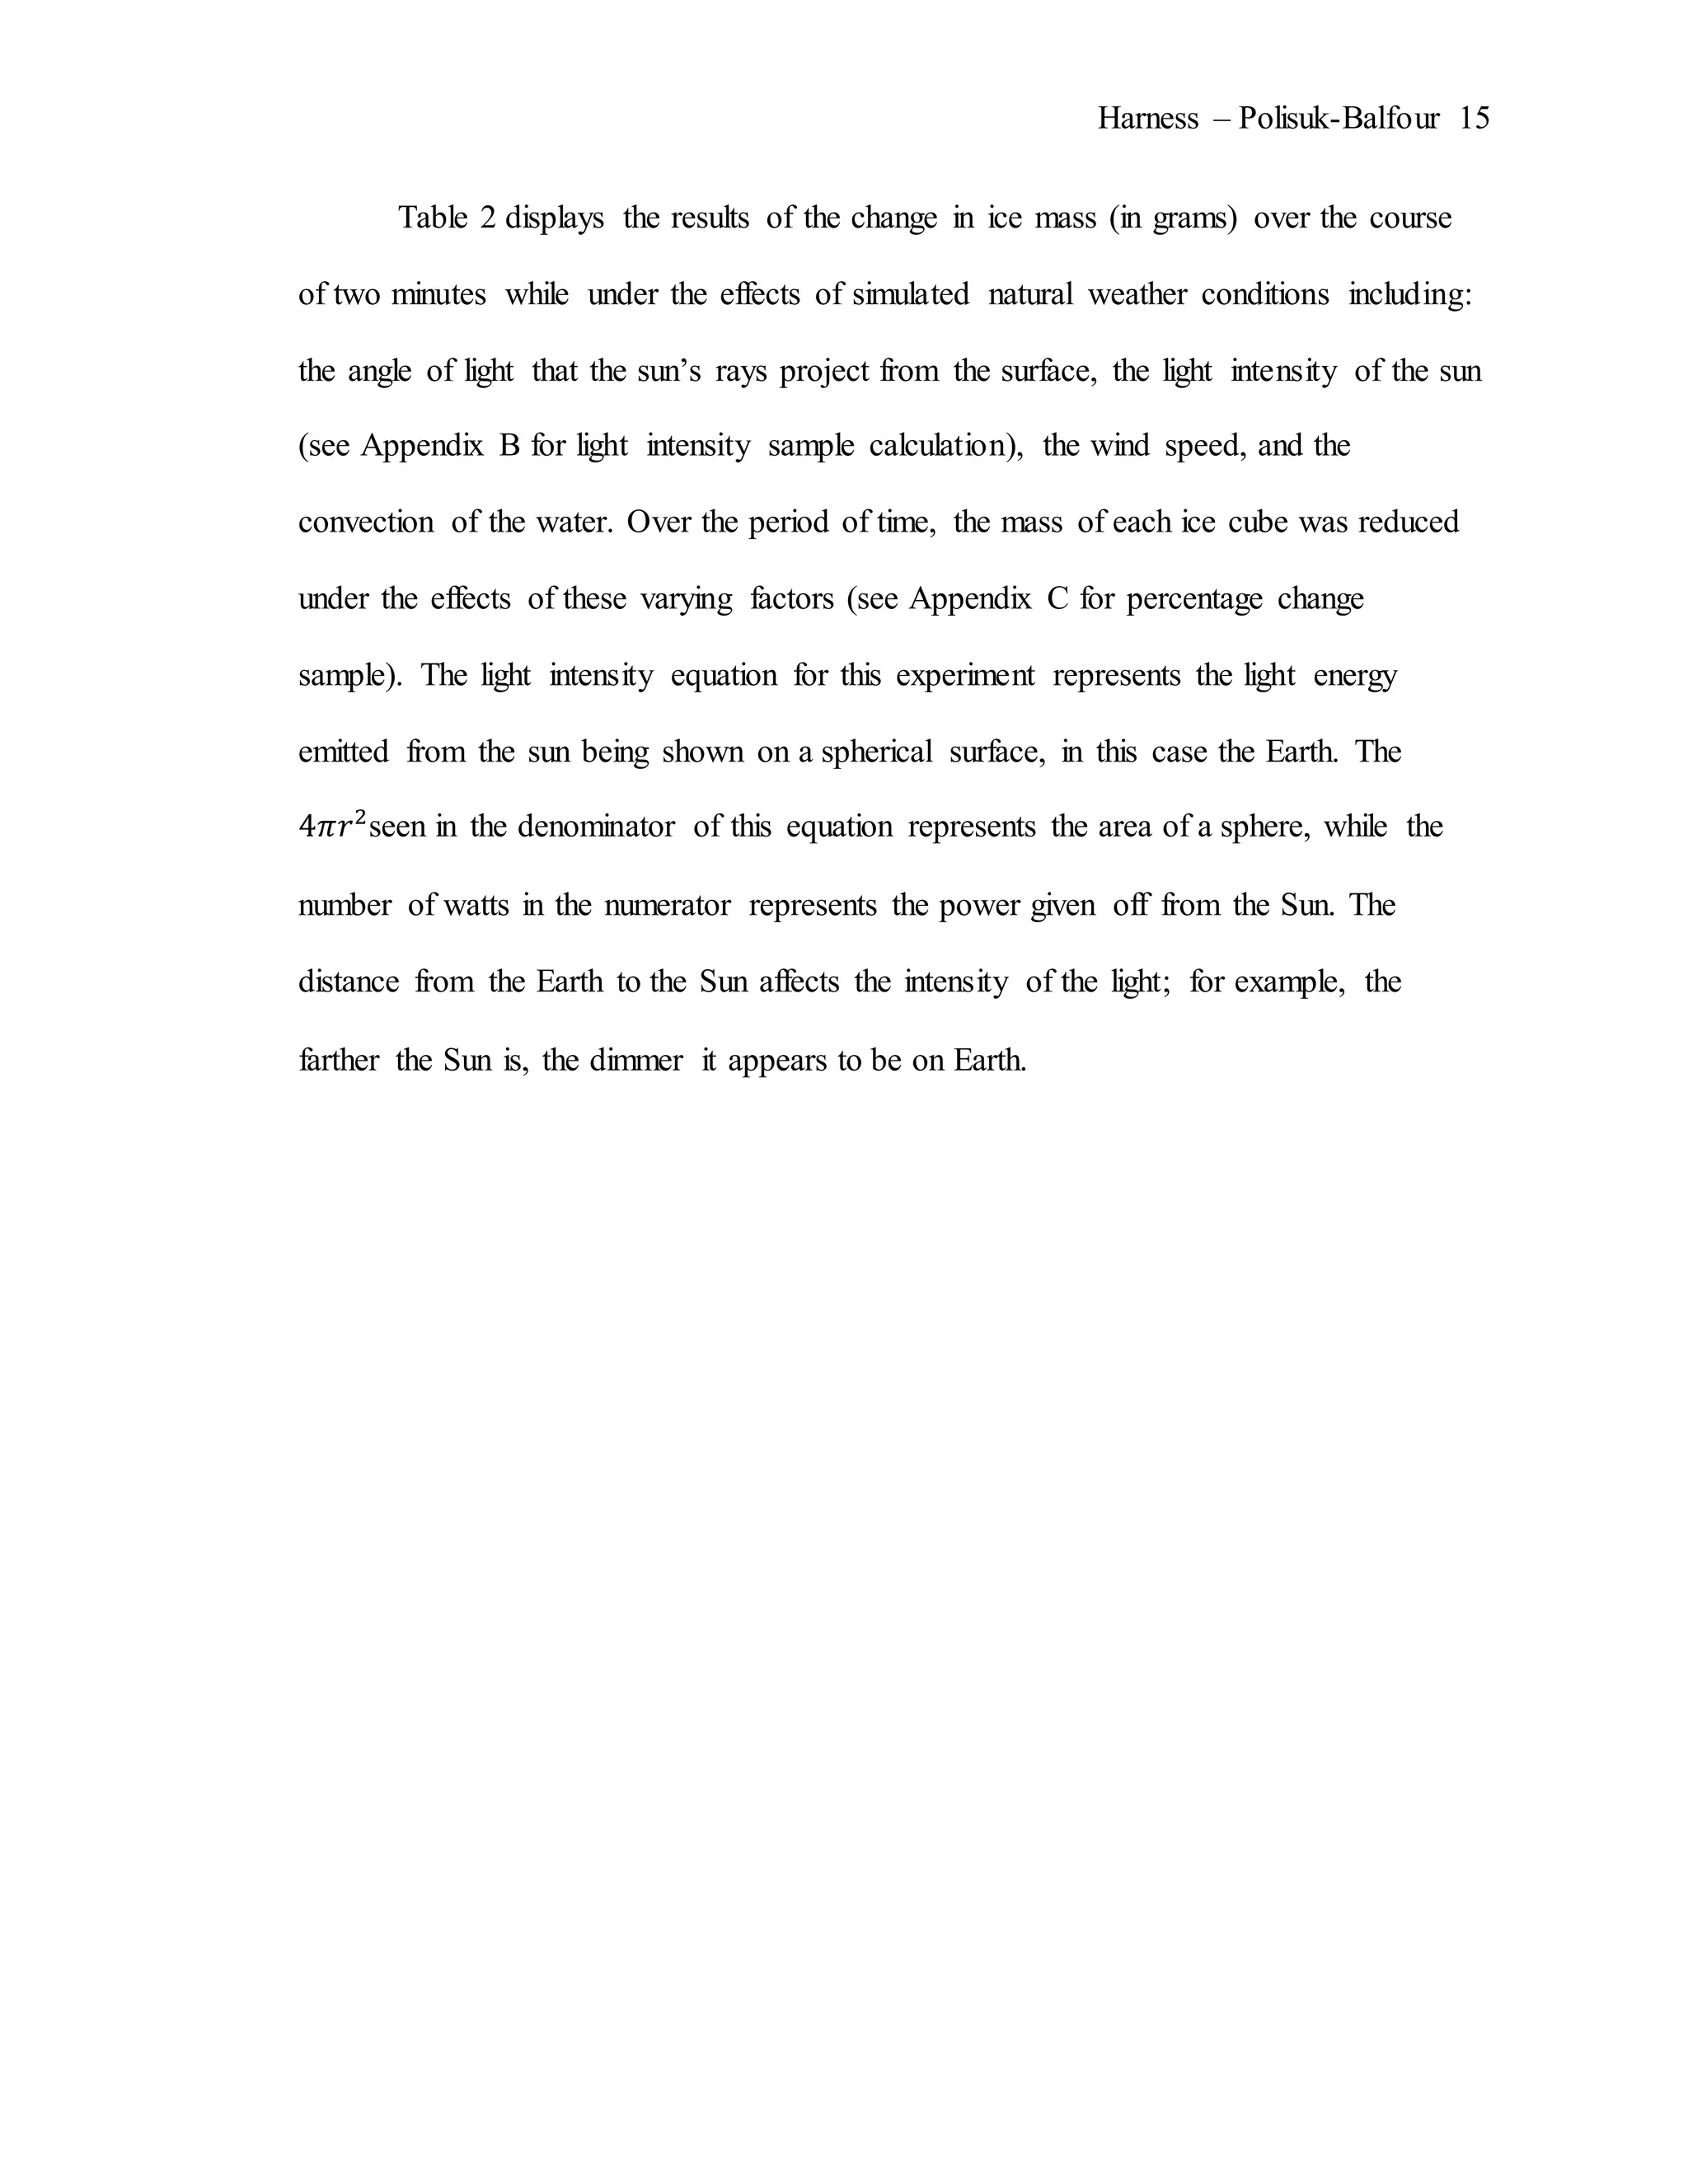
The document describes an experiment that simulated conditions in the Arctic environment to study how wind speed, water temperature, light angle, and light intensity affect the mass of an ice cube over time. Ice cubes were exposed to different combinations of these four factors for two minutes before measuring the percent change in mass. The results showed that higher water temperatures and more intense exposure to light and wind led to greater ice mass loss, with a maximum change of 38.26%. Lower levels of the factors resulted in less melting, with a minimum change of 2.94%. The goal was to better understand how the Arctic reacts to climate changes like rising temperatures.
- Core 19 is a 3.61m sediment core collected from a 212m deep basin in Lago Sarmiento, Chile. Various measurements were taken from the core including magnetic susceptibility, weight % carbonate, and stable carbon and nitrogen isotope ratios.
- Five zones were identified in the core based on trends in the chemical signals over time. Zone 1 showed fluctuations that could indicate a shift in climate. Zone 2 showed increased precipitation and decreased productivity. Zone 3 was the opposite with decreased precipitation and increased productivity.
- Three tephra layers were identified that aided in developing an age model for the core. The results provide clues about past climate conditions in Southern Patagonia and implications for climate change, health,
The document provides an introduction to climatology and discusses various global and local climate factors. It defines climate as the integration of weather conditions over time for a particular region, distinguishing it from weather which refers to short term atmospheric conditions. Key factors that influence climate are discussed including solar radiation, tilt of the Earth's axis, wind patterns, topography, and precipitation. Different climate zones and the climate of India are also summarized.
This document provides information about climatology and the key concepts within it. It defines weather as the short-term atmospheric conditions over an area, while climate describes conditions over a long period of time (many years). It describes the layers of the atmosphere including the troposphere, stratosphere, mesosphere, and thermosphere. It also discusses atmospheric composition, temperature, pressure, and the processes involved in energy transfer within the atmosphere.
The document provides an overview of climatology and global climatic factors. It discusses five main climate types - tropical, dry, temperate, continental, and polar. Key global climatic factors that influence climate are also summarized, including solar radiation quality and quantity, the tilt of the Earth's axis, radiation at the Earth's surface, the Earth's thermal balance, winds driven by thermal forces like trade winds and the coriolis effect, mid-latitude westerlies, polar winds, annual wind shifts, and the influence of topography. Climate is defined as averaged weather over 30 years, while weather reflects short-term atmospheric conditions.
This document discusses the history and concepts of climatology and meteorology. It provides definitions of climate from various scholars as the composite of weather over a long period of time, including variations and extremes. Meteorology is defined as the study of weather and atmospheric conditions. The document also outlines the key elements of climate, factors influencing climate distribution, and subdivisions of climatology including physical, regional, and applied climatology.
This document provides definitions of weather and climate, noting that weather is atmospheric conditions at a given time while climate refers to long-term averages and statistics. It discusses climate variability, which refers to fluctuations around the mean temperature, and climate change, which is a long-term trend responding to a forcing factor. Positive feedback loops can cause dramatic climate change through self-reinforcing effects, while negative feedback acts to stabilize the climate system. The greenhouse effect naturally regulates Earth's temperature, but human emissions of greenhouse gases are enhancing this effect and raising global temperatures beyond natural variability. There is still uncertainty around how exactly the climate system will respond to increased CO2 levels.
The document discusses several factors that can cause changes in Earth's climate, including variations in the Earth's orbit, atmospheric carbon dioxide levels, volcanic eruptions, and variations in solar output. Large volcanic eruptions that eject sulfur dioxide into the stratosphere can have a short-term cooling effect on global temperatures by reflecting sunlight back to space for up to three years. Rising carbon dioxide levels due to human activities like burning fossil fuels are enhancing the greenhouse effect and leading to increased global warming. Variations in the Earth's orbit, known as the Milankovitch cycles, may have contributed to past climate changes by altering the amount of solar radiation received by different regions over long time periods.
This document summarizes key concepts about solar and terrestrial radiation, including:
- Solar radiation is energy from the sun, while terrestrial radiation is energy reflected back from Earth.
- Radiation can be direct, diffuse after scattering, or reflected. Some is absorbed by the atmosphere or Earth's surface.
- The reflectivity of surfaces like snow, sand, forests and grasslands affects how much radiation is reflected.
- Daily temperature cycles are driven by variations in net radiation from changes in solar insolation over 24 hours.
The document discusses several topics related to climate change, including natural climate oscillations, urban heat islands, land use changes, temperature proxy records, and measurements of land and ocean temperatures. It questions the reliability of some temperature proxy records and surface temperature measurements, and argues that climate models likely overestimate the warming effects of increased CO2 levels.
This document discusses weather, climate, and how they are measured. It defines weather as the day-to-day conditions of a place, driven by differences in air pressure, temperature and moisture. Climate is defined as the average weather conditions over many years, usually 30, and is influenced by location. The key elements that make up weather and climate are discussed as temperature, pressure, wind, humidity and precipitation. Weather stations use instruments like hygrometers, rain gauges, barometers and maximum/minimum thermometers to measure these elements.
This document summarizes concepts related to insolation and temperature on Earth's landscape. It discusses how temperature affects living and nonliving things, the forms of energy from the sun, and the processes by which heat is transferred within the atmosphere and oceans. These include radiation, conduction, convection, and the greenhouse effect. It also addresses global patterns in temperature, factors influencing these patterns like latitude and land-water distribution, and concerns about rising global temperatures due to increased carbon dioxide in the atmosphere.
- The document discusses global climate change and provides evidence that rising greenhouse gas levels are causing the planet to warm. It examines feedback mechanisms in the climate system like the albedo effect and carbon cycle. Images show retreating glaciers and rising temperatures. The impacts of a warming planet could include extreme weather, sea level rise, and shifting biomes. Past climate records from ice cores provide context on the rate of current changes.
Site of asteroid impact changed the history of life on Earth: the low probabi...Sérgio Sacani
Sixty-six million years ago, an asteroid approximately 9km in diameter hit the hydrocarbon- and
sulfur-rich sedimentary rocks in what is now Mexico. Recent studies have shown that this impact at
the Yucatan Peninsula heated the hydrocarbon and sulfur in these rocks, forming stratospheric soot
and sulfate aerosols and causing extreme global cooling and drought. These events triggered a mass
extinction, including dinosaurs, and led to the subsequent macroevolution of mammals. The amount
of hydrocarbon and sulfur in rocks varies widely, depending on location, which suggests that cooling
and extinction levels were dependent on impact site. Here we show that the probability of signifcant
global cooling, mass extinction, and the subsequent appearance of mammals was quite low after an
asteroid impact on the Earth’s surface. This signifcant event could have occurred if the asteroid hit the
hydrocarbon-rich areas occupying approximately 13% of the Earth’s surface. The site of asteroid impact,
therefore, changed the history of life on Earth.
Overview of gedongsongo manifestations of the ungaran geothermal prospect,oilandgas24
The document summarizes a study of surface manifestations at the Gedongsongo area of the Ungaran geothermal prospect in Central Java, Indonesia. Temperature measurements of the manifestations ranged from 72-870C. Chemical analysis and stable isotope ratios showed the western part has more magmatic water influence than the eastern part. The distribution and types of active and relic manifestations suggest they are controlled by a collapse structure or normal fault that allows convective heat transfer.
This document discusses the history and concepts of climatology. It notes that the scientific study of climate began with early Greek philosophers observing factors like solar inclination and climatic zones. Modern climatology involves the study of observable climate elements like temperature, precipitation, and winds, and how their interactions and transfers of energy and mass result in different climate types worldwide. The document also outlines the subfields of climatology including physical, regional, and applied climatology.
The document discusses evidence that climate change has occurred in the past due to non-anthropogenic or natural causes. It provides examples from geology of past periods of glaciation and warming from factors like variations in the Earth's orbit and volcanic eruptions. While acknowledging natural climate variability, it also notes that the current pace of warming seems to be increasing due to human activity like greenhouse gas emissions. The document concludes by arguing for a comprehensive strategy to mitigate risks from climate change through renewable energy, international agreements, carbon markets and efficiency improvements.
This lecture discusses the basics of climate change including:
1) The key factors that influence Earth's climate system and how human activity has impacted atmospheric composition and global warming.
2) Methods used by climate scientists to study past and present climate trends through direct observation and proxy indicators.
3) The potential future impacts of climate change and ways to respond to rising temperatures and other changes.
Paleoclimatology is the detailed study of past climates. Scientists use proxy records stored in ice cores, tree rings, coral reefs, ocean sediments, and caves to predict past climates. Ice cores contain annual layers and trapped air bubbles that can be tested to learn about ancient temperatures, greenhouse gas levels, volcanic eruptions, and precipitation over thousands of years. Tree rings, coral growth patterns, pollen samples, and cave formations also provide clues about climatic conditions from the distant past. Understanding these natural archives is crucial for placing current climate change in a long-term context.
This document provides an overview of environmental control systems and climate components. It defines climate as average weather over a long period of time, determined by natural and human factors. Key natural elements that influence climate are described as the atmosphere, geosphere, hydrosphere and biosphere, while human land and resource uses also impact climate. Specific climate factors discussed include latitude, seasons, altitude, water effects, and atmospheric circulation. Different climate regions across the world are also outlined.
The document discusses the Little Ice Age (LIA), a period of cooling between the 14th-19th centuries. It examines potential causes like changes in solar activity, volcanic eruptions, and variations in ocean/atmospheric circulation patterns. Evidence from regions outside Europe is also presented, showing glacial advances in the Andes and Tibetan Plateau during the proposed LIA timeframe, though dates varied. While no single cause can explain the heterogeneous global cooling, orbital forcing, solar variability, volcanism, and internal climate variations likely all contributed to climate conditions during this period.
The document discusses the El Niño Southern Oscillation (ENSO) phenomenon as a key part of Earth's climate system. ENSO involves fluctuations between warm (El Niño) and cold (La Niña) conditions in the tropical Pacific Ocean and atmosphere. It occurs naturally every 2-7 years and shapes weather patterns globally. The document outlines the dynamics and physics behind ENSO cycles, their predictability, impacts on climate and ecosystems, and importance for understanding Earth's complex climate.
Weather describes atmospheric conditions over short periods of time, measured by factors like temperature, precipitation, and wind. Climate describes average weather conditions over longer periods, usually 30 years. Climate models use scientific understanding to simulate a region's climate and generate predictions by accounting for physical laws, geography, atmospheric composition, and other factors like planetary properties. Models aim to predict past and future climate behavior by exploring the impacts of changes like altered ice reflectivity, orbital distance, or greenhouse gas levels.
COUNTER-INTUITY OF COMPLEX SYSTEMS: WEATHER VS. CLIMATEPaul H. Carr
Short-term weather fluctuations should not blind us from what long -term climate trends are telling us. Other unexpected aspects of complex system dynamics are the Butterfly Effect and the descendent benefit of epidemics.
The document discusses various proxy data sources that can be used to study past climate, including ocean and lake sediments, ice cores, tree rings, coral, and fossil records. This proxy data contains information about factors like temperature and atmospheric composition over thousands to millions of years ago. The document then examines potential natural causes of past climate change like solar and cosmic activity, volcanic eruptions, and continental drift, finding that these factors likely had small or negligible effects on global temperature changes. Therefore, increasing levels of greenhouse gases like CO2 remain the most plausible explanation for current global warming.
The document discusses various factors that influence air temperature, including solar radiation, greenhouse gases, conduction, convection, and latitude. It explains that air temperature results from complex interactions between these factors, such as different surfaces absorbing radiation differently, greenhouse gases trapping outgoing radiation, and rising air cooling through expansion.
Melting Ice: Context, Causes, and Consequences of Polar AmplificationZachary Labe
Profound changes are ongoing at the ends of our planet. Thawing permafrost buried in ancient soils, melting lake and river ice-cover, thinning sea ice, and dwindling mountain glaciers are just a few indicators of climate change within the Arctic. Further, billions of tons of ice are now lost per year from the Greenland Ice Sheet, leaving our coastlines increasingly vulnerable to sea level rise. ‘Polar amplification’ refers to enhanced climate changes in the high latitudes compared to the rest of the globe in response to an external forcing. In the Arctic, air temperatures are rising at more than twice the rate of the global average. While changes in the Antarctic have been slower than the Arctic, the Antarctic ice sheets store enough freshwater to increase global sea levels by 58 m. Thus, Antarctica is often considered our sleeping giant.
Despite robust evidence of polar amplification in the past and present-day, the largest spread in future climate model projections is found in the Arctic and Antarctic. Moreover, quantifying the positive feedbacks contributing to polar amplification remains quite challenging. These large uncertainties are critical for understanding the impacts of future changes to ocean biogeochemistry and circulation, global sea level rise, and mid-latitude climate extremes and variability. This talk will provide an overview of polar amplification using present-day observational evidence and climate models simulations through the late 21st century. In particular, how do we separate the signal and noise in polar climate change and make evidence-based predictions in a warming world?
This document provides instructions for installing and using the MG3500 SDK. It describes downloading and installing the SDK, creating boot images for the board using xmodem and NAND, running the images on the board, and connecting various components like the I2C controller. The document also outlines the MG3500 documentation set that supports the SDK.
Candace Reedy is seeking an accounting position with potential for advancement. She has over 15 years of experience in accounting, office management, and administrative roles. Her experience includes accounts payable, accounts receivable, payroll, financial reporting, and use of accounting software like QuickBooks, Excel, and SAP. She has a bachelor's degree in psychology and an MBA in finance.
The author is a feminist activist from Boston who has written about women's soccer in the past. She found an article questioning why female soccer players do not receive equal pay. The article was written by Zach Zill and published in Jacobin magazine, which takes a socialist perspective. Zill's viewpoint is similar to the author's in that he criticizes FIFA over the economic aspects of revenue generated from women players, but not paid to them. It is unclear whether Zill is more interested in increasing women's pay or attacking FIFA.
A list of USB flash drives shows Kingston drives with 64GB for $360, 32GB for $180, and 8GB for $110. Another brand, Silicon Power, offers an 8GB drive for a lower price of $80.
Dokumen tersebut membahas definisi dan tujuan koperasi menurut beberapa undang-undang yang berbeda di Indonesia. Definisi koperasi mencakup perkumpulan orang atau badan hukum tanpa konsentrasi modal, organisasi ekonomi rakyat bersifat sosial, dan badan hukum yang didirikan oleh anggota untuk memenuhi kebutuhan ekonomi, sosial, dan budaya. Tujuan koperasi secara umum adalah meningkatkan kesejahteraan
The document discusses the benefits of exercise for mental health. Regular physical activity can help reduce anxiety and depression and improve mood and cognitive functioning. Exercise boosts blood flow, releases endorphins, and promotes changes in the brain which help enhance one's emotional well-being and mental clarity.
This document discusses the impact of the Affordable Care Act on rehabilitation service providers. It provides background on the goals of the ACA to expand health insurance coverage and hold insurers accountable. The ACA is expected to increase demand for rehabilitation services like physical therapy and occupational therapy. However, continued declines in reimbursement rates and increased documentation demands may challenge rehabilitation providers' ability to meet this higher demand. The long-term consequences of these changes on autonomous evidence-based practice are unclear.
Performance Audit of Deviantart.com by PerfAuditPerfAudit
#PerfAudit, Performance Audit of DeviantArt, issues related to networking and rendering performance of DeviantArt are discussed along with their solutions.
This document describes a Click Data Analytics platform that provides insights on millions of user clicks by analyzing trends related to location, device, user agent, and referrals. It processes a stream of URL click data to generate real-time trending links and static graphs showing operating system usage and geo-location links over time. The processed data is stored in Cassandra using a composite primary key to allow querying by multiple key columns in a specific order.
130621 URGENT Articulating Paula Deen's Context , Addressing a Defense for O...."Crista" B.M.
This lengthy document discusses issues of race, culture, and interpersonal dynamics between various ethnic groups in the United States. It describes several personal anecdotes and interactions the author has had with individuals of different backgrounds, often involving perceived envy, competition, or strategic alliances along racial lines. The overall message conveyed is that dishonesty, strife, and struggles for power, money and respect can exist within all cultural and ethnic groups.
The 4th ESO class went on a trip to Ermita del Remei to collect lavender, rosemary, rock tea, and thyme plants and plant oregano, rosemary, and lavender in the school's organic garden. They left school at 9 AM, made stops at a gas station and Santet, and arrived at Ermita del Remei where they had breakfast and started planting between 12:15-1 PM before tutoring until 2:15 PM and returning to school by 2:45 PM.
CompTIA exam study guide presentations by instructor Brian Ferrill, PACE-IT (Progressive, Accelerated Certifications for Employment in Information Technology)
"Funded by the Department of Labor, Employment and Training Administration, Grant #TC-23745-12-60-A-53"
Learn more about the PACE-IT Online program: www.edcc.edu/pace-it
The document describes a mixed-spectrum supercritical water reactor (MSWR) design. Key points:
1) The MSWR was scaled down from a reference US supercritical water reactor to a power output of around 800 MWth. It uses a mixed spectrum of neutron energies and 8% enriched uranium dioxide fuel.
2) Fuel cycle analysis found 8% enriched UO2 to be the most cost effective fuel choice, corresponding to a three cycle rotation of the fuel assemblies.
3) Thermal-hydraulic analysis determined coolant temperature and pressure drop profiles. Coupling neutronics and thermal hydraulics flattened the axial power distribution due to negative moderator temperature coefficients.
4) Safety analysis
The document proposes a "plant tunnel" innovation to address stormwater issues on Tycho Hedéns väg in Uppsala, Sweden. A plant tunnel would capture and filter stormwater runoff from the road using plants and soil. It would be a three-dimensional ecological system built over the road. Variations include a partially covered design with solar panels instead of a full roof, and segments with windows to allow plant growth while maintaining visibility. The plant tunnel would improve air quality, biodiversity, and the hydrological cycle in a sustainable way. It could be customized with plant signage to educate the public.
El documento describe el origen y evolución de las empresas desde la Revolución Industrial, cuando surgieron como conjuntos de procesos colectivos de producción. Explica que actualmente las empresas tienen funciones más allá de la producción, siendo entes sociales que favorecen el progreso humano. También define conceptos clave como tipos de empresas, clasificaciones, importancia, ingeniería de costos y tipos de tributos que pagan las empresas.
The document discusses the benefits of exercise for mental health. Regular physical activity can help reduce anxiety and depression and improve mood and cognitive functioning. Exercise boosts blood flow and levels of neurotransmitters and endorphins which elevate and stabilize mood.
The document discusses human-caused global warming and how it can be slowed and stopped through practical actions. While some predictions of global warming effects are exaggerated, the evidence is clear that warming is occurring due to increased greenhouse gases from human activities. Studying factors like glacial melting and climate forcing agents shows that global warming can be addressed by reducing emissions to achieve a healthier atmosphere.
Climate is the statistics of weather over long periods of time, while climate change refers to significant long-term shifts in weather patterns. The document discusses several lines of evidence for rapid climate change, including rising global temperatures and CO2 levels from ice core data. It also outlines theories for what causes climate change such as changes in Earth's orbit, the carbon dioxide level in the atmosphere, and variations in solar activity. The impacts of climate change include rising sea levels, stronger extreme weather events, and threatened plant and animal species.
Climate change is a significant and lasting change in the statistical distribution of weather patterns over periods ranging from decades to millions of years. It may be a change in average weather conditions, or in the distribution of weather around the average conditions (i.e., more or fewer extreme weather events). Climate change is caused by factors such as biotic processes, variations in solar radiation received by Earth, plate tectonics, and volcanic eruptions. Certain human activities have also been identified as significant causes of recent climate change, often referred to as "global warming"
Scientists actively work to understand past and future climate by using observations and theoretical models. A climate record — extending deep into the Earth's past — has been assembled, and continues to be built up, based on geological evidence from borehole temperature profiles, cores removed from deep accumulations of ice, floral and faunal records, glacial and periglacial processes, stable-isotope and other analyses of sediment layers, and records of past sea levels. More recent data are provided by the instrumental record. General circulation models, based on the physical sciences, are often used in theoretical approaches to match past climate data, make future projections, and link causes and effects in climate change.
The sun provides the primary source of energy driving ocean currents through heating the surface waters unevenly, with the greatest heating at the equator. Density differences created by variations in temperature and salinity are the main factors influencing ocean circulation patterns. Water properties like temperature, salinity, and density only change at the surface of the ocean and create distinct water masses.
The document discusses how the ocean affects climate through various mechanisms:
1) It regulates global temperature by storing and transporting heat around the globe via currents and influences wind and precipitation patterns.
2) Ocean currents stabilize climate in coastal regions and bring nutrients to marine environments.
3) The ocean cycles gases by absorbing large amounts of carbon dioxide from the atmosphere.
4) Human activities like greenhouse gas emissions and land use changes are altering the climate system.
Climatology is the scientific study of climate and a major branch of meteorology. There are three approaches to climatology: physical, descriptive, and dynamic. Physical climatology seeks to explain climate differences based on physical processes influencing climate. Descriptive climatology orients itself geographically and describes climates regionally without causal explanations. Dynamic climatology relates atmospheric circulation to climate. Climate is influenced by various physical and biological processes in the oceans and atmosphere.
Climatology is the scientific study of climate and a major branch of meteorology. There are three approaches to climatology: physical, descriptive, and dynamic. Physical climatology seeks to explain climate differences based on physical processes. Descriptive climatology orients itself geographically and describes climates regionally without causes. Dynamic climatology relates atmospheric circulation to climate. Climate is influenced by both physical processes like ocean currents and heat transport, and biological processes in the oceans like the biological pump. Changes in elements like temperature, precipitation, wind and others are driven by factors like latitude, land-sea distribution, and topography.
Are we overlooking potential abrupt climate shifts?
Most of the studies and debates on potential climate change, along with its ecological and economic impacts, have focused on the ongoing buildup of industrial greenhouse gases in the atmosphere and a gradual increase in global tempera- tures. This line of thinking, however, fails to consider another potentially disruptive climate scenario. It ignores recent and rapidly advancing evidence that Earth’s climate repeatedly has shifted abruptly and dramatically in the past, and is capable of doing so in the future.
Fossil evidence clearly demonstrates that Earth’s climate can shift gears within a decade, establishing new and different patterns that can persist for decades to centuries. In addition, these climate shifts do not necessarily have universal, global effects. They can generate a counterintuitive scenario: Even as the earth as a whole continues to warm gradually, large regions may experience a precipitous and disruptive shift into colder climates.
This new paradigm of abrupt climate change has been well established over the last decade by research of ocean, earth
The global ocean circulation system, often called the Ocean Conveyor, transports heat worldwide. White sections represent warm surface cur- rents. Purple sections represent cold deep currents.
and atmosphere scientists at many institutions worldwide. But the concept remains little known and scarcely appreciated in the wider community of scientists, economists, policy mak- ers, and world political and business leaders. Thus, world lead- ers may be planning for climate scenarios of global warming that are opposite to what might actually occur.1
It is important to clarify that we are not contemplating a situation of either abrupt cooling or global warming. Rather, abrupt regional cooling and gradual global warming can un- fold simultaneously. Indeed, greenhouse warming is a desta- bilizing factor that makes abrupt climate change more prob- able. A 2002 report by the US National Academy of Sciences (NAS) said, “available evidence suggests that abrupt climate changes are not only possible but likely in the future, poten- tially with large impacts on ecosystems and societies.”2
The timing of any abrupt regional cooling in the future also has critical policy implications. An abrupt cooling that hap- pens within the next two decades would produce different climate effects than one that occurs after another century of continuing greenhouse warming.
Are ‘little ice ages’ and ‘megadroughts’ possible?
Scientists are investigating whether changes in ocean circu- lation may have played a role in causing or amplifying the “Little Ice Age” between 1300 and 1850. This period of abruptly shift- ing climate regimes and more severe winters had profound agri- cultural, economic, and political impacts in Europe and North America and changed the course of history.
Long and Short Term Changes of Climate discusses various factors that cause changes in climate over both small and long terms. Small-term changes are caused by volcanic eruptions, small variations in solar radiation, and shifts in air and ocean currents. Long-term changes are influenced by changes in Earth's energy balance, orbital variations, glacial activity, plate tectonics, and human influences like fossil fuel usage. The document also discusses how climate change can affect animals and ecosystems, as well as how scientists monitor and study climate change.
Climate: Climatic Change - Evidence, Cycles and The Futuregeomillie
A PowerPoint used in class to cover the key forms of evidence you need to know for the Exam. Key Questions are likely to be focused on how we can gain information of past climatic change, and how it can be used to predict future, and I would expect you to be able to comment on the usefulness of the different types. For instance, Ice cores are highly accurate and quantifiable evidence, but gaining them is expensive, and only gives a climatic record for the site at which the snow formed. However, they do provide the longest record of change.
This document discusses both short-term and long-term changes in climate. Short-term changes are caused by volcanic eruptions, small variations in solar radiation, and ocean and air currents. Long-term changes are influenced by changes in the Earth's energy balance, temperature variations due to greenhouse gas emissions, orbital and solar cycles, glacial activity, plate tectonics, and human influences. The document also discusses past climate events like the Medieval Climate Optimum and Little Ice Age, and predicts future climate impacts including increased forest fires in Canada and rising sea levels worldwide due to melting polar ice caps.
Lesson1 climate and change GCSE Edexcel B Geographysarah marks
The document discusses several natural causes of past climate change:
1) Solar activity, with periods of lower sunspot activity corresponding to "Little Ice Ages" and higher activity to warm periods like the Medieval Warm Period. However, solar activity does not correlate with warming since 1975.
2) Orbital cycles known as Milankovitch cycles, which cause ice ages and warm interglacial periods over 100,000 year cycles.
3) Large volcanic eruptions, which eject aerosols that reflect sunlight and cause short-term global cooling lasting several years.
4) Ocean circulation patterns, with changes potentially causing Europe to be 6-8°C cooler during glacial periods due to reductions in the
The document discusses both long-term and short-term effects of climate change. Over millions of years, continental drift and changes in Earth's orbit have triggered changes by altering ocean currents, wind patterns, and the distribution of land masses. In the short-term, volcanic eruptions and shifts in air and ocean currents can temporarily cool the climate by blocking sunlight. The Milankovitch cycles of Earth's orbit and axial tilt occurring over tens of thousands of years are linked to recurring ice ages and interglacial periods.
The document discusses the thermohaline circulation system, also known as the ocean conveyor belt. It is driven by differences in temperature and salinity that cause some water masses to become dense and sink into deep ocean basins. This circulation exchanges warm surface water for cold deep water and transports heat energy around the globe. As the Arctic sea ice and Greenland ice sheet melt due to warming, the influx of freshwater could disrupt or shut down this circulation system by inhibiting the sinking of dense water masses. Major disruptions to thermohaline circulation could significantly impact global climate patterns and marine ecosystems.
The document discusses key concepts about the Earth's climate system:
1) Climate is the long-term average weather conditions in an area, while weather describes short-term conditions. Various mechanisms can cause climate change over different timescales.
2) The climate system includes interactions between the atmosphere, oceans, ice, land, and life. Feedback loops can amplify or reduce the effects of initial climate changes.
3) Factors that influence the climate on long timescales include variations in solar activity, volcanic eruptions, greenhouse gases, and plate tectonics. Climate has fluctuated in the past between ice ages and warmer periods.
The document discusses the Earth's climate system and factors that can cause climate change. It defines climate as the long-term atmospheric conditions of an area, whereas weather refers to short-term conditions. Climate change occurs when factors like greenhouse gases, solar variability, volcanic eruptions, and human activities disrupt the global energy balance. The climate system includes interactions between the atmosphere, oceans, ice sheets, and land that influence heat distribution.
- Climate change occurs on various timescales and is influenced by factors like solar activity, Earth's orbit, atmospheric composition and greenhouse gases, volcanic eruptions, and human activities like fossil fuel burning.
- Evidence from geology and fossils shows past climate changes, including intervals warmer than today and ice ages. The last ice age peaked around 20,000 years ago and glaciers have since retreated.
- Future climate is uncertain but computer models predict global warming and changing precipitation patterns if CO2 doubles from current levels due to feedbacks like ice-albedo and water vapor effects. Careful study of past and present helps understand complex climate system.
1. The Effects of Wind Speed, Water Temperature, Angle of Light
and Light Intensity on the Mass of an Ice Cube
Christopher Harness and Trevor P. Balfour
Physics, IDS, Pre-Calculus
11C
Macomb Mathematics Science Technology Center
9 June 2014
2. The Effects of Wind Speed, Water Temperature, Angle of Light and Light Intensity on
the Mass of an Ice Cube
With greenhouse gases contaminating the atmosphere, the arctic environment is
vulnerable to severe climate changes, allowing natural weather and solar conditions to
devastate the area with ease.
Simulating the effects such as light intensity, surrounding water temperatures, the
angle of light, and the wind speed, a research team created an artic environment in order
to study the change of mass of an ice cube under these effects over a short period of time.
This simulated experiment was performed with the intent of solving the issues that appear
in this environment.
Systematically, the four factors were set in different combinations to give
different results in the change of mass, having them manually adjusted for the start of
every new trial. Once the trials were started, the ice cubes melted in the surrounding salt
water solution for two minutes before they were removed. Then, their final mass was
recorded to calculate the percent change in mass.
The higher percent changes of the ice cube’s mass came mostly from exposure to
high-leveled factors. These high level factors supported the researchers’ predictions;
however, they did not anticipate the lower water temperatures playing a vital role to the
greatest change in ice mass which was at 38.26%. Lower percent changes usually
resulted with low-leveled factors present (the lowest percentage change being 2.94%).
With these results, society will become well aware of how severe the arctic environment
reacts to the harsher weather conditions and the change of climate.
3. Table of Contents
Introduction..........................................................................................................................1
Review of Literature ............................................................................................................3
Problem Statement ...............................................................................................................9
Experimental Design..........................................................................................................10
Data and Observations .......................................................................................................16
Data Analysis .....................................................................................................................24
Conclusion .........................................................................................................................39
Works Cited .......................................................................................................................44
Appendix A: TI-nSpire Randomization.............................................................................46
Appendix B: Light Intensity Calculation...........................................................................47
Appendix C: Percent Change calculation ..........................................................................48
Appendix D: Alternate Interior Angles Example .............................................................49
4. Harness – Polisuk-Balfour 1
Introduction
In order to keep the Earth relatively cool under the effects of the sun, arctic sea
ice is able to reflect 80% of the sun’s light without it ever melting (Parry); however, in
recent years, the arctic environment has gone through drastic changes as the extent of sea
ice continues to decrease. With the effects of global industrialization, pollution,
deforestation, and other human related activities (as well as natural activities such as
volcanic eruptions giving off heat into the air), the carbon dioxide levels continue to
increase all over the Earth, creating a greenhouse effect which contributes to the rapid
melting of the glaciers. With temperatures on the rise, the arctic sea ice is melting at a
dangerously fast rate, allowing the harsher conditions of the weather to help make
damage in this once strong, frozen environment.
Figure 1. Sea Ice Extent Chart from 1979 to 2014 (NSIDC)
Figure 1 shows the sudden losses in sea ice extent over the past 35 years as
analyzed by the National Snow & Ice Data Center. The sea ice extent, measured in
millions of square kilometers, has been known to decrease by 2.4% per decade since the
5. Harness – Polisuk-Balfour 2
1980’s, meaning that over one million square kilometers of sea extent has sporadically
decreased over a short period of time.
It is very difficult to predict the changes of sea ice extent patterns due to the
weather and solar effects being uncontrolled in this environment, meaning the amount of
the remaining sea ice extent can experience a major loss within a short period of time if
something is not done. Simulating the effective roles that the weather and sun play in the
arctic, a research team conducted an experiment used to find the change of mass on an ice
cube to solve the anomalies related to what is going on in the arctic today. A four factor
D.O.E (Design of Experiment) was used to simulate the weather in the environment
including: the sunlight intensity, the angle of light, the wind speed, and the temperature
of water. The distance from the light source and angle were both used as a factor because
depending on the time of year, the Earth is closer and tilted toward the sun. For this
reason, the researchers believe that the distance of the Earth from the sun plays a direct
role in the rate that ice melts. Wind speed was used because it is known to help weather
down sea ice extent and can cause it to spread throughout the ocean area. Water
temperature was used as a final factor because it represents the heat exchanges from
ocean current and sea ice will always be surrounded be salty ocean waters.
Finding the change of mass of these ice cubes under the varied factors of weather
and solar activity over the course of two minutes will help raise awareness to ecologists,
corporations, industrialists, and even the general population because the arctic
environment is at risk due to high pollution and the drastic changes in climate, causing
more to react and raise awareness to this dying frozen land.
6. Harness – Polisuk-Balfour 3
Review of Literature
With temperatures on the rise, the arctic ice is melting at a dangerously fast rate,
allowing the harsher conditions of the weather to help damage this once strong, frozen
environment. Under the effects of wind speed, heat exchange through water, light
intensity, and the angle of light, the arctic environment is simulated in this experiment
using regular ice cubes in order to study the change in mass under a certain period of
time.
The speed of the wind is a factor that contributes to the sudden loss of ice in the
arctic. According to Richard A. Kerr, increasing wind speeds in the arctic are chipping
off smaller portions of ice or glaciers and moving them into warmer waters where they
can melt. Similar to how ocean currents are able to transfer heat to areas around the
world, winds transfer an atmospheric energy known as “latent heat.” The heat transfer
begins at the equator, where the Sun’s rays shine on the water and easily turn it into water
vapor. There, the cool air from below begins to replace the warmer air being created,
causing winds to be created and move around (Berger). The speed and intensity of the
wind depends on the amount of pressure from both cool and warm airs and how strong it
is when reaching higher latitudes of the Earth. Wind speeds are normally measured by
anemometer in either meters per second or miles per hour as a main unit.
7. Harness – Polisuk-Balfour 4
Figure 1. Wind Patterns in Polar Environments (“Unstable Antarctica”)
According to Figure 1, "increased winds drag surface water faster, and this
coupled with the Coriolis (body in motion relative to the Earth) steers the water to the left
and away from the continent, which leads to upwelling of warmer water into the area"
(Leontiou). Although Figure 1 displays patterns in Antarctica, the effects are similar in
the arctic region; however, due to more industrialization and human activity in the
Northern Hemisphere, higher amounts of carbon dioxide are transferred by the winds
causing a warmer environment in the arctic.
The temperature of the water has played a vital role in the arctic
environment. Since ocean waters are known to have high amounts of salt water, waters
can become warmer from the energy given off from the dissolved salt or from the sun
itself.
8. Harness – Polisuk-Balfour 5
Figure 2. Convection Currents in the Arctic (World Ocean Review)
Figure 2 shows how convection currents (hotter fluids rise and cooler fluids sink.)
work in the Arctic Ocean. The ice that melts in the near-freezing water flows down to
over a mile below the surface where it is swept south by strong ocean currents. While this
is happening, warm water is being transferred via currents from the south, consequently
warming the ice and causing more to melt (Nave).
Solar radiation plays a significant role in the arctic environment when it comes to
regulating the colder temperatures. Sea ice, as well as snow, has high reflective properties
known as the albedo effect which causes a positive climate feedback by releasing energy
from the surface due to solar radiation (Stacey). The albedo effect is lowered, however,
when temperatures begin to rise and melt the structure of the ice, making it become less
resistant to solar radiation, causing either the sea ice to melt or the ocean waters around to
rise in temperature.
9. Harness – Polisuk-Balfour 6
Figure 3. The Albedo Effect in Different Regions (Danhi)
Figure 3 models the albedo effect in different regions of the Earth. Although the
amount of sunlight is mainly indirect in this region, snow and ice are known to trap little
amounts of heat because of their high reflectivity rate (which is 85-90% according to the
model). Stronger structures of ice and snow are known to reflect the Sun’s rays, but if the
structure is weaker, or if the surface is just ice, more energy is absorbed than reflected,
causing the ice to melt faster. More energy is reflected and absorbed at midday, when the
Sun is at its highest, and less energy is given off during the afternoon/evening in the
Arctic since the Sun is setting and hardly shinning on the surface, keeping the surface in a
cool state for the rest of the night until the cycle is repeated. Due to the polar position and
distance from the Sun, a summer day in the Arctic has no sunsets causing more
absorption of heat from the Sun’s energy.
10. Harness – Polisuk-Balfour 7
Figure 4. Model of Direct and Indirect Sunlight on a Planet (Becker)
Figure 4 displays the role the sun plays on a planet when shining light upon it.
Indirect sunlight is mainly cast in the more northern and southern parts of the Earth and
because of the Earth’s shape, more area will be covered by the light; however, the sun
will be scattered around the surface making it seem less intense due to atmospheric
refraction.
Light intensity, whether it is measured from a star or other source of light, is
classified by the amount of power the light source gives off and the distance an object or
organism is from the light source (Mariotto).
𝑊𝑎𝑡𝑡𝑠
4𝜋𝑟2
Figure 5. Light Intensity Equation
Figure 5 displays the equation for light intensity. Four pi is used in this equation
for light intensity on the Earth due to its spherical shape; otherwise, the equation would
only include power and distance.
11. Harness – Polisuk-Balfour 8
All four of these factors were cumulated into one simulated experiment. Each
factor was systematically tested alongside the other three to determine which
combinations of the variables resulted in the fastest rate of ice melt. It was hypothesized,
based on the research above, that when all of the factors (wind speed, angle of light, light
intensity, and water temperature) are high, the rate at which ice melts will be maximized.
12. Harness – Polisuk-Balfour 9
Problem Statement
Problem:
How will the percent change in the mass of an ice cube differ when exposed to
varying levels of water temperature, wind speed, the light intensity, and the angle of
light?
Hypothesis:
If the water is at its highest temperature along with the highest wind speed,
highest light intensity, and the highest angle of light, then the ice cube will melt in the
fastest time.
Data Measured:
The mass of the ice cubes was kept as close as possible to being constant and was
measured in grams. The temperature of the water was measured in degrees Celsius and
the volume was measured in milliliters. The salinity level of each chilled mixture was
kept constant. The light intensity was measured in the amount of watts the bulb gave off
from the lamp and the distance of the light source was measured in meters. The wind
speed was measured in meters per second and the distance from the ice cube, which was
measured in meters, was kept at a constant. The response variable is the percent
difference in mass of the ice cube after the experiment is completed, which was measured
in grams. The effects of these factors on the change of mass in an ice cube was recorded
in a total of 19 trials, three of them being standard runs, while the others were
combinations of high and low values of each factor.
13. Harness – Polisuk-Balfour 10
Experimental Design
Materials:
(4) 50 mL Styrofoam Bowls Electronic Scale (0.1 g)
Chill Out Fan with 2 Speed Settings Meter Stick
Adjustable Office Lamp (25 W) 34 oz. of Sea Salt
500 mL Beaker Roll of Paper Towel
TI-Nspire Calculator Stopwatch Refrigerator/Freezer
Protractor (1˚) 100 mL Graduated Cylinder
Digital Thermometer (0.1˚C) Glass Stirring Rod
Procedure:
Setup:
1. Randomize Trials using the randomization feature on the Ti-Nspire calculator (see
Appendix A for instructions)
2. Set the fan and lamp up around a bowl so that they do not interfere with each other
3. Dissolve 3.5 grams of salt per every 100 mL of solution made for all trials. Pour
water onto the salt to assist with mixing. Stir with glass stirring rod until salt is
completely dissolved
High Temperature Water:
1. Chill salt water solution to 2 degrees Celsius
Low Temperature Water:
1. Chill salt water solution to -1.99 degrees Celsius because if it reaches -2, the water
will freeze completely
14. Harness – Polisuk-Balfour 11
Standard Temperature Water:
1. Chill salt water solution to 0 degrees Celsius
Trials:
1. Measure the distance that the bowl is to be from the base of the lamp. This value will
change depending on the trial
2. Adjust the angle of light according to the trial being conducted
3. Take the mass of the ice cube
4. Adjust the wind speed setting according to the trial being conducted
5. Add the ice cube to the selected water and collect data for two minutes.
6. Remove the ice cube from the bowl and turn off the fan (it interferes with the scale)
and place it onto the electronic scale
7. Record final mass and temperature
8. Dispose of ice cube in the sink
15. Harness – Polisuk-Balfour 12
Diagram:
Figure 2. Diagram of Experimental Process
Figure 2 shows what will occur when performing this experiment. The ice cube
shown will be frozen in temperatures above -2˚C and placed in the bowl with water that
contains a different temperature (temperatures being recorded with a thermometer). This
ice cube will also be placed in front of a fan with a different wind speed (recorded with
the anemometer) and will have light shine down on it at different angles and different
distances. The initial and final masses will be measured with the scale and time will be
recorded with the stopwatch application on the TI-Nspire.
Fan
Bowl with
Salt Water
Scale
Cooler
Lamp
Tongs
Ti-nSpire
Meter
Stick
16. Harness – Polisuk-Balfour 13
Data and Observations
Data:
Table 1
Factor Values of Experiment
Factors (+) Values Standards (-) Values
Wind Speeds (m/s) High Low Off
Light Intensity (I) with
changed Distances (m)
25 𝑊𝑎𝑡𝑡𝑠
4𝜋0.2𝑚2
25 𝑊𝑎𝑡𝑡𝑠
4𝜋0.3𝑚2
25 𝑊𝑎𝑡𝑡𝑠
4𝜋0.4𝑚2
Angle of Light from Ice 70˚ 50˚ 30˚
Water Temperature (˚C) 2˚C 0˚C -2˚C
Table 1 classifies the values for each factor. Wind speeds were determined by the
settings on the ChillOutTM fan with “High” being the highest wind speed, “Low” being
the standard wind speed, and “Off” being the low wind speed. Light Intensity varied from
high to low on the distance between the light source and the ice cube; the farther the
distance, the less intense the light becomes on the ice cube. Angle of light represents the
time of day, and since the arctic environment is on a tilt, the sun’s rays will never be
perpendicular to the surface, creating these values. Lastly, water temperature was
determined based on seasonal ocean current climates in the arctic region. Sea water is
said to begin freezing at -2˚C and can normally go up to degrees under 5˚C unless it is
affected by other factors like sunlight, allowing it to increase to abnormal temperatures.
17. Harness – Polisuk-Balfour 14
Table 2
Results in Mass Change of Ice under Simulated Natural Effects
Trial
Initial
Mass
(g)
Initial Water
Temperature
(˚C)
Wind
Speed
(Fan
Settings)
Light
Intensity
(
𝑊𝑎𝑡𝑡𝑠
4𝜋 𝑟2 )
Angle of
Light
Final
Mass
(g)
%
Change
in Mass
***** 5.14 Standard Standard Standard Standard 4.09 20.4280
1 8.2 + - - - 6.63 19.1463
2 7.68 - + - - 6.88 10.4167
3 8.03 - - + + 6.92 13.8232
4 7.74 + + - - 6.23 19.5090
5 8.26 - + + + 5.1 38.2567
6 7.34 + + + + 5.2 29.1553
7 6.11 - + - + 5.1 16.5303
8 7.08 + - - + 6.09 13.9831
***** 7.91 Standard Standard Standard Standard 6.26 20.8597
9 9.02 + + - + 7.32 18.8470
10 7.41 - + + - 6.03 18.6235
11 5.48 + + + - 3.76 31.3869
12 7.45 + - + + 5.86 21.3423
13 7.72 - - + - 7.13 7.6425
14 8.69 + - + - 7.62 12.3129
15 7.15 - - - + 6.94 2.9371
16 7.12 - - - - 6.56 7.8652
***** 7.23 Standard Standard Standard Standard 5.34 26.1411
18. Harness – Polisuk-Balfour 15
Table 2 displays the results of the change in ice mass (in grams) over the course
of two minutes while under the effects of simulated natural weather conditions including:
the angle of light that the sun’s rays project from the surface, the light intensity of the sun
(see Appendix B for light intensity sample calculation), the wind speed, and the
convection of the water. Over the period of time, the mass of each ice cube was reduced
under the effects of these varying factors (see Appendix C for percentage change
sample). The light intensity equation for this experiment represents the light energy
emitted from the sun being shown on a spherical surface, in this case the Earth. The
4𝜋𝑟2
seen in the denominator of this equation represents the area of a sphere, while the
number of watts in the numerator represents the power given off from the Sun. The
distance from the Earth to the Sun affects the intensity of the light; for example, the
farther the Sun is, the dimmer it appears to be on Earth.
19. Harness – Polisuk-Balfour 16
Observations:
Table 3
Observations of the Entire Experiment
Trial Observations
Standard 1 Start of trials. The testing ice cubes are all relatively small.
1
A larger dent is created through the bottom of the ice cube, wearing it
down from the center.
2, 6, 8,
Standard 2,10,
12, 13, 16
Trials ran with no issues.
3
The ice cube melted from the bottom up to the center, nearly split
before measuring its mass.
4 Bowl shook around during trial, causing some water to splash.
5 The weaker structure of the ice cube caused it to melt rapidly.
7
There was a great change in water temperature with low light
intensity.
9
The water temperature rose during the trial even though there was a
low light intensity.
11 The ice cube shrank tremendously due to its weaker structure.
14
The paper towel was replaced on scale due to have amounts of
absorbed water.
15
Only a small increase in water temperature, causing the ice cube to
barely melt.
Standard 3
Final trial. All the salt water solutions and ice cubes were dumped and
the lab was cleaned up.
Table 3 displays all of the unique moments that occurred during each trial. The
main reoccurrence for each trial was the salt water becoming warm after the two minute
trials were over and because of that, each bowl had to be replaced with a colder solution
from the refrigerator freezer. This happened for every trial because the water surrounding
20. Harness – Polisuk-Balfour 17
the ice cube absorbed the radiation given off from the light source, causing it to get
warmer and causing an endothermic reaction to occur with the ice cube.
Table 4
Recorded Changes in Water Temperature
Trial
Initial Water
Temperature
(˚C)
Final Water
Temperature
(˚C)
***** 0 2
1 2 4
2 -2 -0.1
3 -2 0.4
4 2 4.3
5 -2 -1
6 2 4.4
7 -2 0.8
8 2 2.5
***** 0 4
9 2 5.3
10 -2 0.5
11 2 3.6
12 2 6
13 -2 -0.6
14 2 5
15 -2 -1.5
16 -2 -0.3
***** 0 3.6
21. Harness – Polisuk-Balfour 18
Table 4 contains the observed changes in water temperature due to the effects of
convection and heat added from the light source. Although this data does not serve as the
response variable for this experiment, it serves as relevant information because without
the changes in water temperature, the ice cubes would not have been affected by the wind
and light source as intensely and as naturally as they were when surrounded in a
simulated ocean.
The experimented by was performed by the researchers using the following
crucial steps:
Figure 4. Step One: Positioning the Solution from the Light Source
Figure 4 displays how and where to put the bowl of cold salt water before the trial
is even started. Placing the fan parallel to it, the bowl is set along the ruler at 20 cm, 40
cm, or 60 cm from the lamp in order to determine the light intensity.
Ruler
Fan
Bowl
22. Harness – Polisuk-Balfour 19
Figure 5. Step Two: Adjusting the Angle of Light
Figure 5 shows how the angle of light is adjusted for each trial. With the help of a
protractor, the angle of light is determined by the notch settings on the lamp, causing the
proper amount of light to reach the surface of the water and the ice cube. Using the
alternate interior angles formula (see Appendix D for example), the angle of light from
the surface can be determined.
Figure 6. Step Three: Measuring the Mass of the Ice Cube/Beginning the Trial
Protractor
Lamp
23. Harness – Polisuk-Balfour 20
Figure 6 displays the third and final preparation before beginning the actual trial.
The ice cube is taken from a nearby cooler or freezer with tongs and placed on a scale to
measure its initial mass. Once that is recorded into the data tables, the ice cube is then
placed into the bowl with the fan running to the certain setting and the lamp being turned
on for the next two minutes. After that, the ice cube is placed onto the scale again to
measure its final mass. To observe the change in temperature due to convection and light
intensity, the water temperature is measured with a thermometer probe as it was before
the trial and is recorded into the data tables.
24. Harness – Polisuk-Balfour 21
Data Analysis and Interpretation
This data was collected by measuring the final mass of an ice cube with a scale,
having the percent change calculated from the initial mass and put into a data table. The
eperiment was performed and tested with a 4 Factor Design of Experiment, in which each
factor (4) contained a high, low, and standard value. All 16 non-standard trials were
conducted in a randomized order to reduce bias for this experiment. The effects of each
factor on the ice mass was measured below to find its significance in the experiment. This
data was collected by measuring the final mass of an ice cube with a scale, having the
percent change calculated from the initial mass and put into a data table. The eperiment
was performed and tested with a 4 Factor Design of Experiment, in which each factor (4)
contained a high, low, and standard value. All 16 non-standard trials were conducted in a
randomized order to reduce bias for this experiment. The effects of each factor on the ice
mass was measured below to find its significance in the experiment.
0.1238
0.2284
0
0.05
0.1
0.15
0.2
0.25
-1 1
ChangeinIceMass
Wind Speed
Effect of Wind Speed on the
Percent Change in Ice Mass
Effect of Winds Speed
(-) Values (+) Values
0.2134 0.1382 0.2916 0.3826
0.1231 0.0764 0.3139 0.1862
0.1398 0.0294 0.1885 0.1653
0.1915 0.0787 0.1915 0.1012
Average: .1238 Average: .2284
Table 5
Wind Speed Effect Values
Figure 1. Effect of Wind Speed on the Percent Change in Ice Mass
Interaction Effect = .105
Interaction Effect = .0510
25. Harness – Polisuk-Balfour 22
Figure 1 displays the average percent change in ice mass when high wind speed
was used and the average percent change in ice mass when low wind speed was used.
Table 1 shows that when wind speed was low, the average percent chance in ice mass
was 12.38% and when the wind speed was high, the average percent change in ice mass
was 22.84%. As wind speed goes from low to high, the change in ice mass increased by
.105 (10.5%).
Figure 2 displays the average percent change in ice mass when high angle of light
was used and the average percent change in ice mass when low angle of light was used.
Table 2 shows that when angle of light was low, the average percent change in ice mass
was 15.86% and when the angle of light was high, the average percent change in ice mass
was 19.36%. As the angle of light goes from low to high, the change in ice mass
increased by .035 (3.5%).
0.1586 0.1936
0
0.2
0.4
-1 1
ChangeinIceMass
Angle of Light
Effect of Angle of Light on
the Percent Change in Ice
Mass
Effect of Angle of Light
(-) Values (+) Values
0.3139 0.1862 0.2916 0.3826
0.1231 0.0764 0.1885 0.1653
0.1951 0.1042 0.2134 0.1382
0.1915 0.0787 0.1398 0.0293
Average: .1586 Average: .1936
Figure 2. Effect of Angle of Light on the Percent Change in Ice Mass
Table 2
Angle of Light Effect Values
Interaction Effect = .035
Interaction Effect = .0510
26. Harness – Polisuk-Balfour 23
Figure 3 displays the average percent change in ice mass when high light intensity
was used and the average percent change in ice mass when low light intensity was used.
Table 3 shows that when light intensity was low, the average percent chance in ice mass
was 13.66% and when the light intensity was high, the average percent change in ice
mass was 21.57%. As the light intensity goes from low to high, the change in ice mass
increased by .079 (7.9%).
0.1366
0.2157
0
0.2
0.4
-1 1
ChangeinIceMass
Light Intensity
Effect of Light Intensity on
the Percent Change in Ice
Mass Effect of Light Intensity
(-) Values (+) Values
0.1885 0.1653 0.2916 0.3826
0.1951 0.1042 0.3139 0.1862
0.1398 0.0294 0.2134 0.1382
0.1915 0.0787 0.1231 0.0764
Average: .1366 Average: .2157
Figure 3. Effect of Light Intensity on the Percent Change in Ice Mass
Table 3
Light Intensity Effect Values
Table 3
Light Intensity Effect Values
Interaction Effect = .079
Interaction Effect = .0510
27. Harness – Polisuk-Balfour 24
Figure 4 displays the average percent change in ice mass when high water
temperature was used and the average percent change in ice mass when low water
temperature was used. Table 4 shows that when water temperature was low, the average
percent chance in ice mass was 14.51% and when the water temperature was high, the
average percent change in ice mass was 20.71%. As the water temperature goes from low
to high, the change in ice mass increased by .062 (6.2%)
0.1451
0.2071
0
0.2
0.4
-1 1
ChangeinIceMass
Water Temperature
Effect of Water Temperature
on the Percent Change in Ice
Mass
Effect of Water Temperature
(-) Values (+) Values
0.3826 0.0764 0.2916 0.1231
0.1862 0.1042 0.3139 0.1951
0.1653 0.0294 0.1885 0.1398
0.1382 0.0787 0.2134 0.1915
Average: .1451 Average: .2071
Figure 4. Effect of Water Temperature on the Percent Change in Ice Mas
Table 4
Light Intensity Effect Values
Table 4
Light Intensity Effect Values
Interaction Effect = .062
Interaction Effect = .0510
28. Harness – Polisuk-Balfour 25
Figure 5 depicts the interaction effect that wind speed and water temperature had
on the average percent change in ice mass. When the wind speed and water temperature
were high, the average rate of percent change in ice mass was maximized. Table 5 shows
the solid segment is the high wind speed with both low and high water temperature on the
horizontal axis. The dotted segment is the low values of wind speed with both low and
high water temperature. The interaction effect value between wind speed and water
temperature is approximately -.0243 (-2.43%) (slopes of solid segment and dotted
segment subtracted from each other). The slope ratio is about the same meaning that there
is little interaction between the two factors.
0.167
0.247
0.081
0.2100.000
0.200
0.400
-1 1
ChangeinIceMass
Water Temperature
Effect of Wind Speed and
Water Temperature on the
Percent Change in Ice Mass Water
Temperature
- +
Wind
Speed
Solid
Segment
+
0.167 0.247
Dotted
Segment
-
0.081 0.210
Interaction Effect = -.0243
Table 5
Interaction between High (+) and Low
(-) Wind Speed, and High (+) and Low
(-) Water Temperature
Table 5
Interaction between High (+) and Low
(-) Wind Speed, and High (+) and Low
(-) Water Temperature
Figure 5. Wind Speed and Water Temperature Interaction Effect on Percent Change in Ice Mass
WS (+)
WS (+)
WS (-)
WS (-)
29. Harness – Polisuk-Balfour 26
Figure 6 depicts the interaction effect that angle of light and water temperature
had on the average percent change in ice mass. When the angle of light and water
temperature were high, the average rate of percent change in ice mass was maximized.
Table 6 shows the solid segment is the high angle of light with both low and high water
temperature on the horizontal axis. The dotted segment is the low values of angle of light
with both low and high water temperature. The interaction effect value between angle of
light and water temperature is approximately -.0325 (-3.25%) (slopes of solid segment
and dotted segment subtracted from each other). The slope ratio is about the same
meaning that there is little interaction between the two factors.
0.179 0.208
0.111
0.206
0.000
0.200
0.400
-1 1
ChangeinIceMass
Water Temperature
Effect of Angle of Light and
Water Temperature on the
Percent Change in Ice Mass
Water
Temperature
- +
Angle
of
Light
Solid
Segment
+
0.179 0.208
Dotted
Segment
-
0.111 0.206
Interaction Effect = -.0325
Table 6
Interaction between High (+) and Low
(-) Angle of Light, and High (+) and
Low (-) Water Temperature
Table 6
Interaction between High (+) and Low
(-) Angle of Light, and High (+) and
Low (-) Water Temperature
Figure 6. Angle of Light and Water Temperature Interaction Effect on Percent Change in Ice Mass
AoL (+)
AoL (+)
AoL (-)
AoL (-)
30. Harness – Polisuk-Balfour 27
Figure 7 depicts the interaction effect that light intensity and water temperature
had on the average percent change in ice mass. When the light intensity and water
temperature were high, the average rate of percent change in ice mass was maximized.
Table 7 shows the solid segment is the high light intensity with both low and high water
temperature on the horizontal axis. The dotted segment is the low values of light intensity
with both low and high water temperature. The interaction effect value between light
intensity and water temperature is approximately -.0224 (-2.44%)(slopes of solid
segment and dotted segment subtracted from each other). The slope ratio is about the
same meaning that there is little interaction between the two factors.
0.196 0.236
0.094
0.1790.000
0.200
0.400
-1 1
ChangeinIceMass
Water Temperature
Effect of Light Intensity and
Water Temperature on the
Percent Change in Ice Mass Water
Temperature
- +
Light
Intensity
Solid
Segment
+
0.196 0.236
Dotted
Segment
-
0.094 0.179
Interaction Effect = -.0224
Table 7
Interaction between High (+) and Low
(-) Light Intensity, and High (+) and
Low (-) Water Temperature
Table 7
Interaction between High (+) and Low
(-) Light Intensity, and High (+) and
Low (-) Water Temperature
Figure 7. Light Intensity and Water Temperature Interaction Effect on Percent Change in Ice Mass
LI (+)
LI (+)
LI (-)
LI (-)
31. Harness – Polisuk-Balfour 28
Figure 8 depicts the interaction effect that light intensity and wind speed had on
the average percent change in ice mass. When the light intensity and wind speed were
high, the average rate of percent change in ice mass was maximized. Table 8 shows the
solid segment is the high light intensity with both low and high wind speed on the
horizontal axis. The dotted segment is the low values of light intensity with both low and
high wind speed. The interaction effect value between light intensity and wind speed is
approximately .0510 (5.10%) (slopes of solid segment and dotted segment subtracted
from each other). The slope ratio is about the same meaning that there is little interaction
between the two factors.
0.138
0.294
0.110
0.163
0.000
0.200
0.400
-1 1
ChangeinIceMass
Wind Speed
Effect of Light Intensity and
Wind Speed on the Percent
Change in Ice Mass
Wind Speed
- +
Light
Intensity
Solid
Segment
+
0.138 0.294
Dotted
Segment
-
0.110 0.163
Interaction Effect = .0510
Table 8
Interaction between High (+) and Low
(-) Light Intensity, and High (+) and
Low (-) Wind Speed
Table 8
Interaction between High (+) and Low
(-) Light Intensity, and High (+) and
Low (-) Wind Speed
Figure 8. Light Intensity and Wind Speed Interaction Effect on Percent Change in Ice Mass
LI (+)
LI (+)
LI (-)
LI (-)
32. Harness – Polisuk-Balfour 29
Figure 9 depicts the interaction effect that angle of light and wind speed had on
the average percent change in ice mass. When the angle of light and wind speed were
high, the average rate of percent change in ice mass was maximized. Table 9 shows the
solid segment is the high angle of light with both low and high wind speed on the
horizontal axis. The dotted segment is the low values of angle of light with both low and
high wind speed. The interaction effect value between angle of light and wind speed is
approximately .0220 (2.20%) (slopes of solid segment and dotted segment subtracted
from each other). The slope ratio is about the same meaning that there is little interaction
between the two factors.
0.130
0.257
0.117
0.2000.000
0.200
0.400
-1 1
ChangeinIceMass
Wind Speed
Effect of Angle of Light and
Wind Speed on the Percent
Change in Ice Mass
Wind Speed
- +
Angle of
Light
Solid
Segment
+
0.130 0.257
Dotted
Segment
-
0.117 0.200
Interaction Effect = .0220
Table 9
Interaction between High (+) and Low
(-) Angle of Light, and High (+) and
Low (-) Wind Speed
Table 9
Interaction between High (+) and Low
(-) Angle of Light, and High (+) and
Low (-) Wind Speed
Figure 9. Angle of Light and Wind Speed Interaction Effect on Percent Change in Ice Mass
AoL (+)
AoL (+)
AoL (-)
AoL (-)
33. Harness – Polisuk-Balfour 30
Figure 10 depicts the interaction effect that angle of light and light intensity had
on the average percent change in ice mass. When the angle of light and light intensity
were high, the average rate of percent change in ice mass was maximized. Table 10
shows the solid segment is the high angle of light with both low and high light intensity
on the horizontal axis. The dotted segment is the low values of angle of light with both
low and high light intensity. The interaction effect value between angle of light and light
intensity is approximately .0470 (4.7%). The slope ratio is about the same meaning that
there is little interaction between the two factors.
0.131
0.256
0.142 0.1750.000
0.200
0.400
-1 1
ChangeinIceMass
Light Intensity
Effect of Angle of Light and Light
Intensity on the Percent Change
in Ice Mass
Light Intensity
- +
Angle of
Light
Solid
Segment
+
0.131 0.256
Dotted
Segment
-
0.142 0.175
Interaction Effect = .0470
Table 10
Interaction between High (+) and Low
(-) Angle of Light, and High (+) and
Low (-) Light Intensity
Table 10
Interaction between High (+) and Low
(-) Angle of Light, and High (+) and
Low (-) Light Intensity
Figure 10. Angle of Light and Wind Speed Interaction Effect on Percent Change in Ice Mass
AoL (+)
AoL (+)
AoL (-)
AoL (-)
34. Harness – Polisuk-Balfour 31
Figure 11 displays the results of the standard runs. Plotted on the graph is the
percent change in ice mass observed during the standard trials. Since all of the standard
runs are within a close proximity to each other, it can be inferred that viable data was
collected.
20.42801556 20.8596713
26.14107884
0
5
10
15
20
25
30
0 1 2 3
ChangeinIceMass(%)
Standard
Standard Trials
Figure 11. Standard Trials
35. Harness – Polisuk-Balfour 32
Interpretation:
Table 1 shows the percent change in ice mass when exposed to high and low
levels of wind speed. When the wind speed was high, there was and average percent
change in ice mass of 22.84%. When the wind speed was low, there was an average
percent change in ice mass of 12.38%. As seen from Figure 1 the graph obviates that
when wind speeds are lower, the average percent change in mass is lower. This points to
the fact when exposed to greater wind speeds, ice is prone to melt at a faster rate.
Table 2 shows the percent change in ice mass when exposed to high and low
levels of angle of light. When the angle of light was high, there was and average percent
change in ice mass of 19.36%. When the wind speed was low, there was an average
percent change in ice mass of 15.86%. As seen from Figure 2 the graph obviates that
when angle of light is lower, the average percent change in mass is lower. This points to
the fact when exposed to a greater angle of light, ice is prone to melt at a faster rate.
Table 3 shows the percent change in ice mass when exposed to high and low
levels of light intensity. When the light intensity was high, there was and average percent
change in ice mass of 21.57%. When the light intensity was low, there was an average
percent change in ice mass of 13.66%. As seen from Figure 3 the graph obviates that
when light intensity is lower, the average percent change in mass is lower. This points to
the fact when exposed to greater light intensity, ice is prone to melt at a faster rate.
Table 4 shows the percent change in ice mass when exposed to high and low
levels of water temperature. When the water temperature was high, there was and average
percent change in ice mass of 22.84%. When the water temperature was low, there was
an average percent change in ice mass of 12.38%. As seen from Figure 4 the graph
36. Harness – Polisuk-Balfour 33
obviates that when water temperature is lower, the average percent change in mass is
lower. This leads us to believe that when exposed to greater water temperatures, ice is
prone to melt at a faster rate.
There appears to be an interaction between wind speed and water temperature.
They both seem to appear to melt the ice at a faster rate when the ice is exposed to the
high values. Wind speed and water temperature tend to be connected through the fact that
as the value of each increases, the percent change in ice mass increases, but when
lowered, the percent change in ice mass decreases. Figure 5 presents the interaction
between wind speed and water temperature. Both lines have a positive slope but these
slopes are not parallel, implying an interaction between the two variables. The likely
reason for this is because in the arctic, winds help to dissipate humidity, allowing for the
water contained within the ice to evaporate. Then, those weakened pieces break off and
move into warmer water where they can melt (Kerr). Almost identical results were
observed for all of the other interactions
In the standard run graph (see Figure 5) there is little variability. The highest
percent change in ice mass was 26.14% while the lowest was 20.43%. The reason that the
percent change in ice mass of 26.14% was so much higher than the other two can be
attributed to the ice cube’s initial mass. The data and research shows that when ice is in
smaller quantities, it is easier to melt. It is easier to melt because when the initial weight
of an ice cube is less, its integrity is compromised more easily by rapid environmental
changes.
37. Harness – Polisuk-Balfour 34
One of the crucial features to a Design of Experiment is the test of significance.
Figure 12 shows this prediction equation. Unfortunately, none of the effect values were
significant.
𝑌 = 𝐺𝐴 +
𝑒𝑓𝑓𝑒𝑐𝑡 𝑊𝑇
2
+
𝑒𝑓𝑓𝑒𝑐𝑡 𝑊𝑆
2
+
𝑒𝑓𝑓𝑒𝑐𝑡 𝐴𝐿
2
+
𝑒𝑓𝑓𝑒𝑐𝑡 𝐿𝐼
2
+
𝑒𝑓𝑓𝑒𝑐𝑡 𝑊𝑇 & 𝑊𝑆
2
+
𝑒𝑓𝑓𝑒𝑐𝑡𝑊𝑇 & 𝐴𝐿
2
+
𝑒𝑓𝑓𝑒𝑐𝑡𝑊𝑇 & 𝐿𝐼
2
+
𝑒𝑓𝑓𝑒𝑐𝑡𝑊𝑆 & 𝐴𝐿
2
+
𝑒𝑓𝑓𝑒𝑐𝑡𝑊𝑆 & 𝐿𝐼
2
+
𝑒𝑓𝑓𝑒𝑐𝑡𝐴𝐿 & 𝐿𝐼
2
+ 𝑁𝑂𝐼𝑆𝐸
Figure 12. Prediction Equation
Figure 12 above shows the prediction equation. The prediction equation contains
all the effects divided by two, the grand average, and noise which are lurking variables.
This result makes sense because in the field, light intensity, angle of light, wind
speed, and water temperature don’t rapidly melt ice as rapidly as was attempted in the
experiment. It takes days, weeks, even months before the arctic glaciers begin to
experience significant changes in mass which is what was proven by this experiment. For
this reason, there were no values to plug into the parsimonious prediction equation shown
in figure 14.
| 𝐸𝑓𝑓𝑒𝑐𝑡| ≥ 11.43%
Figure 13. Test of Significance
Figure 13 above shows the formula to test if the effects of the DOE were
significant. If the absolute value of the effect is greater than, equal to, or very close to
11.43%, which is the range of standards multiplied by 2, those effects are significant.
38. Harness – Polisuk-Balfour 35
𝑌 = 𝐺𝐴 + 𝑁𝑂𝐼𝑆𝐸
Figure 14. Parsimonious Prediction Equation
Figure 14 shows the parsimonious prediction equation. Since there were no
significant effect values, only the grand average and noise (lurking variables) are
included.
39. Harness – Polisuk-Balfour 36
Conclusion
The purpose of this experiment was to test the effects of water temperature, light
intensity, wind speed, and the angle of light on the percent change in an ice cube’s mass.
The initial hypothesis stated that an ice cube exposed to high wind speeds, high light
intensity, high water temperature, and a high angle of light (+,+,+,+) would experience
the highest percentage change in mass. The hypothesis was rejected however, when an
ice cube exposed to high wind speeds, a high angle of light, high light intensity, but a low
water temperature had the highest percentage change at 38.26%.
The factor that affected the percent change in an ice cube’s mass the most was
wind speed followed closely by water temperature, light intensity and the angle of light
with the range of effects being 4%. Similar to the massive losses of sea ice from Jinlun
Zhang’s simulated model of the arctic, the ice cubes experiencing intense wind speeds
had a faster melting rate because the winds carried over the humidity from the air causing
an endothermic reaction to occur. The wind speed was tested using two different fan
settings (high and low) while the low value for wind speed was having the fan turned off.
Whenever wind was present in the trial the percent change in mass for all of the ice cubes
experiencing the wind at a standard or high value were all over 20%, and when wind was
absent, the percent change in ice cube mass was under 20% for all of the ice cubes. The
fan was turned off for the low wind speed trials in order to simulate days in the arctic
where the air was stagnant.
Another factor that was tested was light intensity. The effect of light intensity was
relatively close the that of wind speed with an average percent change in ice mass of
21.57% when the light intensity was high and 13.66% when it was low. This result was
40. Harness – Polisuk-Balfour 37
expected because the amount of warmth the ice cube receives is directly related to the
distance of the ice from the light. The effect of sunlight is also observed in the arctic to
study climate changes. During the arctic winter where the sun is relatively not present,
the amount of ice loss is substantially less than in the summer. During the winter, there is
about an extent of 14 million square kilometers of ice while during the summer, that
average drops to below 10 million square kilometers (NSIDC). This is caused by the
Earth being in a closer proximity to the sun during the summer months.
The third factor tested to determine its effect on the percent change in an ice
cube’s mass was water temperature. This effect, unlike the others, was unexpected
because the results do not agree with real data collected from the arctic. It was expected
that the water temperature would impact the mass of the ice cube the most due to the
exchange of heat but instead, its effect had the least significance when the high values
were implemented with a 20.71% change in ice mass on average when the high value 2˚C
was implemented, and a 14.51% change on average when the low value of -2˚C was
used. This is reasonable because 2˚C is just barely above the freezing point of water and
therefore, the ice cube would not have been able to melt very much in comparison to
water at -2˚C. A major observation made for each trial was the change in water
temperature since each bowl of water would become relatively warmer at the end. These
results occurred because the amount of energy an ice cube releases when in colder waters
helps cause the temperatures to increase over time due to convection. Also, arctic sea ice
is exposed to elevated temperatures for elongated periods of time from currents, giving a
valid reason why this factor did not give a major contribution to the melting of each ice
cube. Another reason that the water temperature did not have a significant effect on the
41. Harness – Polisuk-Balfour 38
rate of ice melt was because the ice cubes were not a constant density. This led to issues
with the integrity of the ice cube.
The fourth and final factor that was tested was to the angle of light. The effect
values from this factor were also unexpected. It was thought that by changing the angle in
which the light strikes the ice cube and water, the amount of thermal energy absorbed by
the water would differ substantially. This was assumed to be true because of the
increased arctic ice loss during the summer months. The effect values were low compared
to all of the other factors with 1 19.36% change in an ice cube’s mass when the high
values were implemented and a percent change of 15.86% when low values were used.
Upon further research, it was discovered that the angle in which sun light strikes the
arctic ice plays a very minimal role in its melting rate. In the summer months, thermal
energy from the sun warms up the surrounding ocean waters and solar radiation heats up
the atmosphere surrounding the ice which causes it to melt faster. With this knowledge, it
is easy to understand why the angle of light played such a minimal role compared to the
other factors in melting the ice cubes.
In the world today, scientists are trying to analyze all of the factors that lead to the
accelerated rate of ice loss in the arctic beyond global warming. The data collected during
the experiment and the conclusions drawn from the data is directly related to research
done by climatologists. The data collected could assist scientists today because the
conclusions drawn from experimentation hold true for present day arctic climate
conditions. While the data is relevant to modern studies, the results of the effect of water
temperature disagree with all works that have been published in this field due to the
inaccuracies made in truly representing this environment.
42. Harness – Polisuk-Balfour 39
There were a few critical design flaws with this experiment before and during
data trials. The first of these was that the ice cubes that had a low initial mass melted
much faster than those with a higher initial mass. To achieve this, the researchers began
using ice cubes that only had an initial mass of a .5 gram difference above or below 7
grams. Another, uncontrollable factor was the temperature of the room and the humidity.
Due to the location of the experiment, these factors could not be controlled but were
assumed to be constant. When preparing the salt water solutions, not all of the salt was
thoroughly dissolved and so when some of the bowls were removed from the freezer, ice
crystals had begun to form inside of the solution. This was corrected later in the trials by
renewing the solution and taking care to make sure that all of the salt crystals dissolved
fully. The final design flaw was the amount that each solution was used. The blow that
was being used in the trials was random up until the halfway point in the trials because at
that point, the researchers suspected that because the solution was beginning to freeze at -
2˚C that the ratio of salt to water had become disproportionate during the first chunk of
trials.
Development of this research in the future can lead to scientists being able to
connect all the pieces of the arctic climate puzzle. To expand upon this research, more
factors can be tested simultaneously in addition to the ones already tested to discover the
true reason for accelerated arctic ice loss beyond global warming. For example, the
amounts of carbon dioxide can be studied to show how much of an effect it places on ice
loss or the experiment can be redone in an atmosphere much colder than before. With all
of these factors tested, this research can solve the anomalies of sea ice loss in the arctic
summertime once it has completely melted away.
43. Harness – Polisuk-Balfour 40
Throughout the experiment, although done of the factors were significant
compared to the standards; wind speed clearly played the biggest role in accelerating the
speed in which an ice cube melts followed by light intensity, water temperature and angle
of light respectively. The conclusions drawn from this research will help put to rest the
current debacle of what is causing rapid arctic ice loss and will consequently change the
views of many on why arctic ice is melting so quickly. Future research can be
implemented in the field using these same factors (or some variation of) to find a
solution, if any, to the rapid arctic ice loss.
44. Harness – Polisuk-Balfour 41
Works Cited
Becker, Gary A. “The Reasons for the Seasons.” ASD Planetarium. Web. Copyright
2013. 26 April 2014. <http://www.astronomy.org/programs/seasons/>.
Berger, Wolfgang H. “The Earth’s Climate Machine.” Calspace Courses. Web.
Copyright 2002. 29 April 2014.
<http://earthguide.ucsd.edu/virtualmuseum/climatechange1/07_2.shtml>.
Bowden, Stuart and Christiana Honsberg. “Solar Radiation on a Tilted Surface.” PV
Education. Web. Copyright 2014. 12 April 2014.
<http://pveducation.org/pvcdrom/properties-of-sunlight/solar-radiation-on-tilted-
surface>.
Danhi, Robert. “Albedo Effect.” The Map Factory, Inc. Web. Copyright 2013. 6 June
2014. <http://www.the-m-factory.com/portfolio/illustrated/illustrated_08.html>.
Leontiou, Andrea. "Puzzle of Antarctic Ice Melt Solved." LiveScience. TechMedia
Network, 15 Dec. 2010. Web. 29 Apr. 2014. <http://www.livescience.com/29903-
puzzle-of-antarctic-ice-melt-solved.html>.
Kerr, Richard A. "Scary Arctic ice loss? Blame the wind." Science 307.5707 (2005): 203.
Academic OneFile. Web. 12 Apr. 2014.
<http://go.galegroup.com/ps/i.do?id=GALE%7CA127799605&v=2.1&u=lom_ac
cessmich&it=r&p=AONE&sw=w&asid=da2f0bec8b14447931ae35d8ad88dfd2>.
Mariotto, Janice. ”Light Intensity.” Astronomy. In-class discussion. Sterling Heights High
School. March 2014.
Nave, R. "Heat Transfer." Hyper Physics. Copyright 2014. Web. 13 Apr. 2014.
<http://hyperphysics.phy-astr.gsu.edu/hbase/thermo/heatra.html>.
45. Harness – Polisuk-Balfour 42
NSIDC. “Artic Sea Ice News.” National Snow & Ice Data Center. Web. May 2014. 14
May 2014. < http://nsidc.org/arcticseaicenews/>.
Parry, Wynne. "10 Things You Need to Know about Arctic Sea Ice."LiveScience.
TechMedia Network, 23 Aug. 2012. Web. 28 May 2014.
<http://www.livescience.com/22651-facts-about-sea-ice.html>.
Stacey, Andrew. “Ice Albedo Effect.” The Azimuth Project. Web. 7 November 2011. 28
April 2014. <http://www.azimuthproject.org/azimuth/show/Ice+albedo+effect>.
"Unstable Antarctica: What's Driving Ice Loss?" Unstable Antarctica: What's Driving Ice
Loss? N.p., n.d. Web. 29 May 2014.
46. Harness – Polisuk-Balfour 43
Appendix A: Randomization with TI-Nspire CX
Materials:
TI-Nspire CX Graphing Calculator
Procedure:
1. Turn on TI-Nspire CX calculator.
2. Add a calculator page to the document.
3. Hit menu button.
4. Select option five: Probability.
5. Select option four: Random.
6. Select option two: Integer.
7. Input the minimum value in the random number set.
8. Hit the comma button, then input the maximum value of the random number set.
9. Hit enter and use the random number that came up as the first selection.
10. Hit enter and use the random number that comes up as the next choice until all
numbers/options available have been selected.
47. Harness – Polisuk-Balfour 44
Appendix B: Light Intensity Calculation
𝑊𝑎𝑡𝑡𝑠
4𝜋𝑟2
25 𝑊𝑎𝑡𝑡𝑠
4𝜋0.3𝑚2
= 22.1049 𝑊/4𝜋𝑟2
Figure 20. Sample Calculation of Light Intensity
Figure 20 displays a formula and sample calculation which determined the
different values of light intensity for the experiment. The bulb, or Sun, always generated
25 Watts for each and every trial, while the distances were always adjusted; in this case it
was 0.3 meters.
48. Harness – Polisuk-Balfour 45
Appendix C: Percent Change Calculation
𝐼𝑛𝑖𝑡𝑖𝑎𝑙 𝑀𝑎𝑠𝑠 − 𝐹𝑖𝑛𝑎𝑙 𝑀𝑎𝑠𝑠
𝐼𝑛𝑖𝑡𝑖𝑎𝑙 𝑀𝑎𝑠𝑠
× 100
7.12 − 6.56
7.12
× 100 = 7.8652%
Figure 21. Percent Change Equation and Sample Calculation
Figure 21 shows the equation used to determine the percentage change values.
The percentage change for the mass of an object will be determined by its final mass
taken from its initial mass and divided by its initial mass times 100 to place it in
percentage form.
49. Harness – Polisuk-Balfour 46
Appendix D: Alternate Interior Angles Examples
Figure 22. Alternate Interior Angles Example
Figure 22 displays an example of how the angle of which the light appeared to be
from the surface was determined. In a square, each angle must add up to 360˚ (all of
which are 90 ˚angles), but in a triangle, each angle must add up to a total of 180˚. Since a
right triangle automatically consists of one angle at 90˚, the other two must add up to the
same value. If Figure 6, angle B is projected at a 50˚ angle, to determine the other side,
angle B and the 90˚ angle are added together and subtracted from the total of 180˚ to get
the value of angle A or 40˚. This method helped determine what angle of tilt that the lamp
must have in order to properly match the angle seen from the surface.
A
B
50˚
40˚
40˚
90˚
90˚50˚