Download to read offline
![International Research Journal of Engineering and Technology (IRJET) e-ISSN: 2395-0056
Volume: 09 Issue: 04 | Apr 2022 www.irjet.net p-ISSN: 2395-0072
© 2022, IRJET | Impact Factor value: 7.529 | ISO 9001:2008 Certified Journal | Page 3263
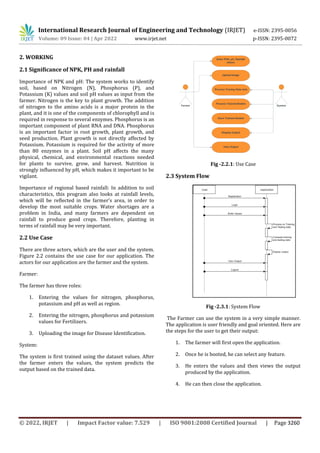
Fig -4.1: System Accuracy 2
CONCLUSIONS
Agriculture is the backbone of India. By developing a Soil
Profile-based crop prediction System, we want to provide
a simple solution. Crop productivity can be improved by
implementing this system. It is possible to avoid land loss
due to over use of fertilizers or under use of fertilizers. It
may help farmers boost their profit margins by reducing
the use of superfluous fertilizers and avoiding the
production of incorrect crops. The main goal of our
application is to assist farmers in making better crop
productivity decisions, as well as to assist farmers in
deciding what crops to cultivate based on the rainfall
conditions in the region. We will also assist farmers in
deciding what fertilizers to apply in order to avoid over
fertilization or under fertilization problems, resulting in a
higher yield.
ACKNOWLEDGEMENT
We sincerely thank Atharva College of Engineering for
giving us a platform to prepare a project on the topic “Soil
profile based crop prediction system” and would like to
thank our Principal Dr. Shrikant Kallurkar for instigating
within us the need for this research and giving us the
opportunities and time to conduct research on the topic.
We are truly grateful for having Prof. Mahendra Patil as
our guide and Dr. Suvarna Pansambal, Head of Computer
Engineering Department, and our project co-ordinator
Prof. Shweta Sharma. However, this research would not
have been possible without the understanding,
cooperation and help of our friends and family.
REFERENCES
[1] Soumaya Lamrhari ; Hamid Elghazi ; Tayeb Sadiki ;
Abdellatif El Faker “A profile-based Big data
architecture for agricultural context”, 2016
International Conference on Electrical and
Information Technologies (ICEIT) Year: 2016
[2] https://www.noble.org/news/publications/ag-news-
and-views/2007/january/back-to-basics-the-roles-of-
n-p-k-and-their-sources/ (Date: 25th October 2018)
[3] https://www.pioneer.com/home/site/us/agronomy/
library/managing-soil-pH (Date: 25th October 2018)
[4] Data mining in Agriculture on crop price prediction:
Techniques and Applications M Kaur, H Gulati, H
Kundra - International Journal of Computer
Applications
[5] R. Sujatha, Dr. P.Isakki,A Study on Crop Yield
Forecasting Using Classification Techniques, 978-1-
4673- 8437-7/16/$31.00 ©2016 IEEE.
[6] https://www.kaggle.com/datasets/atharvaingle/crop
-recommendation-dataset
[7] https://github.com/Gladiator07/Harvestify/blob/ma
ster/Data-processed/fertilizer.csv
[8] https://www.kaggle.com/datasets/vipoooool/new-
plant-diseases-dataset](https://image.slidesharecdn.com/irjet-v9i4431-220928064556-0cfad656/85/Soil-Profile-Based-Crop-Prediction-System-5-320.jpg)

This document describes a soil profile-based crop prediction system developed by students and a professor from Atharva College of Engineering. The system takes soil parameters like nitrogen, phosphorus, potassium, and pH levels as input from a farmer, along with rainfall data and region. It then uses these factors and a machine learning algorithm to predict the most suitable crops for that soil and climate condition. The system also suggests fertilizers that could improve soil quality and increase crop yields. It is intended to help farmers in India select appropriate crops and avoid failures due to unsuitable conditions or improper fertilizer use. The document outlines the working, accuracy testing, and conclusions of the system.


![NICEDT-2025-presentation-Paper72[1].pptx](https://cdn.slidesharecdn.com/ss_thumbnails/nicedt-2025-presentation-paper721-250430133428-32342ded-thumbnail.jpg?width=640&height=640&fit=bounds)


