Download to read offline
![Please cite this article in press as: L. G, et al., An automated low cost IoT based Fertilizer Intimation System for smart agriculture, Sustain.
Comput.: Inform. Syst. (2018), https://doi.org/10.1016/j.suscom.2019.01.002
ARTICLE IN PRESS
G Model
SUSCOM-300; No.of Pages12
Sustainable Computing: Informatics and Systems xxx (2018) xxx–xxx
Contents lists available at ScienceDirect
Sustainable Computing: Informatics and Systems
journal homepage: www.elsevier.com/locate/suscom
An automated low cost IoT based Fertilizer Intimation System for
smart agriculture
Lavanya Ga
, Rani Cb
, Ganeshkumar Pc,∗
a
Department of Information Technology, Sri Krishna College of Technology, Coimbatore, Tamil Nadu, India
b
Department of Computer Science and Engineering, Government College of Engineering, Salem, Tamil Nadu, India
c
Department of Information Technology, Anna University Regional Campus Coimbatore, Tamil Nadu, India
a r t i c l e i n f o
Article history:
Received 15 June 2018
Received in revised form 31 October 2018
Accepted 8 January 2019
Available online xxx
Keywords:
Internet of things
Soil nutrients
Colorimetric principle
Sensor network
Fuzzy systems
a b s t r a c t
This paper presents an Internet of Things (IoT) based system by designing a novel Nitrogen-Phosphorus-
Potassium (NPK) sensor with Light Dependent Resistor (LDR) and Light Emitting Diodes (LED). The
principle of colorimetric is used to monitor and analyze the nutrients present in the soil. The data sensed
by the designed NPK sensor from the selected agricultural fields are sent to Google cloud database to
support fast retrieval of data. The concept of fuzzy logic is applied to detect the deficiency of nutrients
from the sensed data. The crisp value of each sensed data is discriminated into five fuzzy values namely
very low, low, medium, high and very high during fuzzification. A set of If-then rules are framed based
on individual chemical solutions of Nitrogen (N), Phosphorous (P) and Potassium (K). Mamdani inference
procedure is used to derive the conclusion about the deficiency of N, P and K available in soil chosen for
testing and accordingly an alert message is sent to the farmer about the quantity of fertilizer to be used at
regular intervals. The proposed hardware prototype and the software embedded in the microcontroller
are developed in Raspberry pi 3 using Python. The developed model is tested in three different soil sam-
ples like red soil, mountain soil and desert soil. It is observed that the developed system results in linear
variation with respect to the concentration of the soil solution. A sensor network scenario is created using
Qualnet simulator to analyze the performance of designed NPK sensor in terms of throughput, end to end
delay and jitter. From the different variety of experiments conducted, it is noticed that the developed IoT
system is found to be helpful to the farmers for high yielding of crops.
© 2019 Elsevier Inc. All rights reserved.
1. Introduction
Agriculture [1] is the major occupation that contributes to over-
coming food scarcity. It will be successful only when the farmers
are able to produce high yield in their cultivation. Lower the yield
of cultivation in agricultural field [2] effects the revenue generation
of the developing country. One of the major reasons for low yield
is the improper use of fertilizers by the farmers. The fertilizers can
be added at appropriate quantity during the lack of nutrients in the
soil. Hence, testing the soil for the nutrients available for the plant
growth is inevitable before adding fertilizer. Soil testing is widely
conducted to estimate the availability of nutrients present in the
soil for plant growth. Determination of fertilizer recommendation
[3] for effective plant growth is the main outcome of soil testing.
∗ Corresponding author.
E-mail addresses: g.lavanya@skct.edu.in (L. G), rani23508@gmail.com (R. C),
ganesh23508@gmail.com (G. P).
But soil testing is rarely done by the farmers because of its complex
laboratory procedure [4]. In general soil testing for the nutrients
[45] is carried out manually in commercial laboratories that can-
not facilitate the farmers because of more time consumption and
high cost.
Few impacts of soil testing are to avoid the excessive use of
fertilizer and minimize the fertilizer expenditure. Also the ability
of farmers to protect the fertility of soil by knowing the cur-
rent condition of the soil is improved [24]. Further it helps to
avoid soil degradation. Generally, Soil testing [5] is done for soil
pH, macronutrients like nitrogen, potassium and phosphorus and
micronutrients test for another mineral like zinc, calcium, copper,
lead, etc., in a separate method. Different Instruments of soil testing
are atomic absorption spectrophotometers, Inductively Coupled
Plasma Spectrometers (ICPs), Lachat Flow Injection Analyzer, col-
orimeters and general laboratory equipment. Each instrument uses
a principle of chemical analysis, electrolysis, spectroscopy, colori-
metric, etc.
https://doi.org/10.1016/j.suscom.2019.01.002
2210-5379/© 2019 Elsevier Inc. All rights reserved.](https://image.slidesharecdn.com/csgk0f0wvv2ae6vkadmifue2jvq635-220130180815/75/An-automated-low-cost-IoT-based-Fertilizer-Intimation-System-forsmart-agriculture-1-2048.jpg)
![Please cite this article in press as: L. G, et al., An automated low cost IoT based Fertilizer Intimation System for smart agriculture, Sustain.
Comput.: Inform. Syst. (2018), https://doi.org/10.1016/j.suscom.2019.01.002
ARTICLE IN PRESS
G Model
SUSCOM-300; No.of Pages12
2 L. G et al. / Sustainable Computing: Informatics and Systems xxx (2018) xxx–xxx
Soil test for macronutrients is carried out separately for nitro-
gen, phosphorus and potassium [44], which is time-consuming and
not economic for the farmers. Ezeokonkwo [6] performed a man-
ual experiment with different proportion of NPK fertilizers added
at different levels (low, adequate and excess) of nutrient soil to ana-
lyze the engineering properties of soil. Even though the experiment
inform the farmer about how the use of the excess of fertilizer affect
the soil properties like unit weight, water content, tensile strength,
permeability and so on it is a laborious process.
Developed countries encourage their farmers to digitize the tra-
ditional way of doing things in a smarter way with the support
from the Internet of Things (IoT) [25,28–33]. IoT is the concept
of networking the physical objects with the ability to transfer the
data from sensors [26] over the internet. The significant reason for
IoT appearance [27] in today’s world is to automate a system and
provide a remote control and monitoring over the system through
internet. This paper discusses the development of an IoT based sys-
tem with the help of a novel NPK sensor and fuzzy algorithm to
facilitate the farmers about the awareness of soil nutrients defi-
ciency and appropriate fertilizer to be added to the fields at right
time.
The key contributions of the proposed research are:
(i) Design of novel NPK sensor by incorporating the colorimet-
ric principle using Light Dependent Resistor (LDR) and Light
Emitting Diodes (LEDs)
(ii) Integration of NPK sensor with the software embedded in
microcontroller unit for analyzing the sensed value
(iii) Development of a fuzzy rule-based system to analyze the
sensed value to decide upon the proportions of N, P and K in
the soil at edge level.
(iv) Internet-based user-friendly and automated intimation sys-
tem at regular intervals of time to the farmers’ electronics
gadgets.
This paper comprises of review of related work in Section 2, pro-
posed system design described in Section 3, IoT layered protocols
implemented in the system described in Section 4, simulation of
extended system as wireless sensor network is explained in Sec-
tion 5, hardware implementation and test results in Section 6 and
the conclusion in Section 7.
2. Related work
This section enlightens with the allusions related to the progress
of our solution stage by stage with appropriate principle involved
in design of sensor and analysis of soil nutrients.
One of the accurate methods to detect the chemicals in the
solution is using the colorimetric principle. Doyle et al. [7] exper-
imented the presence of carbon and nitrogen in soil extract in the
laboratory. Yong he et al. [8], proposed a colorimetric-based analy-
sis to detect the urinalysis dipsticks in urine samples. Henrikenson
and Olsen [9] determine the occurrence of nitrite and nitrate in
water and soil extract using colorimetric principle. Regalado and
Cruz [10] analyzed soil pH and nutrients level especially the pres-
ence of nitrogen, phosphorus and potassium in the soil using the
colorimetrical principle with the help of a color sensor. However,
the system failed to intimate the farmers about the kind of fertil-
izer to be used for a particular nutrient. Deepa et al. [11], focused
on detection of NPK nutrients using colorimetric principle with the
help of fiber optic channel for light transmission. Ben-dor and Banin
[3] proposed the infrared analysis to evaluate the soil properties.
However, it involves manual testing that becomes a laborious and
expensive task for the farmers. To the best of our knowledge it
is found that even though researchers performed experiments for
testing the nutrient level in the soil, the majority of the farmers are
unable to know the results and the required solution during the
cultivation. Hence in this paper, we propose a solution to conduct
the soil test for nutrients at the agricultural land using colorimetric
principle, by designing a novel sensor.
Many types of sensors were designed using the colorimetric
principle for various applications to perform the chemical prop-
erties. Dissanayake et al. [12] developed an optical sensor to detect
fluoride and pH level in order to analyze the water quality using col-
orimetric principle. Chen et al. [13], proposed a colorimetric-based
barcode sensor for food quality and spoilage based on a disposable
optical sensor. Kim et al. [14], proposed a portable array reader
to detect the color changes of the colorimetric strip responding to
various hazardous gases through the CMOS image sensor. Cheng
and Meng [15] proposed an optical sensor based on colorimetric
principle using the sensing film of a-naptholphthein as PolyIBM
layer. Kodir et al. [16], proposed a pesticide colorimetric sensor
using L-Cystene modified silver nano-particles. All the above sen-
sor design work is based on the components that emit color lights
and reflection of the same with different intensity. These devices
are high-cost CMOS devices. Hence in this paper, we propose a
novel sensor design using the colorimetric principle to determine
the level of N, P and K in the soil with color LEDs and a light absorber
LDR.
In general, the analysis of nutrient deficiency is examined at the
measurement side using a microprocessor unit. A suitable logical
system is required to analyze the soil nutrient level from the results
of the sensor at the edge level. Since the sensor data acquired from
NPK sensor is vague and uncertain, it becomes difficult to make
decision on the soil nutrients level. Many studies reported that
the problems with uncertain data in any field of engineering can
be solved by a fuzzy rule-based system (FRBS) to ensure accurate
decision. Owing to the success of FRBS for decision making in vague
environment, the author turned their attention to refer papers deal-
ing with the implementation of fuzzy basic for edge analysis of
sensor data.
Zakarian [17] proposed a fuzzy logic and approximate rule-
based reasoning approach for the analysis of process model to
represent uncertain process variables. Dutu et al. [18], performed
an analysis on fuzzy rule-based systems by generating fuzzy rules
from numerical data. The fuzzy rule-based system greatly improves
the accuracy for growing complex real-world problems. According
to Feng [19], the fuzzy system can be employed in the sophis-
ticated intelligent control system and identification of uncertain
parameters.
Zulfikar et al. [20] implemented the Mamdani fuzzy system and
found that the model has 91.4% accuracy to make suitable decision
on an uncertain situation. Hong and Lee [21] proposed a learning
method that reduces and human effort in the development of a
fuzzy expert system for deriving the membership functions and
fuzzy if-then rules. GaneshKumar et al. [22], proposed an improved
technique to extract a fuzzy rule set and tune the membership func-
tion using enhanced particle swam optimization. Fuzzy inference
system is also employed in interference reduction [23] of cognitive
radio networks. In this paper, we propose a fuzzy rule-based anal-
ysis to identify the soil nutrients. It is implemented using Mamdani
inference procedure that has NPK sensor data as input with three
nutrients level (N,P and K) as output.
3. Proposed IoT system for fertilizer intimation
Due to the limitations prevailing in the conventional way of test-
ing the soil in the laboratory and then reporting to the farmers to
start cultivating the land, this paper suggests an IoT system that
monitors the nutrients present in the soil and then alert the farmer](https://image.slidesharecdn.com/csgk0f0wvv2ae6vkadmifue2jvq635-220130180815/75/An-automated-low-cost-IoT-based-Fertilizer-Intimation-System-forsmart-agriculture-2-2048.jpg)
![Please cite this article in press as: L. G, et al., An automated low cost IoT based Fertilizer Intimation System for smart agriculture, Sustain.
Comput.: Inform. Syst. (2018), https://doi.org/10.1016/j.suscom.2019.01.002
ARTICLE IN PRESS
G Model
SUSCOM-300; No.of Pages12
L. G et al. / Sustainable Computing: Informatics and Systems xxx (2018) xxx–xxx 3
Fig. 1. Block diagram of proposed IoT based Fertilizer Intimation System.
Fig. 2. Circuit diagram of NPK Sensor.
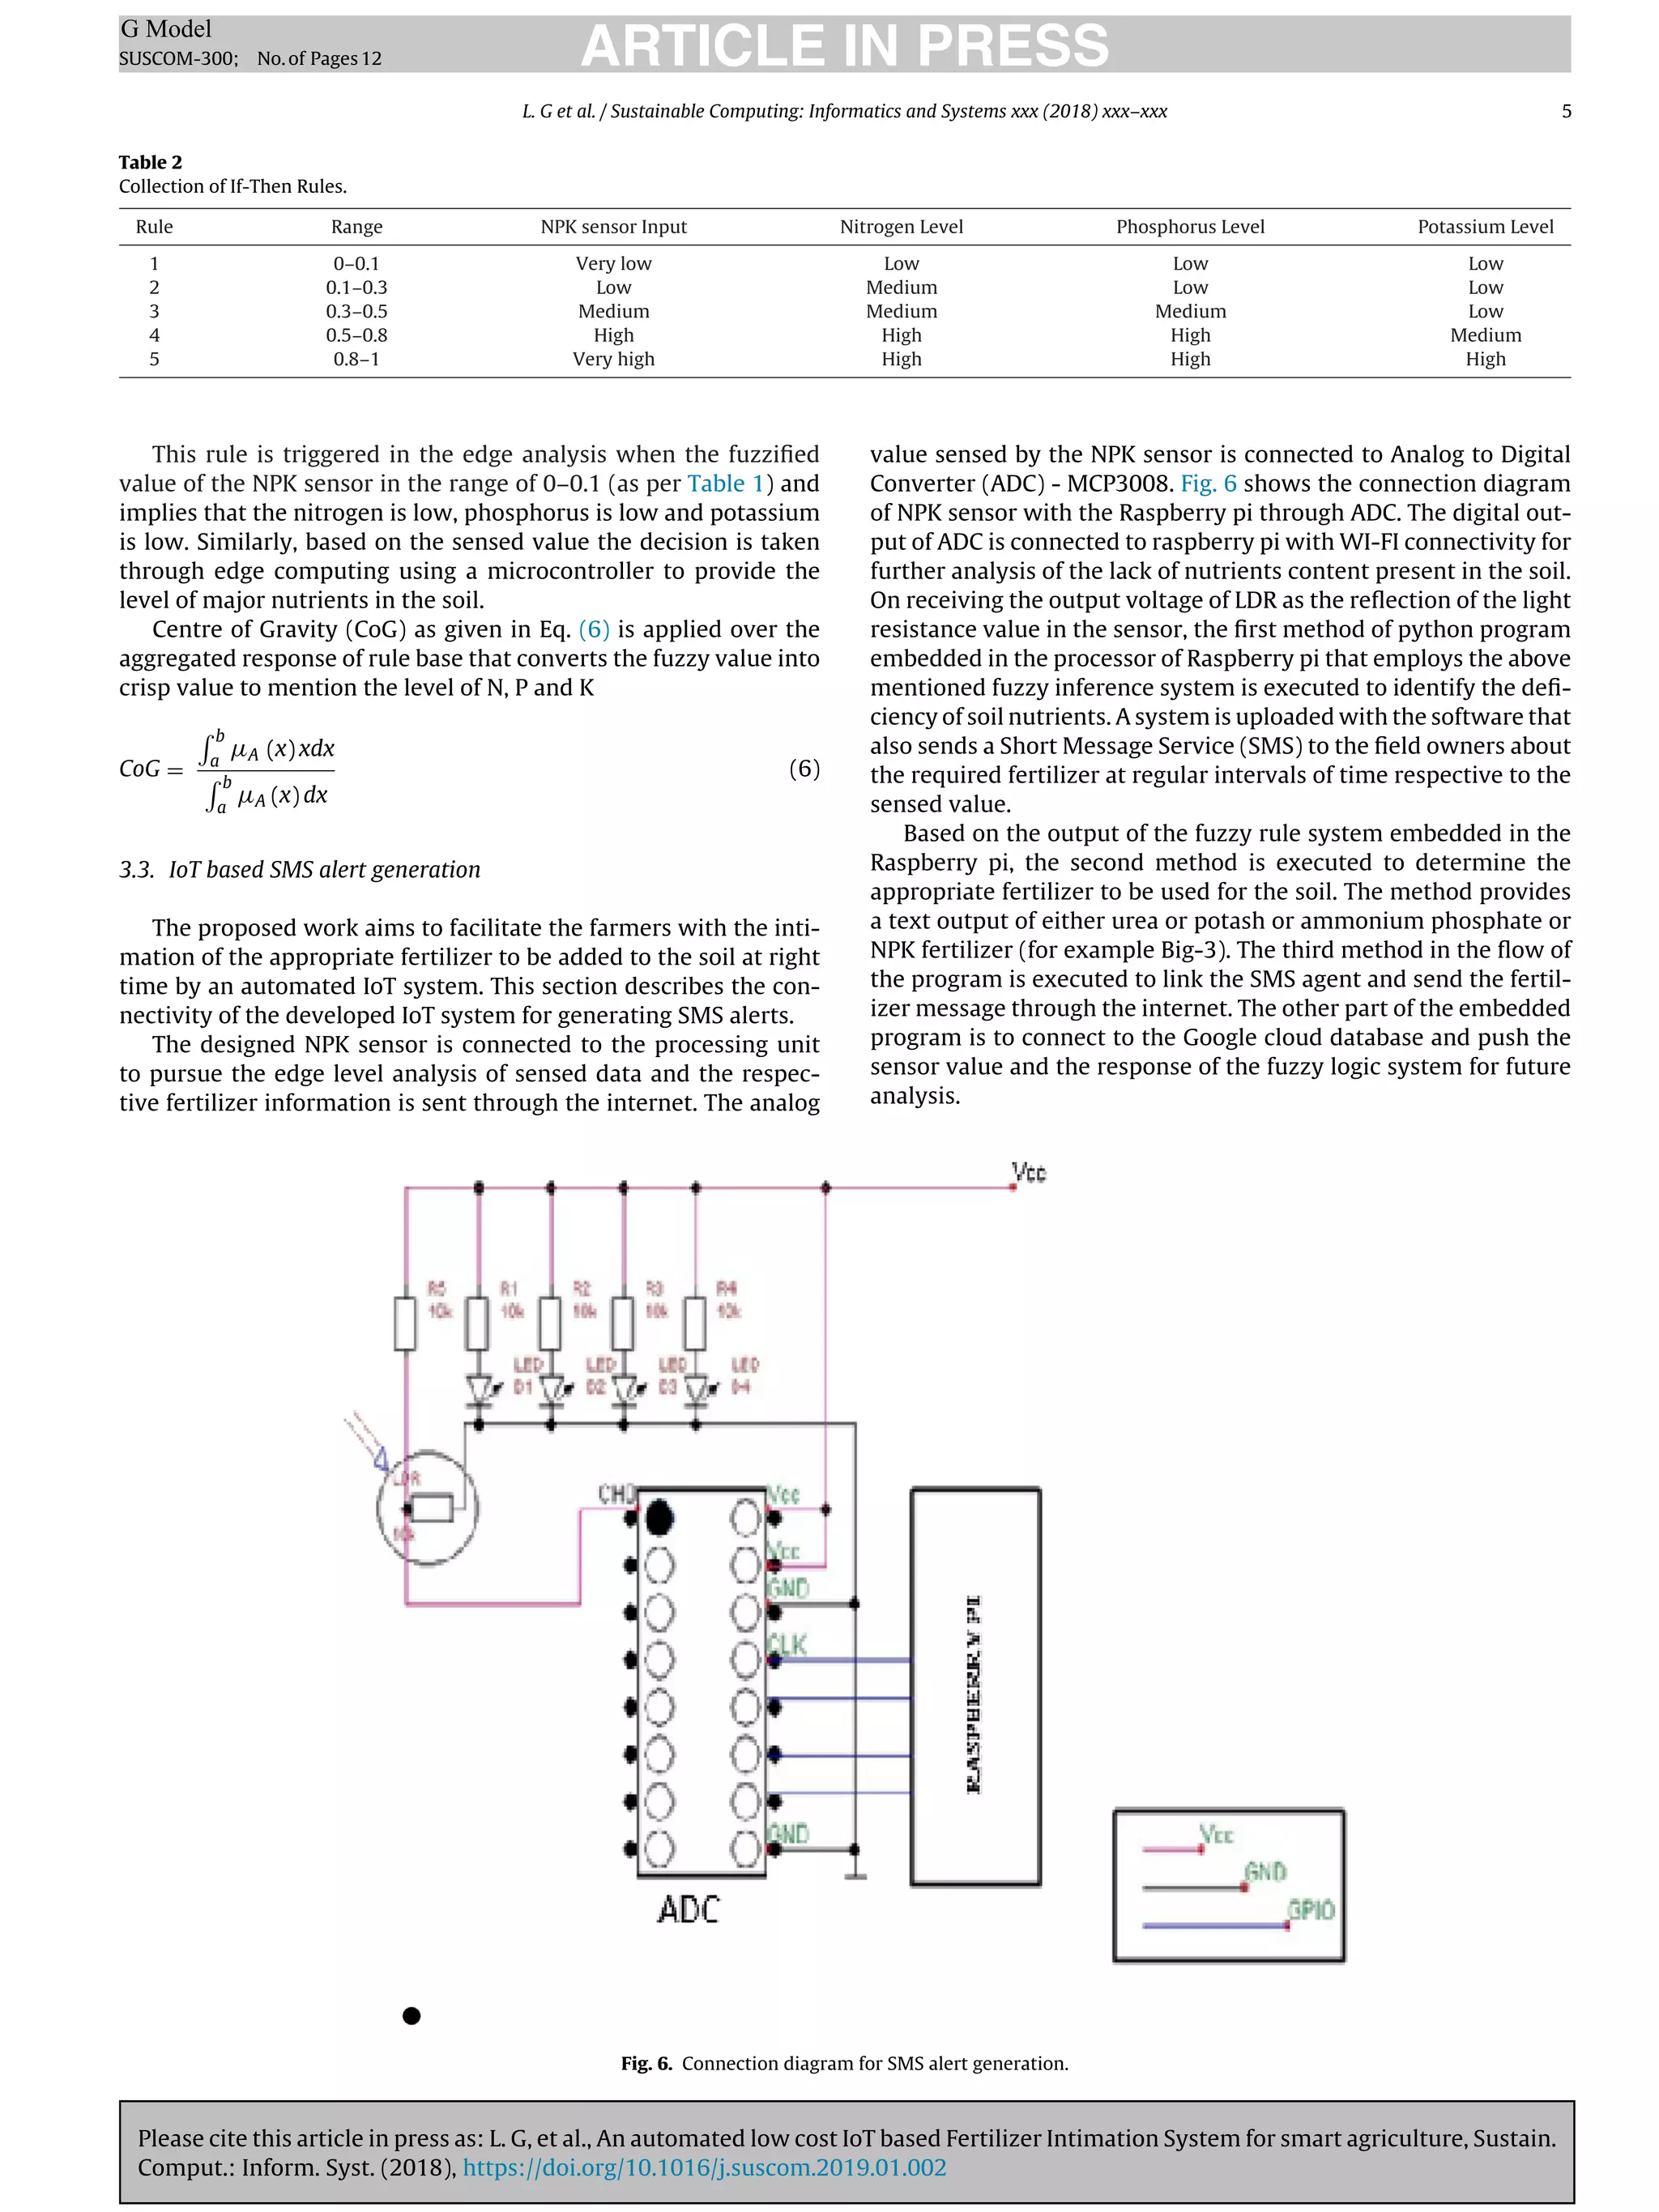
in their respective farm field about the quantity of fertilizer to be
used during cultivation of land. Fig. 1 shows the proposed IoT sys-
tem that senses the soil about the quantity of the nutrients present
in the soil. The development of the proposed IoT system can be illus-
trated under three phases viz., 1. Design of NPK sensor, 2. Analysis
of soil nutrient using Fuzzy Logic 3. SMS alert system to the farmer.
3.1. Design of NPK sensor
The proposed NPK sensor is designed using four different color
Light Emitting Diodes (LED), a Light Dependent Resistor (LDR) and
four Resistors. Fig. 2 shows the connection of components that
make the NPK sensor. In Fig. 2, Vcc is the input voltage (V), R1, R2,
R3 and R4 are resistors of 10 K to resist the current overflow in
LEDs, Vo is the output voltage across the LDR in V. The circuit design
given in Fig. 2 works as follows to sense the nutrients present in the
soil as listed below:
At first, LEDs emit the light on the soil solution chosen for test-
ing the nutrients level. Based on the colorimetric principle [7], light
Fig. 3. Construction of Fuzzy System for Soil Nutrient Analysis.
reflected from the soil solution depends on the chemical concen-
tration present in the soil. Reflected light from the soil solution is
absorbed by LDR as per the photoconductivity principle [12], and is
recorded depending on the amount of light absorbed. As per Beer-
Lambert law, the amount of light absorption (A) in LDR is given in
Eq. (1).
A = K × l × c (1)
where ‘K’ is the molar absorptivity, ‘l’ is the path length of the light
and ‘c’ is the concentration of the solution. The amount of light
reflected per unit area (Lux) varies with the resistance level (RL) in
LDR according to the Eq. (2) and it is used to calculate the output
voltage (Vo) across LDR as per Eq. (3)
RL =
500
Lux
(2)
Vo = I × RL (3)
This output voltage is the data sensed by the proposed NPK sen-
sor that gives the value of Nitrogen, Phosphorous, and Potassium
available in the soil selected for testing.
3.2. Analysis of soil nutrients
Once the data is sensed by the designed NPK sensor, then it is
analyzed to find the level of nitrogen, phosphorous and potassium
content in the soil. In general, there are two ways of analyzing the
sensor data, (i) Fog Computing and (ii) Edge Computing. The former
analyzes the sensed data using a processor that makes contact with
the physical world, while the latter analyzes the sensor data over
the internet at a centralized smaller edge server called as cloudlet
[29]. Since the data sensed by the proposed NPK sensor is the volt-
age based on the chemicals present in the soil solution, the analysis
is performed at the edge level to determine the level of N, P and K
in the soil.
Analyzing the NPK sensor data result in making the decision
about the quantity of fertilizer to be used before cultivation. This is
a complex task since the sensed data from soil solution are vague
with ambiguous boundaries among the values. To address the issue,
the concept of fuzzy logic is used to arrive at the definite conclusion
regarding the amount of fertilizer. The various steps in constructing
a fuzzy logic based sensor data analysis are shown in Fig. 3
Fuzzification is the task of partitioning the input variable and
assigning the linguistic label for each partition. In general, parti-
tioning is carried out based on the range of the sensed data value
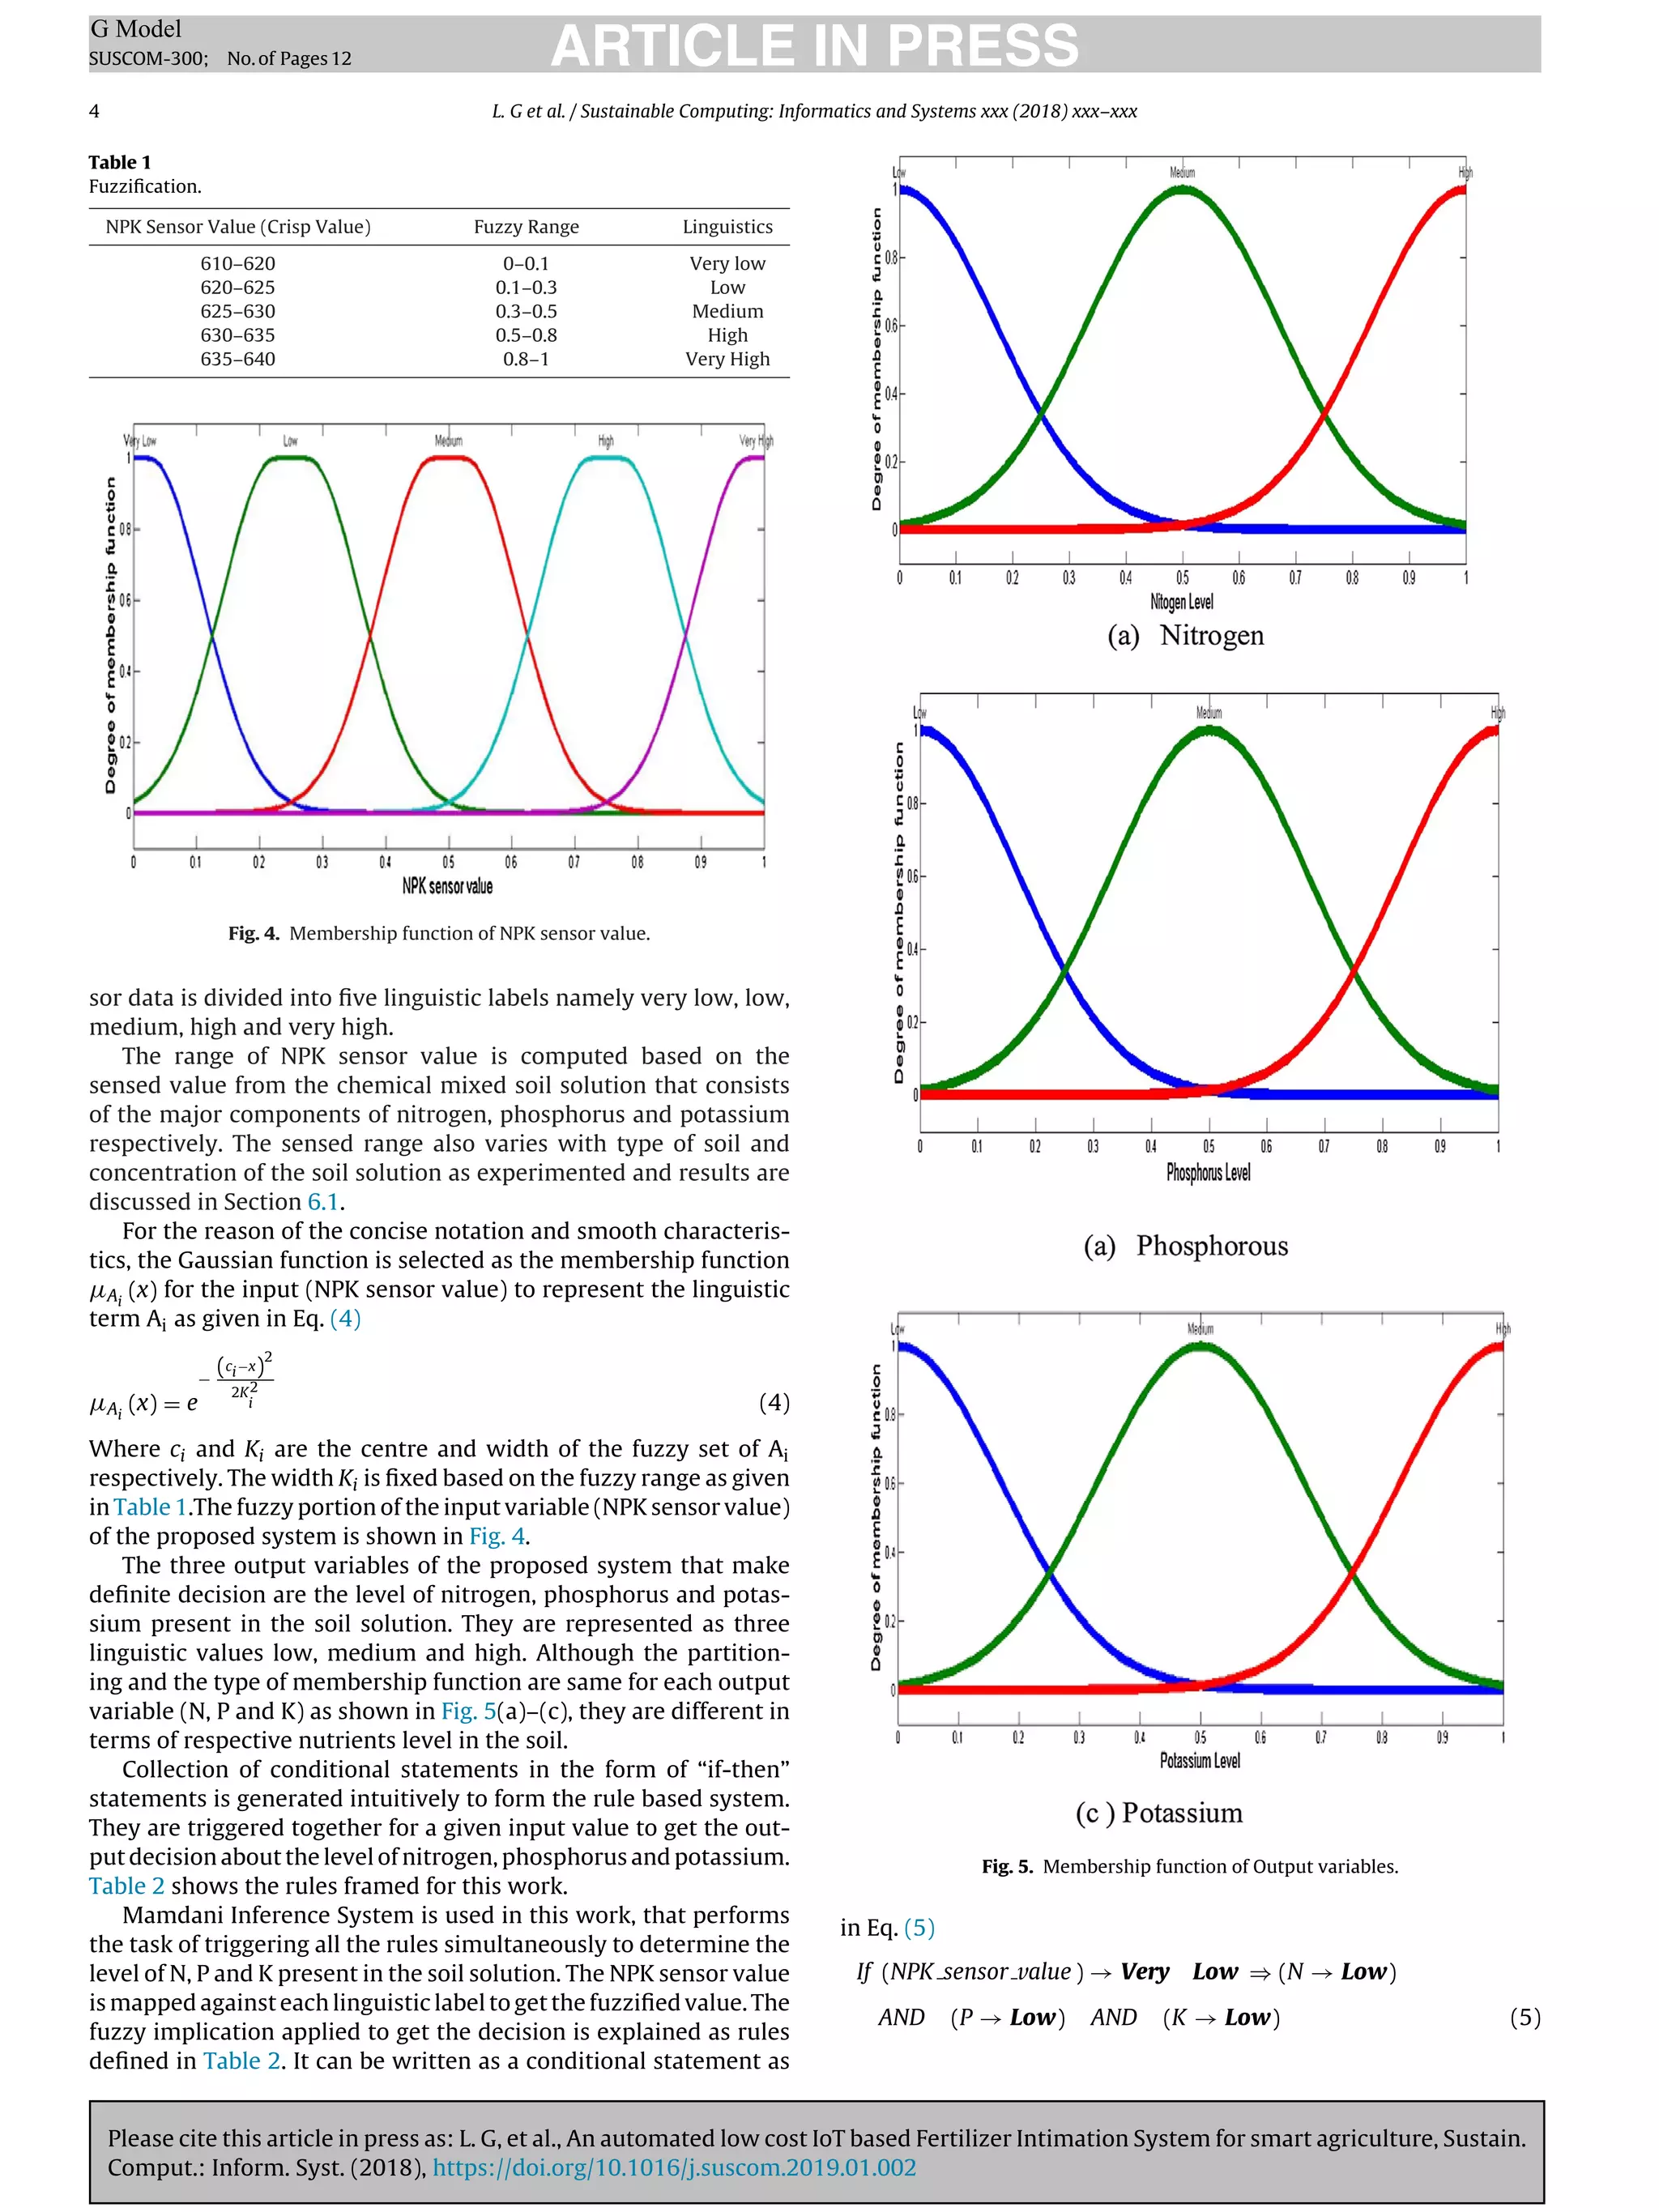
with little overlap in the range of each linguistic label. Table 1 shows
the range of linguistic values assigned for 50 g of red soil dissolved
in 100 ml of water. In this work, the crisp value of the NPK sen-](https://image.slidesharecdn.com/csgk0f0wvv2ae6vkadmifue2jvq635-220130180815/75/An-automated-low-cost-IoT-based-Fertilizer-Intimation-System-forsmart-agriculture-3-2048.jpg)
![Please cite this article in press as: L. G, et al., An automated low cost IoT based Fertilizer Intimation System for smart agriculture, Sustain.
Comput.: Inform. Syst. (2018), https://doi.org/10.1016/j.suscom.2019.01.002
ARTICLE IN PRESS
G Model
SUSCOM-300; No.of Pages12
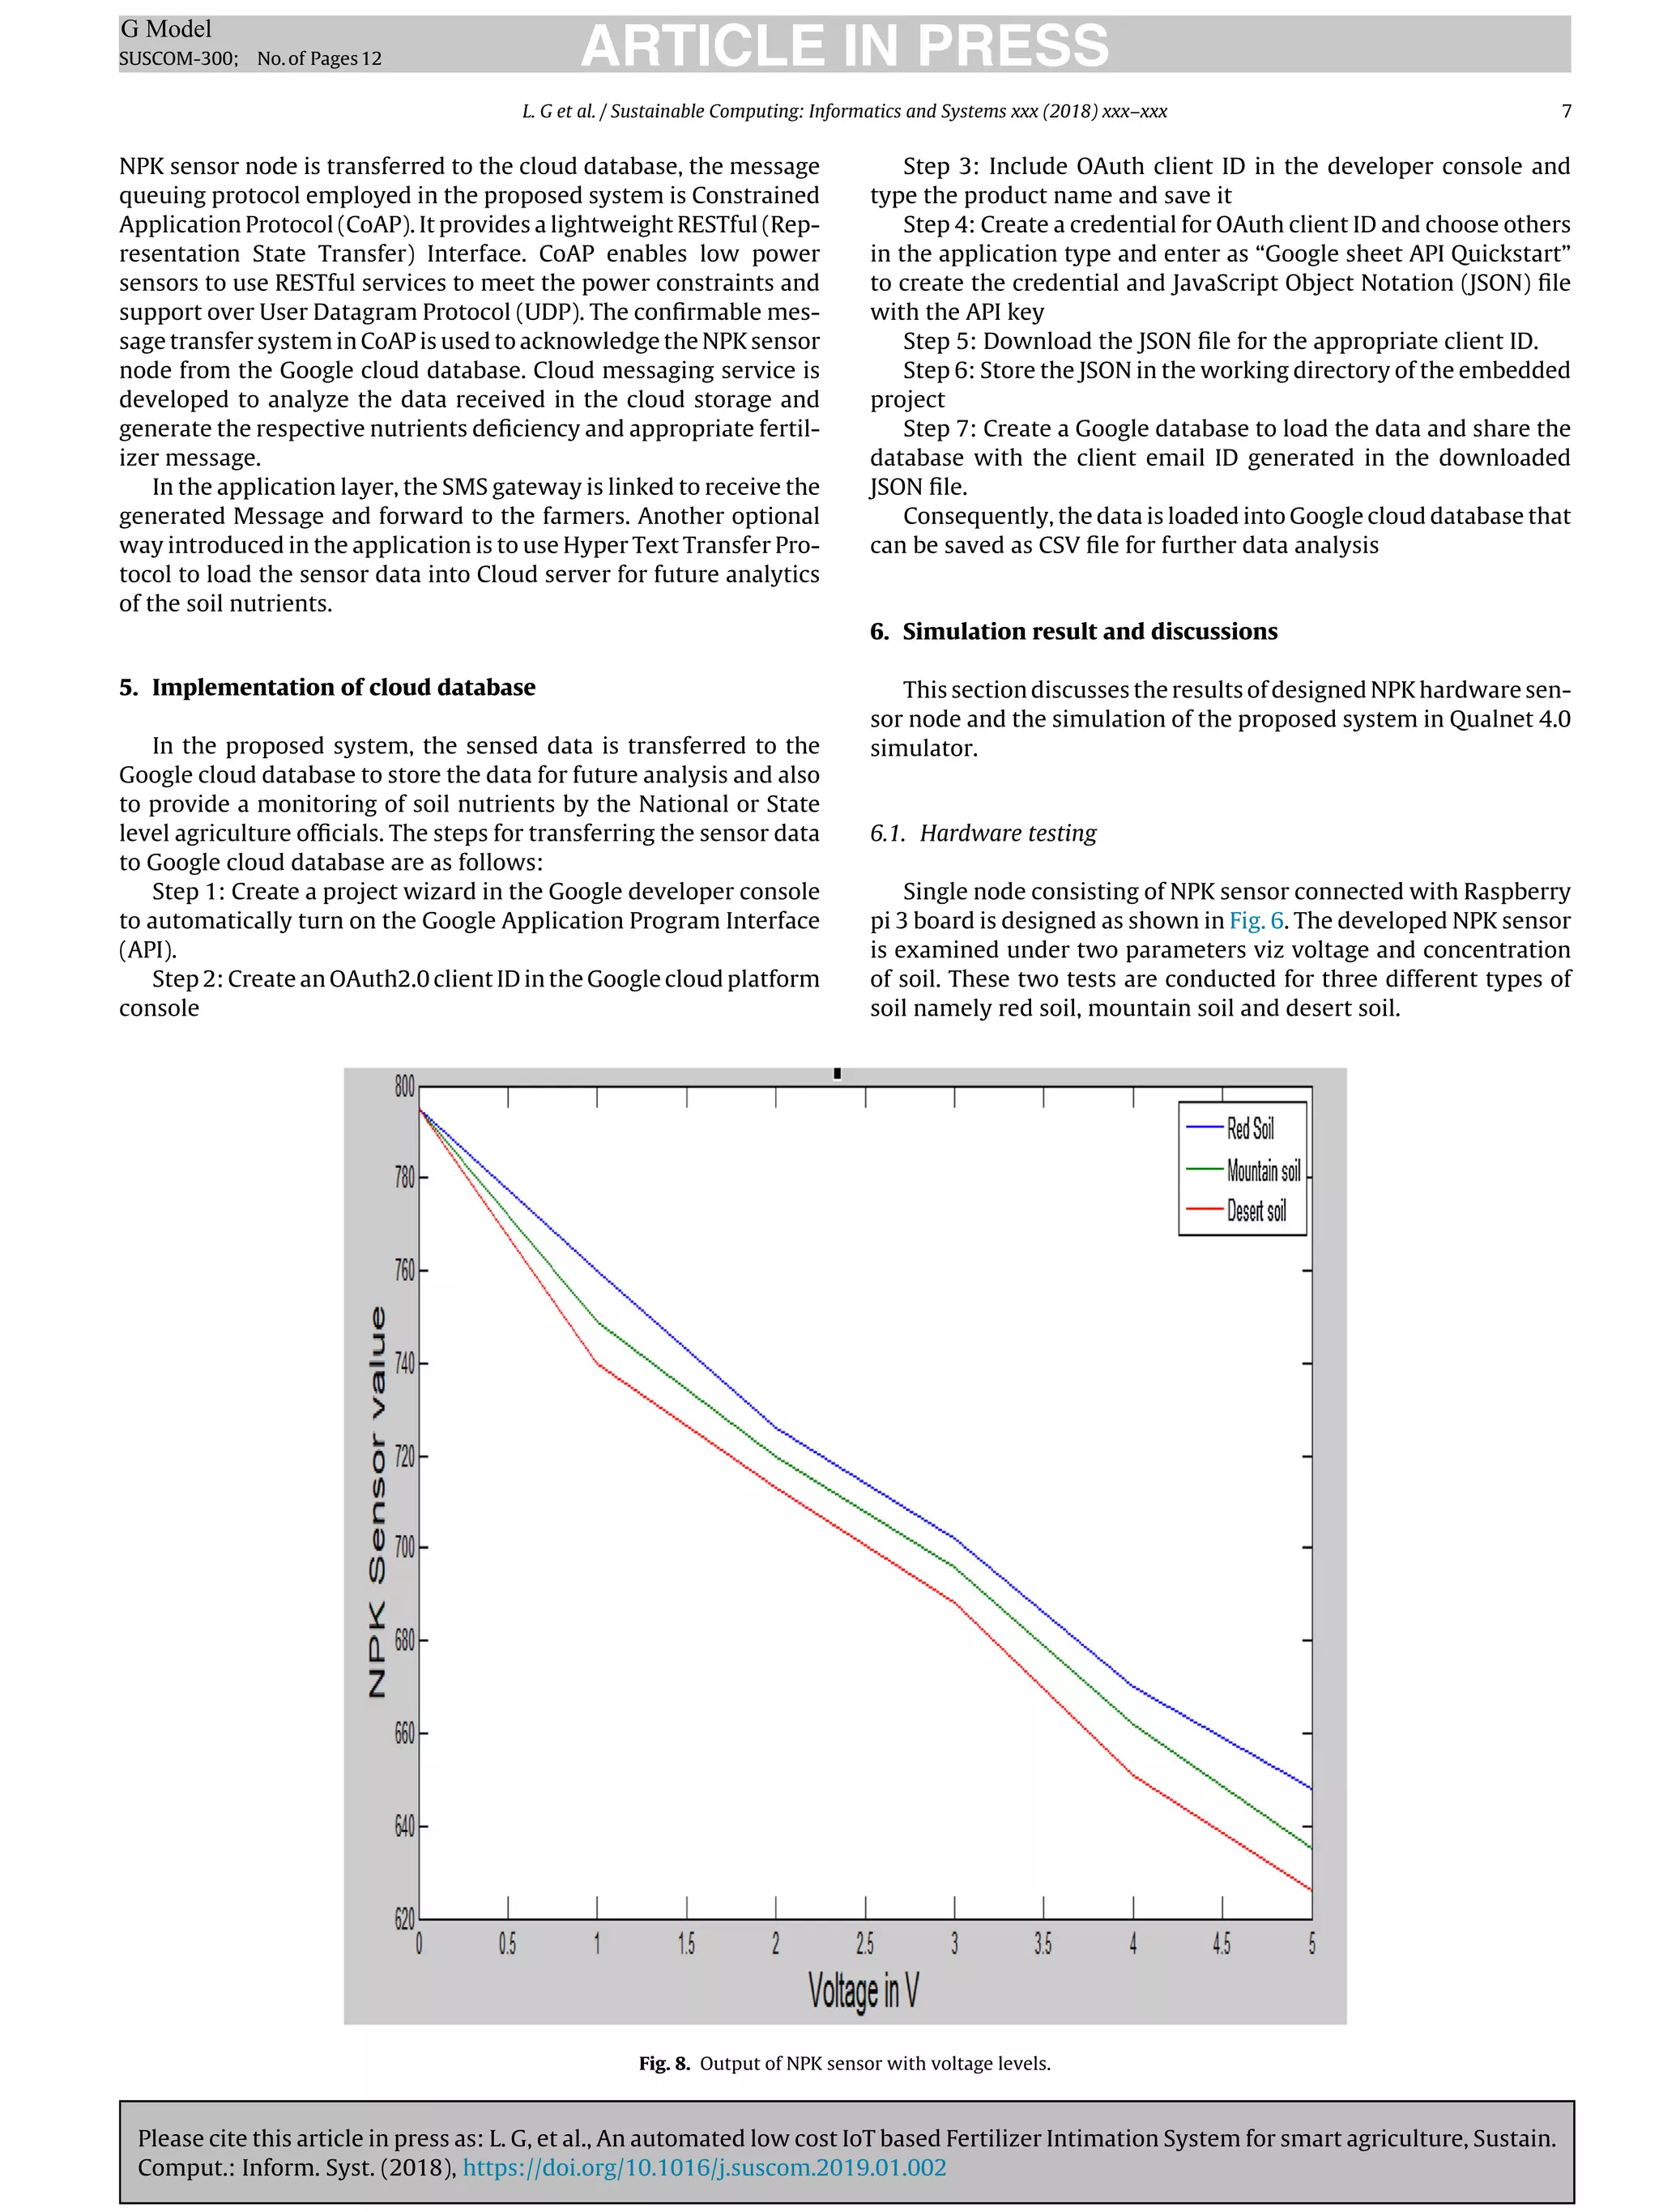
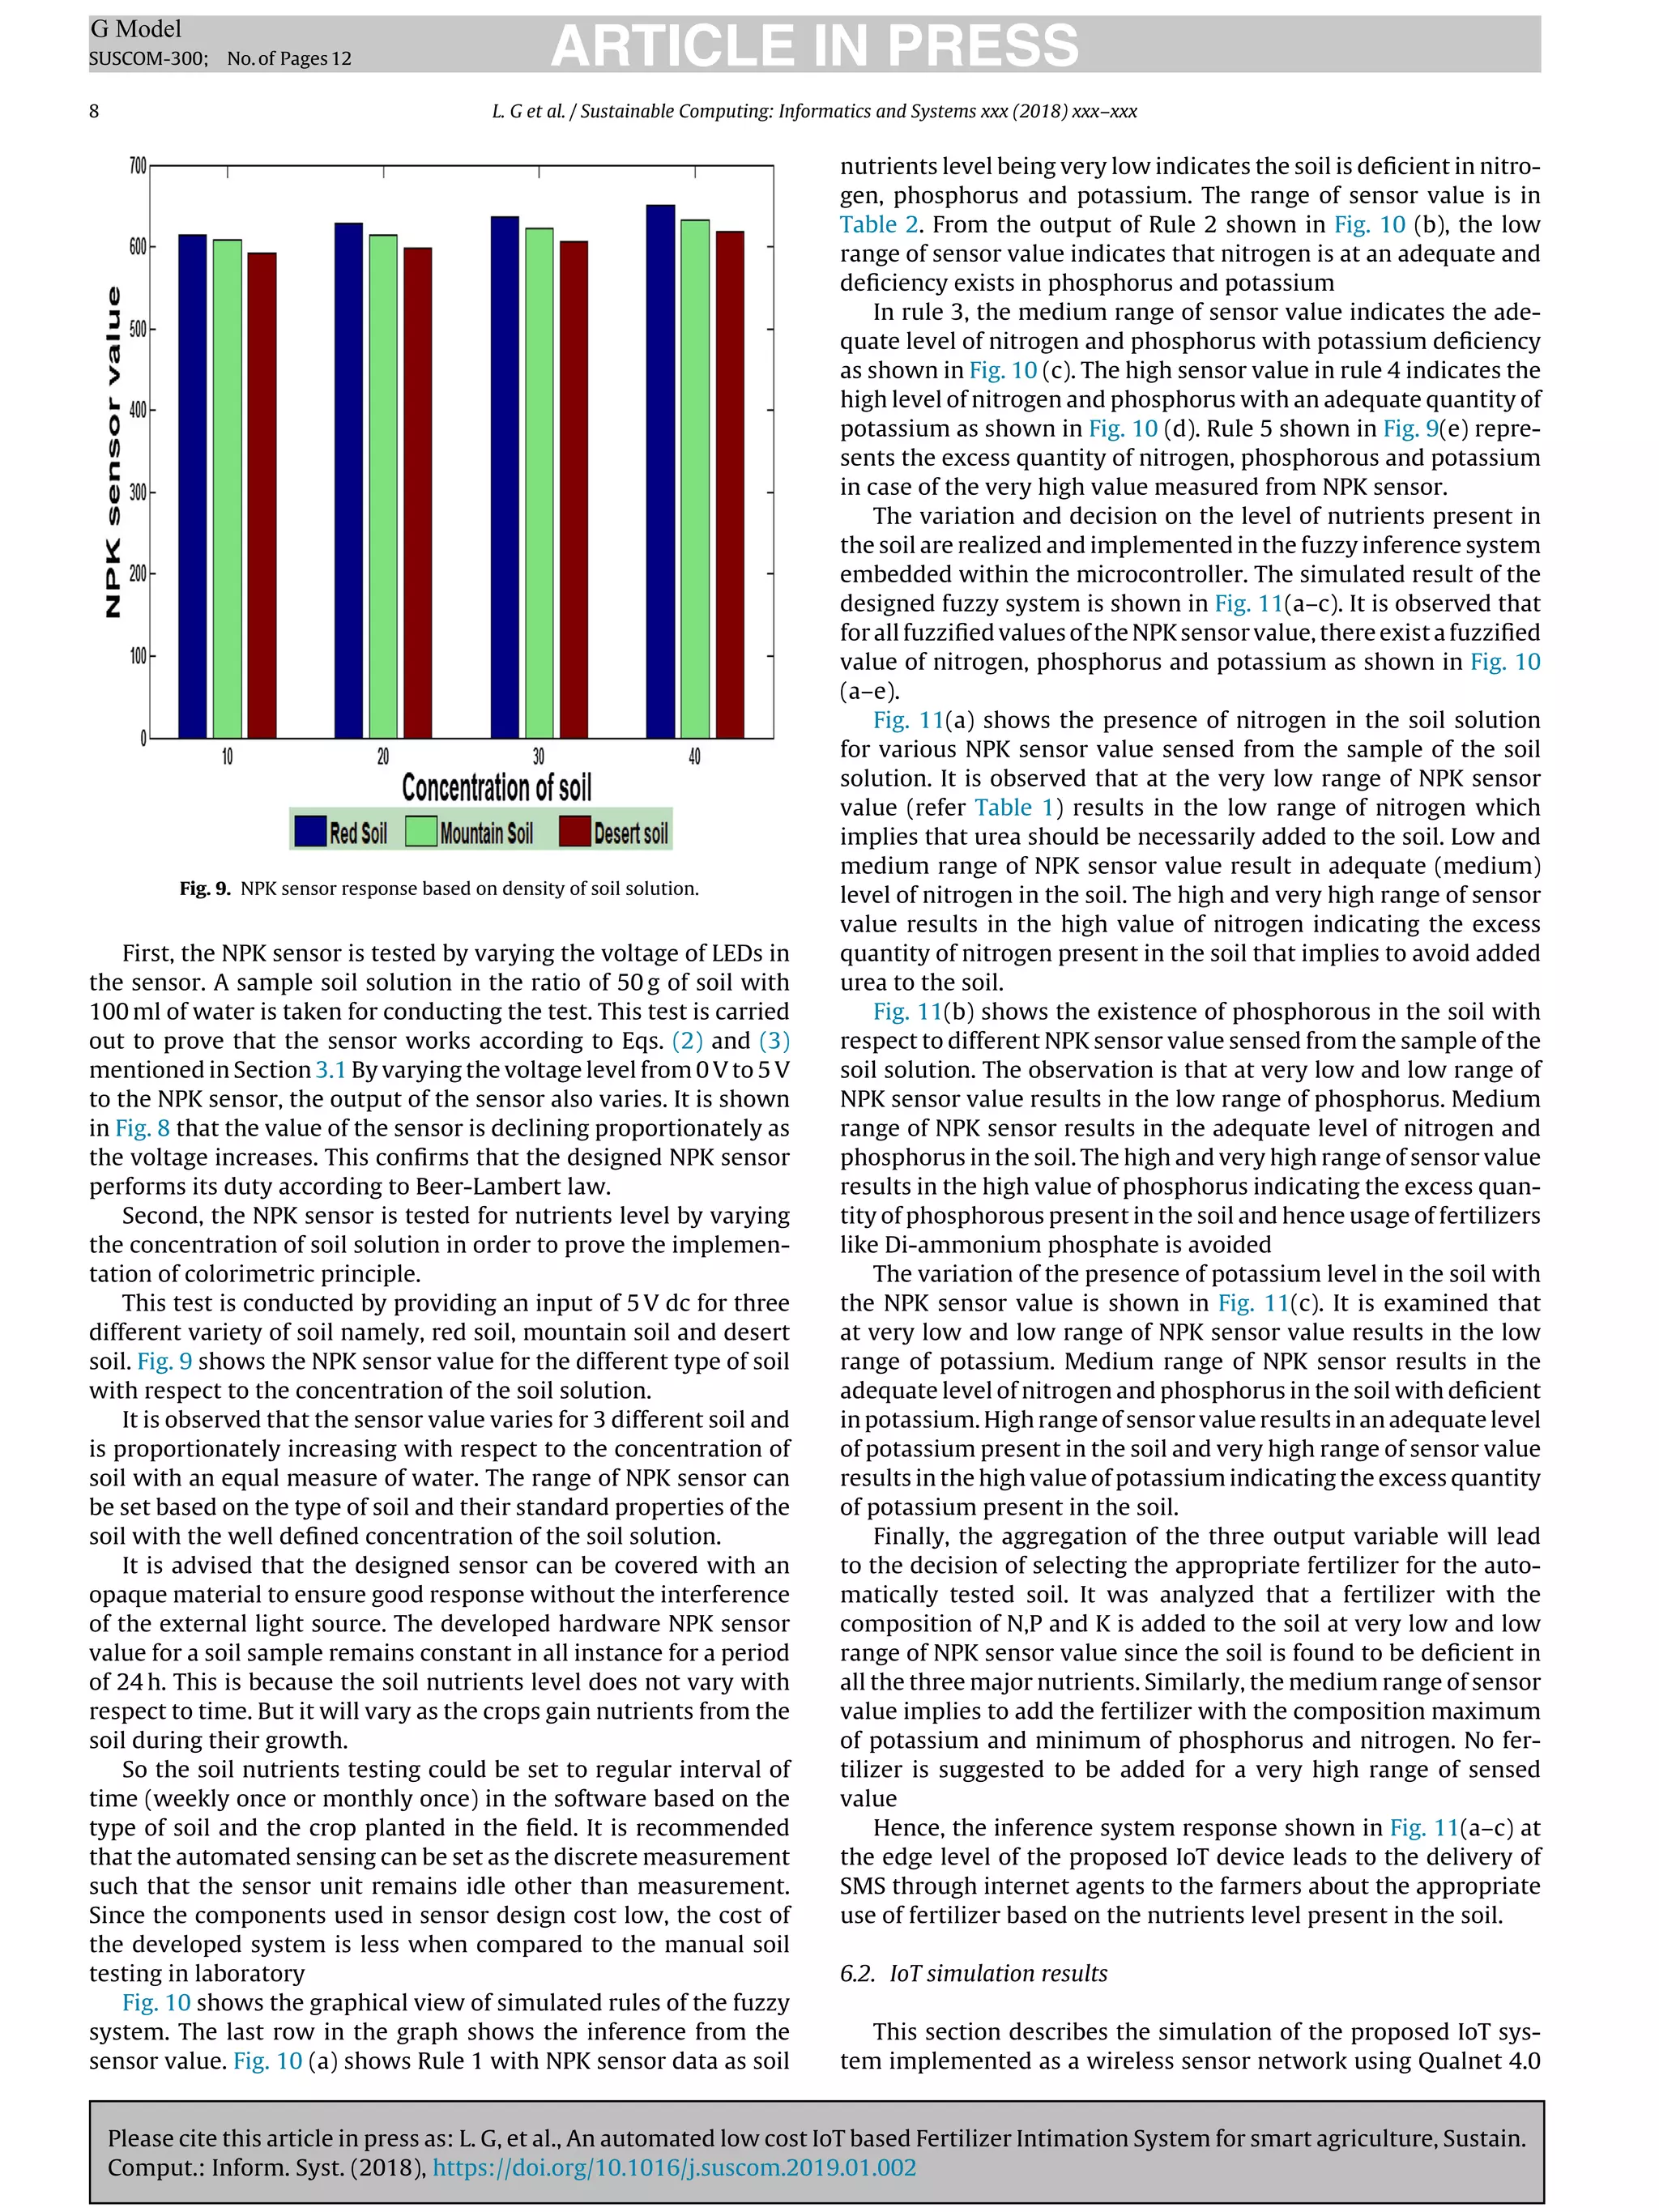
6 L. G et al. / Sustainable Computing: Informatics and Systems xxx (2018) xxx–xxx
Fig. 7. IoT Functional Architecture Design.
4. IoT protocol stack
Rapid growth in Information Communication Technology
(ICT) [42,43] has enabled the IoT to integrate the physical objects
with a unique identifier in order to transmit data over the internet
without involving human interactions. By automating the physi-
cal objects using ICT, controlling and monitoring the same can be
performed without much human interaction. Any physical object
becomes a smart object by integrating the desired sensor and pro-
cessing unit over the internet.
Development of an IoT system involves the design of hardware,
software and communication interface. The proposed IoT system
is shown in Fig. 7. This proposed IoT system can be extended and
implemented in an agricultural land to provide the necessary infor-
mation about the fertilizer to the farmers. Multiple sensor units
transmit the information of respective NPK sensor to the cloud
database through internet after the edge analysis based on fuzzy
logic in Raspberry pi.
The physical layer consists of NPK sensor and microcontroller
unit to process the sensed value and to identify the deficiency of
soil nutrients. This layer uses IEEE 802.11 ah for providing a low
energy wireless medium access protocol (i.e.) low energy WIFI. It
is employed in data link layer because it possess qualities such as
low energy, less overhead, power friendly communication, better
synchronization short MAC frame of 30 bytes, NULL data packet as
acknowledgement frame and increase sleep time.
As the proposed system consumes less power and RPL basi-
cally works based on one route from every leaf node to the root,
it is used in the network layer. It builds a Destination Oriented
Directed Acyclic Graph (DODAG) based on sending an advertise-
ment frame from the root node. The advertisement frame DODAG
Information Object (DIO) is initially broadcasted to the network and
whole DODAG is formulated according to root from each leaf node
is discovered to send data to root. When a NPK sensor node is ready
to transmit its data to cloud database and then it sends a Destina-
tion Advertisement Object (DAO). After the DAO Acknowledgment,
then the data is transmitted to destination via the identified route.
If a new sensor is added to join the network, it sends a DODAG
Information Solicitation (DIS) request to join the network and root
will reply through DAO Acknowledgment to confirm the joining of
the node and discovered root.
In order to develop as a low power Wireless Personal Area
Network, IPV 6 is used in the proposed system. Network encapsu-
lation layer encapsulates IPV6 long header in small packets which
is less than 128 bytes. Fragmentation header is used to split the
IPV6 header to 128 byte long fragments. Since the data from the](https://image.slidesharecdn.com/csgk0f0wvv2ae6vkadmifue2jvq635-220130180815/75/An-automated-low-cost-IoT-based-Fertilizer-Intimation-System-forsmart-agriculture-6-2048.jpg)
![Please cite this article in press as: L. G, et al., An automated low cost IoT based Fertilizer Intimation System for smart agriculture, Sustain.
Comput.: Inform. Syst. (2018), https://doi.org/10.1016/j.suscom.2019.01.002
ARTICLE IN PRESS
G Model
SUSCOM-300; No.of Pages12
12 L. G et al. / Sustainable Computing: Informatics and Systems xxx (2018) xxx–xxx
Conflicts of interest
The authors declare that no conflicts of interest.
Acknowledgment
The authors are very much grateful to the reviewers’ highly
valuable comments and suggestions that improved the quality of
manuscript.
References
[1] Luis Ruiz-Garcia, Loredana Lanadei, The role of RFID in agriculture,
applications, limitations changes, J. Comput. Electron. Agric. (2017) 42–50.
[2] Tamoghna Ojha, Sudip Misra, Narendra, WSN for agriculture: state of the art
in practice and future challenges, J. Comput. Electron. Agric. (2015) 66–84.
[3] E. Ben-Dor, A. Banin, Near infrared analysis as a rapid method to
simultaneously evaluate several soil properties, Soil Sci. Soc. Am. J. (1993)
364–372.
[4] W. Van Lierop, Determination of available phosphorus in acid and calcerous
soils with the Kelowna multiple-element extractant, Soil Sci. (1988) 284–291.
[5] D.R. Keeney, J.M. Bremner, Comparison and evaluation of laboratory methods
of obtaining an index of soil nitrogen availability, Agron. J. (1966) 498–503.
[6] J.C. Ezeokonkwo, Engineering properties of NPK fertilizer modified Soil, J.
Emerg Trends Eng. Appl. Sci. (2011) 962–966.
[7] Allen Doyle, Michael N. Weintraub, Joshua P. Schimel, Persulfate digestion
and simultaneous colorimetric analysis of carbon and nitrogen in soil
extracts, Soil Sci. Soc. Am. J. (2002) 669–676.
[8] Yong He, Kai Dong, Yongheng Hu, Tao Dong, Colorimetric recognition for
urinalysis dipsticks based on quadratic discriminant analysis, in: 39th Annual
International Conference of the IEEE – Engineering in Medicine and Biology
Society, 2017.
[9] Henriksen, A.R. Selmer-Olsen, Automatic methods for determining nitrate
and nitrite in water and soil extracts, Analyst (1970) 514–518.
[10] Rigor G. Regalado, Jenefer C. Dela Cruz, Soil pH and nutrient (nitrogen,
phosphorus and potassium) analyzer using colorimetry, IEEE TENCON (2016).
[11] Deepa V. Ramane, Supriya S. Patel, A.D. Shaligram, Detection of NPK nutrients
o soil using fiber optic sensor, Int. J. Res. Advent Technol. (2015) 66–70.
[12] Dissanayake H. Pasqual, B.C.L. Athapattu, Economical colorimetric smart
sensor to measure water quality of drinking water in CKDu prevalence areas,
IEEE Sens. J. (2017) 5885–5891.
[13] Yu Chen, Guoqing Fu, Yael Zilberman, Weitong Ruan, Shideh Kabiri Ameri,
Eric Miller, Sameer Sonkusale, Disposable colorimetric geometric barcode
sensor for food quality monitoring, 19th International Conference on
Solid-State Sensors, Actuators and Microsystems (TRANSDUCERS) (2017).
[14] Dami Kim, Sejin Kim, Jeongho An, Sanghyo Kim, A portable colorimetric array
reader for toxic gas detection, ISOCS/IEEE International Symposium on
Olfaction and Electronic Nose (ISOEN) (2017).
[15] Cheng-Shane Chu, Meng-Wei Hsieh, Optical carbon dioxide sensor based on
the colorimetric change of ␣-naphtholphthalein and internal reference
fluorescent CIS/ZnS QDs, 25th Optical Fiber Sensors Conference (OFS) (2017).
[16] Abdul Kodir, Cuk Imawan, Indra Setia Permana, Windri Handayani, Pesticide
colorimetric sensor based on silver nanoparticles modified by L-cysteine,
International Seminar on Sensors, Instrumentation, Measurement and
Metrology (ISSIMM) (2017).
[17] A. Zakarian, Analysis of process models: a fuzzy logic aproach, Int. J. Adv.
Manuf. Technol. (2001) 444–452.
[18] Liviu-Cristian Duţu, Gilles Mauris, Philippe Bolon, A fast and accurate
rule-base generation method for mamdani fuzzy systems, IEEE Trans. Fuzzy
Syst. (2018) 713–733.
[19] G. Feng, A survey on analysis and design of model-based fuzzy control
systems, IEEE Trans. Fuzzy Syst. (2006) 676–697.
[20] W.B. Zulfikar, Jumadi P.K. Prasetyo, M.A. Ramdhani, Implementation of
mamdani fuzzy method in employee promotion system, in: 2nd Annual
Applied Science and Engineering Conference, 2017.
[21] Tzung-Pei Hong, Chai-Ying Leeb, Induction of fuzzy rules and membership
functions from training examples, Fuzzy Sets Syst. (1996) 33–47.
[22] Pugalendhi GaneshKumar, Chellasamy Rani, S.N. Deepa, Formation of fuzzy
if-then rules and membership function using enhanced particle swarm
optimization, Int. J. Uncertain. Fuzziness Knowl.-Based Syst. (2013) 103–126.
[23] G. Lavanya, S. Pandeeswari, R.K. Shanmugapriya, Fuzzy based inference
reduction in cognitive networks, Proceedings of International Conference on
Advance in Computing as Part of Springer – Advances in Intelligent Systems
Computing (2013) 1061–1068.
[24] P. Qian, J.J. Schoenaru, R.E. Karmanos, Simultaneous extraction of available
phosphorus and K with a new soil test: a modification of Kelowna extraction,
J. Soil Sci. – Plants Anim. (1994) 627–635.
[25] Andrea Zanella, Angelo Castellani, Lorenzo Vangelista, Internet of things for
smart city, IEEE Internet Things J. (2014) 3–9.
[26] Michele Luvisotto, Federico Tramarin, Lorenzo Vangelista, Stefano Vitturi, On
the use of LoRaWAN for indoor industrial IoT applications, Wireless
Communications and Mobile Computing (2018).
[27] S. Lavanya, G. Lavanya, J. Divyabharathi, Remote prescription and I-home
health base on IOT, IEEE International Conference on Innovations in Green
Energy and Healthcare Technologies (2017).
[28] Olakunle Elijah, Igbafe Orikumhi, Tharek Abdul Rahma, Suleiman Aliyu
Babale, Stella Ifeoma Orakwue, Enabling smart agriculture in Nigeria:
application of IoT and data analytics, IEEE 3rd International Conference on
Electro-Technology for National Development (2017).
[29] Xu Chen, Qian Shi, Lei Yang, X. Jie, ThriftyEdge: resource-efficient edge
computing for intelligent IoT applications, IEEE Network (2018).
[30] Mahammad Shareef Mekal, P. Viswanathan, A novel technology for smart
agriculture based on IoT with cloud computing, 2017 International
Conference on IoT in Social, Mobile, Analytics and Cloud (2017) 75–82.
[31] S. Jaiganesh, K. Gunaseelan, V. Ellappan, IOT agriculture to improve food and
farming technology, International Conference on Emerging Devices and Smart
Systems (2017).
[32] Tarushi Wasson, Tanupriya Choudhury, Shilpi Sharma, Praveen Kumar,
Integration of RFID and sensor in agriculture using IOT, International
Conference On Smart Technologies For Smart Nation (2018).
[33] Soumil Heble, Ajay Kumar, K.V.V. Durga Prasad, Soumya Samirana, P.
Rajalakshmi, U.B. Desai, A low power IoT network for smart agriculture, IEEE
4th World Forum on Internet of Things (2018).
[42] In Lee, Kyoochun Lee, The internet of things: application, investments
challenges for enterprises, J. Bus. Horiz. (2015) 431–440.
[44] A.B. Ghosh, R. Hasan, Nitrogen fertility status of soils of India, Fertilizer News
25 (11) (1980).
[45] A.B. Ghosh, J.C. Bajaj, R. Hasan, Dhyan Singh, Soil and Water Testing Methods:
A Laboratory Manual, Division of Soil Science and Agricultural Chemistry,
IARA, New Delhi, 1983.](https://image.slidesharecdn.com/csgk0f0wvv2ae6vkadmifue2jvq635-220130180815/75/An-automated-low-cost-IoT-based-Fertilizer-Intimation-System-forsmart-agriculture-12-2048.jpg)

This document describes an IoT-based system to monitor soil nutrients and advise farmers on fertilizer use. It involves: 1. Designing a novel NPK sensor using colorimetric principles to detect nitrogen, phosphorus and potassium levels in soil samples. Sensor data is sent to a cloud database. 2. Applying fuzzy logic at the edge to analyze sensor data and determine nutrient deficiencies based on if-then rules. Levels are categorized as very low, low, medium, high or very high. 3. Sending automated SMS alerts to farmers on a regular basis recommending fertilizer quantities for different nutrient deficiencies as determined by the fuzzy system. The system is intended to help farmers apply fertil