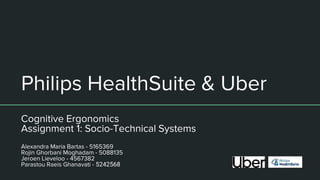
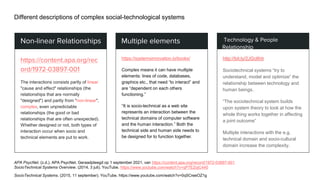
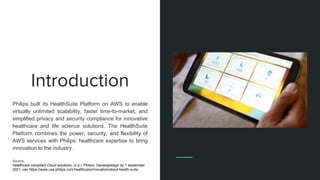
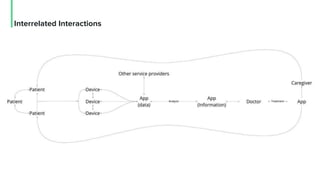
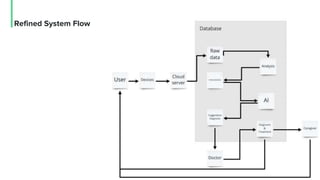
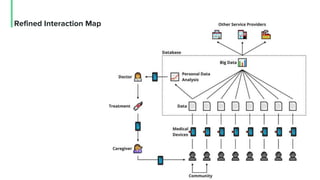
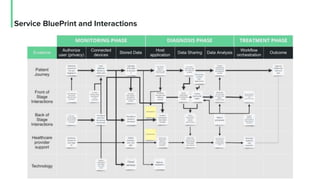
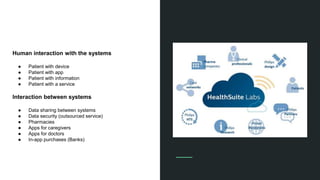
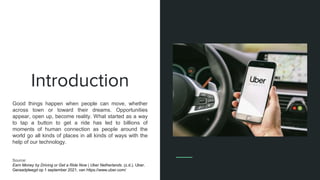
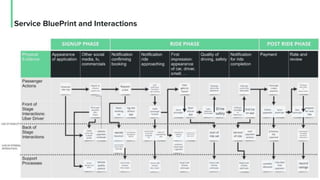
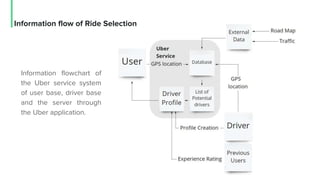
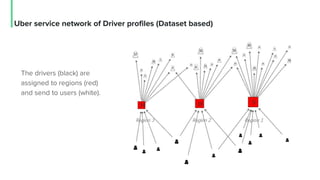
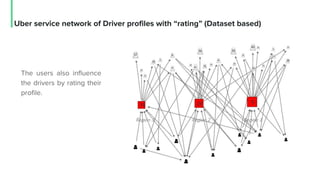
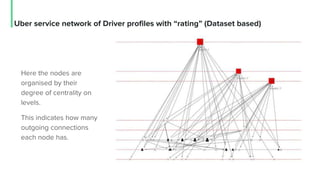
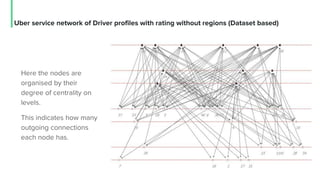
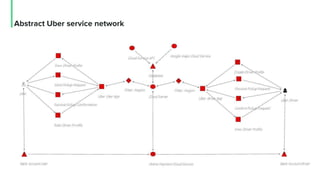
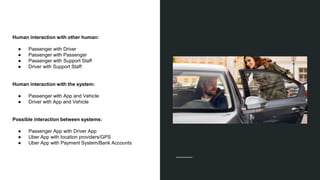
Philips HealthSuite & Uber
Cognitive Ergonomics
Assignment 1: Socio-Technical Systems
Alexandra Maria Bartas - 5165369
Rojin Ghorbani Moghadam - 5088135
Jeroen Lieveloo - 4567382
Parastou Raeis Ghanavati - 5242568
Different descriptions of complex social-technological systems
Non-linear Relationships
https://content.apa.org/rec
ord/1972-03897-001
The interactions consists partly of linear
"cause and effect" relationships (the
relationships that are normally
"designed") and partly from "non-linear",
complex, even unpredictable
relationships (the good or bad
relationships that are often unexpected).
Whether designed or not, both types of
interaction occur when socio and
technical elements are put to work.
Multiple elements
https://systemsinnovation.io/books/
Complex means it can have multiple
elements: lines of code, databases,
graphics etc., that need “to interact” and
are “dependent on each others
functioning.”
“It is socio-technical as a web site
represents an interaction between the
technical domains of computer software
and the human interaction.” Both the
technical side and human side needs to
be designed for to function together.
Technology & People
Relationship
http://bit.ly/2JGc6hh
Sociotechnical systems “try to
understand, model and optimize” the
relationship between technology and
human beings.
“The sociotechnical system builds
upon system theory to look at how the
whole thing works together in affecting
a joint outcome”
Multiple interactions with the e.g.
technical domain and socio-cultural
domain increase the complexity.
APA PsycNet. (z.d.). APA PsycNet. Geraadpleegd op 1 september 2021, van https://content.apa.org/record/1972-03897-001
SocioTechnical Systems Overview. (2014, 3 juli). YouTube. https://www.youtube.com/watch?v=qP7EZojC440
SocioTechnical Systems. (2015, 11 september). YouTube. https://www.youtube.com/watch?v=0q5CreeOZ1g
Health | Philips HealthSuite
Introduction
Philips built its HealthSuite Platform on AWS to enable
virtually unlimited scalability, faster time-to-market, and
simplified privacy and security compliance for innovative
healthcare and life science solutions. The HealthSuite
Platform combines the power, security, and flexibility of
AWS services with Philips’ healthcare expertise to bring
innovation to the industry.
Source:
Healthcare compliant Cloud solutions. (z.d.). Philips. Geraadpleegd op 1 september
2021, van https://www.usa.philips.com/healthcare/innovation/about-health-suite
Interrelated Interactions
Refined System Flow
Refined Interaction Map
Service BluePrint and Interactions
Human interaction with the systems
● Patient with device
● Patient with app
● Patient with information
● Patient with a service
Interaction between systems
● Data sharing between systems
● Data security (outsourced service)
● Pharmacies
● Apps for caregivers
● Apps for doctors
● In-app purchases (Banks)
Mobility | Uber
Introduction
Good things happen when people can move, whether
across town or toward their dreams. Opportunities
appear, open up, become reality. What started as a way
to tap a button to get a ride has led to billions of
moments of human connection as people around the
world go all kinds of places in all kinds of ways with the
help of our technology.
Source:
Earn Money by Driving or Get a Ride Now | Uber Netherlands. (z.d.). Uber.
Geraadpleegd op 1 september 2021, van https://www.uber.com/
Service BluePrint and Interactions
Information flow of Ride Selection
Information flowchart of
the Uber service system
of user base, driver base
and the server through
the Uber application.
Uber service network of Driver profiles (Dataset based)
The drivers (black) are
assigned to regions (red)
and send to users (white).
Uber service network of Driver profiles with “rating” (Dataset based)
The users also influence
the drivers by rating their
profile.
Uber service network of Driver profiles with “rating” (Dataset based)
Here the nodes are
organised by their
degree of centrality on
levels.
This indicates how many
outgoing connections
each node has.
Uber service network of Driver profiles with rating without regions (Dataset based)
Here the nodes are
organised by their
degree of centrality on
levels.
This indicates how many
outgoing connections
each node has.
Abstract Uber service network
Human interaction with other human:
● Passenger with Driver
● Passenger with Passenger
● Passenger with Support Staff
● Driver with Support Staff
Human interaction with the system:
● Passenger with App and Vehicle
● Driver with App and Vehicle
Possible interaction between systems:
● Passenger App with Driver App
● Uber App with location providers/GPS
● Uber App with Payment System/Bank Accounts
Thank You

Socio-Technical Systems Case Study

  • 1.
    Philips HealthSuite &Uber Cognitive Ergonomics Assignment 1: Socio-Technical Systems Alexandra Maria Bartas - 5165369 Rojin Ghorbani Moghadam - 5088135 Jeroen Lieveloo - 4567382 Parastou Raeis Ghanavati - 5242568
  • 2.
    Different descriptions ofcomplex social-technological systems Non-linear Relationships https://content.apa.org/rec ord/1972-03897-001 The interactions consists partly of linear "cause and effect" relationships (the relationships that are normally "designed") and partly from "non-linear", complex, even unpredictable relationships (the good or bad relationships that are often unexpected). Whether designed or not, both types of interaction occur when socio and technical elements are put to work. Multiple elements https://systemsinnovation.io/books/ Complex means it can have multiple elements: lines of code, databases, graphics etc., that need “to interact” and are “dependent on each others functioning.” “It is socio-technical as a web site represents an interaction between the technical domains of computer software and the human interaction.” Both the technical side and human side needs to be designed for to function together. Technology & People Relationship http://bit.ly/2JGc6hh Sociotechnical systems “try to understand, model and optimize” the relationship between technology and human beings. “The sociotechnical system builds upon system theory to look at how the whole thing works together in affecting a joint outcome” Multiple interactions with the e.g. technical domain and socio-cultural domain increase the complexity. APA PsycNet. (z.d.). APA PsycNet. Geraadpleegd op 1 september 2021, van https://content.apa.org/record/1972-03897-001 SocioTechnical Systems Overview. (2014, 3 juli). YouTube. https://www.youtube.com/watch?v=qP7EZojC440 SocioTechnical Systems. (2015, 11 september). YouTube. https://www.youtube.com/watch?v=0q5CreeOZ1g
  • 3.
    Health | PhilipsHealthSuite
  • 4.
    Introduction Philips built itsHealthSuite Platform on AWS to enable virtually unlimited scalability, faster time-to-market, and simplified privacy and security compliance for innovative healthcare and life science solutions. The HealthSuite Platform combines the power, security, and flexibility of AWS services with Philips’ healthcare expertise to bring innovation to the industry. Source: Healthcare compliant Cloud solutions. (z.d.). Philips. Geraadpleegd op 1 september 2021, van https://www.usa.philips.com/healthcare/innovation/about-health-suite
  • 5.
  • 6.
  • 7.
  • 8.
  • 9.
    Human interaction withthe systems ● Patient with device ● Patient with app ● Patient with information ● Patient with a service Interaction between systems ● Data sharing between systems ● Data security (outsourced service) ● Pharmacies ● Apps for caregivers ● Apps for doctors ● In-app purchases (Banks)
  • 10.
  • 11.
    Introduction Good things happenwhen people can move, whether across town or toward their dreams. Opportunities appear, open up, become reality. What started as a way to tap a button to get a ride has led to billions of moments of human connection as people around the world go all kinds of places in all kinds of ways with the help of our technology. Source: Earn Money by Driving or Get a Ride Now | Uber Netherlands. (z.d.). Uber. Geraadpleegd op 1 september 2021, van https://www.uber.com/
  • 12.
  • 13.
    Information flow ofRide Selection Information flowchart of the Uber service system of user base, driver base and the server through the Uber application.
  • 14.
    Uber service networkof Driver profiles (Dataset based) The drivers (black) are assigned to regions (red) and send to users (white).
  • 15.
    Uber service networkof Driver profiles with “rating” (Dataset based) The users also influence the drivers by rating their profile.
  • 16.
    Uber service networkof Driver profiles with “rating” (Dataset based) Here the nodes are organised by their degree of centrality on levels. This indicates how many outgoing connections each node has.
  • 17.
    Uber service networkof Driver profiles with rating without regions (Dataset based) Here the nodes are organised by their degree of centrality on levels. This indicates how many outgoing connections each node has.
  • 18.
  • 19.
    Human interaction withother human: ● Passenger with Driver ● Passenger with Passenger ● Passenger with Support Staff ● Driver with Support Staff Human interaction with the system: ● Passenger with App and Vehicle ● Driver with App and Vehicle Possible interaction between systems: ● Passenger App with Driver App ● Uber App with location providers/GPS ● Uber App with Payment System/Bank Accounts
  • 20.

Editor's Notes

  • #3 First we found different descriptions of complex social technological systems, part from the lectures So we found that it can be complex if it contains multiple elements that interact and depend on each others functioning Additionally, both the technical side and human side need to be designer for to function together Sociotechnical systems try to understand, model and optimize this relationship. Finally multiple interactions with e.g. technical domain or culture can increase the complexity in contrast to the linear relationship (that have a cause and effect)
  • #5 The first platform within the “health” theme of this course that we chose to study, is Philips HealthSuite. It is an open service, which means they do not know yet how it will pan out. We envisioned an idyllic future possibility.
  • #6 We first tried to demonstrate an overview of interactions within Philips HealthSuite service. The service relies the information to the doctor in a comprehensive way so their tasks become less time consuming and factual. Based on the feedback of the presentation we remade this workflow, in slide 6 and 7.
  • #7 After the presentation, based on the feedbacks we tried to refine the system flow as you can see in this slide. Database is now shown in the system scheme
  • #8 The final iteration on interaction map is more focused on the user. Hence the flow begins with the user entering data from medical devices to the system. Different apps in the system are distinguished, as well as how the big data is made of, and how it contributes to the other businesses
  • #9 We tried to study those interactions further using a service Blueprint by mapping out a general patient journey. The reason for choosing Service blueprint was to connect different stages of interaction happening between all actors and backstage support. As you can see in this blueprint, there are multiple interactions and elements involved in this service. And there are multiple connections between technology and people. Actions in different stages are related and sometimes dependant on the other stages, that means the journey timeline is not simple and linear, therefore the healthSuite service is a complex system. For example there are 2 different connection points with eCareCompanion (the specific platform for caretakers) and eCareCoordinator (the specific platform for Doctors).
  • #10 To summarize, main interactions happening within human and the systems are mentioned in this slide.
  • #11 NOTES: Uber system missing in the visualisation Distinguish the two apps involved consider that system selects the region Make the visualisations abstract instead of data based
  • #12 The second platform within the “mobility” theme of this course that we chose to study, is Uber. A service for connecting passengers to drivers in a region and facilitate the ride experience for both of the actors.
  • #13 Once again, we used the Service blueprint due to the nature of Uber that is a “Service” and could be well-defined via the blueprint mapping method. It can connect different stages of interaction happening between all actors and backstage support. As illustrated in the slide, actions in different stages are related and sometimes dependant on the other stages, that means the journey timeline is not simple and linear, therefore the Uber service is a complex system.
  • #14 To visualize a small scope of activity happening within this system, you can see the information flow of the “Ride Selection” activity in this slide. The flow starts with the user indicating their location that goes in the system database; at the sametime, driver’s location is also there. Other data in this stage of action could be the road data and traffic information, driver profile and background, that can influence decision making of either passenger or the driver.
  • #15 At this point, we tried to make use of Social Networking Program to visualize the possibility of connections within Uber system. Since these nodes are not based on actual data, but our assumption; the main outcome of these visuals are the order of connections and overlaps. For example, this slide shows the “ride selection” stage of activity within the system that was aslo described in the previous slide. This shows that there are probably more passengers in a region than drivers, and there are overlaps in the selected regions for either passenger or driver.
  • #16 In this example, you can see the “rating” stage of activity in Uber system. This shows how the rating system connects passengers and the drivers in terms of network graph. More overlaps are visible in this visualization comparing to the previous one.
  • #17 This is a nice layout for this system that seemed to indicate something concrete. The “data” and stage of activity is the same as before, but the leveling makes the received “information” more clear. Basic description of this graph is: The more connections exist for a node, the higher level it would stand.
  • #18 These are the connection between the people. Without the regions as “middle man”. Interesting to note is that the drivers are on the higher levels, connected to more people. And the users are on the lower levels, connected to less people. This is likely because there are more users than drivers.
  • #19 These are the connection between the people. Without the regions as “middle man”. Interesting to note is that the drivers are on the higher levels, connected to more people. And the users are on the lower levels, connected to less people. This is likely because there are more users than drivers.
  • #20 To summarize, main interactions happening within human and the systems are mentioned in this slide.