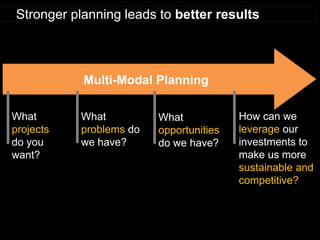
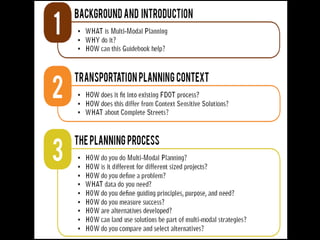
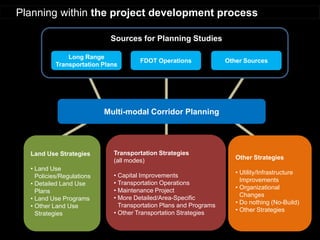
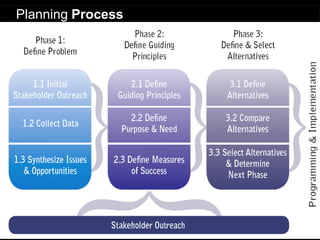
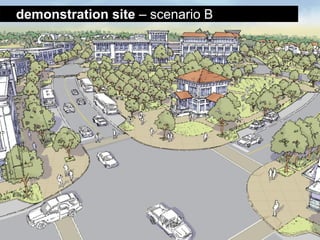
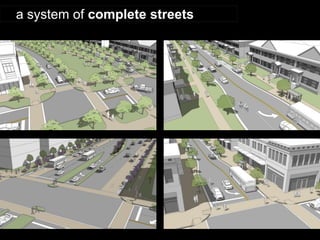
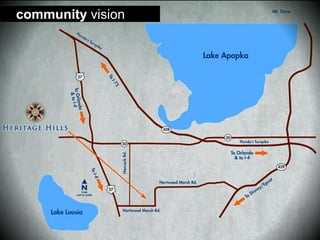
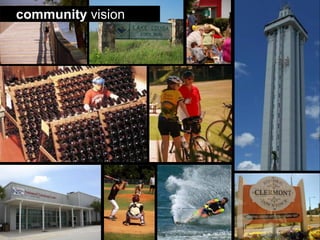
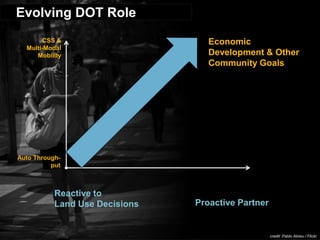
A Bold New Initiative District 5 Multi-Modal Planning Guidebook 
pro walk pro bike pro place | 9.9.2014 
Presenting on Behalf of John P. Moore, FDOT District 5 Jane Lim-Yap, AICP Mary Raulerson
Our Transportation World Is Changing
Crossing the Continent
“We are pushing ahead with a great road program, a road program that will take this Nation out of its antiquated shackles of secondary roads… It will be a nation of great prosperity, but will be more than that: it will be a nation that is going ahead every day. With… our population increasing at five every minute, the expanding horizon is one that staggers the imagination.” 
October 29, 1954 
Interstate Highway System
Source: FHWA 
210,896 lane miles 
in less than 50 years
Our New Challenge
Source: Congressional Budget Office and “Life in the Slow Lane”, The Economist, April l 28, 2011 
0.00% 
0.05% 
0.10% 
0.15% 
0.20% 
0.25% 
0.30% 
0.35% 
0.40% 
Highway Trust Fund Receipts (Percent of GDP) 
Transit Account 
Highway Account 
Limited Revenues 
$1 trillion 
National transportation funding shortfall through 2015* 
$200 billion 
National revenue gap per year* 
* Source: Transportation for Tomorrow Report, The National Surface Transportation Policy and Revenue Study Commission, December 2007.
$50 billion 
FDOT estimated funding gap over next 20 years 
Governor Scott’s Regulatory Reform Transition presentation, December, 2010. 
Source: MPOAC Situational Analysis, December 2010 
Funding Shortfall 
Florida Metro Area Transportation Funding Shortfall Estimates 
1997 
2002 
2008
20% of household budget spent on transportation 
Sources: U.S. Department of Energy; Bureau of Labor Statistics, TTI Mobility Report 2010, FHWA Livability Initiative. 
increased costs of driving 
Oil Prices ($ per barrel) 
Crude 
Diesel 
Unleaded 
4.8 billion hours time spent in traffic in 2009
Source: MPOAC Situational Analysis, December 2010 and State Smart Transportation Initiative (ww.ssti.org) 
Personal Income 
VMT 
Population Growth 
changing travel patterns 
23% Drop in amount of driving by 16 to 34 year olds from 2001 to 2011 Source: Transportation and the New Generation: Why Young People Are Driving Less and What It Means for Transportation Policy
increased safety concerns 
Sources: Dangerous By Design, 2014, Smart Growth America
increased safety concerns 
“Walking in Orlando is almost akin to being on a theme park ride, but without the 
safety equipment or procedures…”
By 2025: 1 in 5 Americans will be over 65 
focus on expanding mobility one third of all Americans don’t drive more than half of older Americans would rather drive less 
Sources: Surface Transportation Policy Project. “Americans’ Attitudes Toward Walking and Creating Better Walking Communities.” 2003; APTA 2009 Public Transportation Fact Book; 2008 National Household Travel Survey; Steven Raphael and Alan Berube. “Socioeconomic Differences in Household Automobile Ownership Rates: Implications for Evacuation Policy,” paper prepared for the Berkeley Symposium March 2006, http://urbanpolicy.berkeley.edu/pdf/raphael.pdf.
•Doing More with Less 
•Changing Travel Patterns 
•Demand for More Travel Choices & Expanding Mobility 
•Increased Safety Concerns 
•Changing requests from our Communities 
New challenges
Land Use 
Travel 
Road Capacity 
Conventional Approach 
GENERATES 
DEMANDS 
Anticipate 
Forecast (Based on Speed) 
Accommodate
Integrated Transportation & Land Use 
Transportation Investments 
Travel 
Land Use 
HELP MANAGE 
INFLUENCES 
Multi-Modal 
Manage 
Coordinate
Is this a multi-modal street?
Ingredients to Multi-modal obility 
Place to comfortably and safely walk, 
bicycle, take transit, or drive on 
Places to conveniently walk to, 
bicycle to, reach by transit, or drive to
•Doing More with Less 
•Changing Travel Patterns 
•Demand for More Travel Choices & Expanding Mobility 
•Increased Safety Concerns 
•Changing requests from our Communities 
Tools to address new challenges
TRANSPORTATION DESIGN FOR LIVABLE COMMUNITIES “It is the policy of the Department to consider Transportation Design for Livable Communities features on the State Highway System …” Principles: 
1.Safety of all modes 
2.Balancing community values and mobility needs 
3.Efficient use of energy resources 
4.Protection of the environment 
5.Coordinated land use and transportation planning 
6.Local and state economic development goals 
7.Complementing and enhancing existing Department standards and processes 
Chapter 21 of Plans Preparation Manual: TDLC credit: Eric E Johnson / Flickr
Talking about Accommodating All Modes in Design is too Late 
Planning 
PD&E 
Design 
ROW 
Impacts ($, Public Trust, Mitigation) 
Construction 
Built Project 
•More Costly 
•More Community Controversy 
•More Mitigation Cost 
•Least cost 
•More opportunities to incorporate community goals 
•Greater flexibility to evaluate a wide range of options
State 
Directives 
Regional 
Planning 
And 
Priorities 
(LRTPs) 
Planning 
Capital 
Improvement 
Programs 
PD&E & Preliminary Engineering 
Final Design 
& Permitting 
ROW & Utilities 
Construction & Maintenance 
When should we plan?
What projects do you want? 
What problems do we have? 
How can we leverage our investments to make us more sustainable and competitive? 
Multi-Modal Planning 
Stronger planning leads to better results 
What opportunities do we have?
http://cfgis.org/FDOT- Resources/Resource- Guidebooks.aspx
Land Use Strategies 
•Land Use Policies/Regulations 
•Detailed Land Use Plans 
•Land Use Programs 
•Other Land Use Strategies 
Transportation Strategies (all modes) 
•Capital Improvements 
•Transportation Operations 
•Maintenance Project 
•More Detailed/Area-Specific Transportation Plans and Programs 
•Other Transportation Strategies 
Other Strategies 
•Utility/Infrastructure Improvements 
•Organizational Changes 
•Do nothing (No-Build) 
•Other Strategies 
Planning within the project development process 
Long Range Transportation Plans 
FDOT Operations 
Other Sources 
Sources for Planning Studies 
Multi-modal Corridor Planning
It is ok not to know the solution!
It is ok not to know the problem!
Planning Process
Transportation & Community Building Strategies from the SR 50 Multi-Modal Corridor Study
•4-lane major arterial, recently widened to 6 lanes 
•Future travel demand far exceeds future capacity 
•Limited alternative parallel network 
•Roadway being used for BOTH local and regional trips 
•Designated a multi-modal corridor in TRANSPORTATION 2035 
•Multi-modal solutions viable only with land use strategies 
Lake Apopka 
Lake Minneola 
Lake Minnehaha 
Citrus Tower 
Hancock 
Avalon 
Hartwood Marsh 
Johns Lake 
SR 50 
the challenge
1974 
The Turnpike - now completed - provides a new and faster connection to N & S Florida 
Small subdivisions become a more common as a development type 
Commercial Development starts along SR 50 near US 27 
Residential development continues S & E of downtown
1999 
Citrus Tower Blvd becomes a major connection to SR-50 
Rapid residential development occurs
2010 
Few sections of local network added 
Most of undeveloped land is located along the south side of SR 50 and East of US 27 
Development of large commercial parcels becomes common 
Some development on previously approved master planned communities continues
Weekday AM Peak East Bound Traffic 
Weekday PM Peak West Bound Traffic 
Corridor used for local traffic
Network does not support effective 
multi-modal local traffic 
Historic Clermont Street Network 
Newer development East of Clermont
1 Preserve & Celebrate Our Landscape 
2 Preserve Historic Character & Sense of Place 
3 More Play 
4 
Enhance Local Connectivity & Walkability 
5 “Turn the Car Around” 
community values & guiding principles
Scenario A Scenario B 
Existing Roadway 
Proposed Roadway 
Existing Multi-use Trail 
Proposed Multi-use Trail 
Potential Bus Stop
comparing the scenarios
demonstration site – scenario B
a system of complete streets
community vision
community vision
credit: Pablo Abreu / Flickr 
Evolving DOT Role 
Reactive to Land Use Decisions 
Proactive Partner 
CSS & 
Multi-Modal Mobility 
Auto Through- put Economic Development & Other Community Goals
Thank you! 
http://cfgis.org/FDOT-Resources/Resource-Guidebooks.aspx 
Jane Lim-Yap, AICP 
jlim-yap@kittelson.com 
John P. Moore, EI john.moore@state.dot.fl.us

Not Your Grandfather's DOT: The FDOT District 5 and PennDOT Experiences--Bold New Initiative District 5 Multi-Modal Planning Guidebook

  • 1.
    A Bold NewInitiative District 5 Multi-Modal Planning Guidebook pro walk pro bike pro place | 9.9.2014 Presenting on Behalf of John P. Moore, FDOT District 5 Jane Lim-Yap, AICP Mary Raulerson
  • 2.
  • 3.
  • 4.
    “We are pushingahead with a great road program, a road program that will take this Nation out of its antiquated shackles of secondary roads… It will be a nation of great prosperity, but will be more than that: it will be a nation that is going ahead every day. With… our population increasing at five every minute, the expanding horizon is one that staggers the imagination.” October 29, 1954 Interstate Highway System
  • 5.
    Source: FHWA 210,896lane miles in less than 50 years
  • 6.
  • 7.
    Source: Congressional BudgetOffice and “Life in the Slow Lane”, The Economist, April l 28, 2011 0.00% 0.05% 0.10% 0.15% 0.20% 0.25% 0.30% 0.35% 0.40% Highway Trust Fund Receipts (Percent of GDP) Transit Account Highway Account Limited Revenues $1 trillion National transportation funding shortfall through 2015* $200 billion National revenue gap per year* * Source: Transportation for Tomorrow Report, The National Surface Transportation Policy and Revenue Study Commission, December 2007.
  • 8.
    $50 billion FDOTestimated funding gap over next 20 years Governor Scott’s Regulatory Reform Transition presentation, December, 2010. Source: MPOAC Situational Analysis, December 2010 Funding Shortfall Florida Metro Area Transportation Funding Shortfall Estimates 1997 2002 2008
  • 9.
    20% of householdbudget spent on transportation Sources: U.S. Department of Energy; Bureau of Labor Statistics, TTI Mobility Report 2010, FHWA Livability Initiative. increased costs of driving Oil Prices ($ per barrel) Crude Diesel Unleaded 4.8 billion hours time spent in traffic in 2009
  • 10.
    Source: MPOAC SituationalAnalysis, December 2010 and State Smart Transportation Initiative (ww.ssti.org) Personal Income VMT Population Growth changing travel patterns 23% Drop in amount of driving by 16 to 34 year olds from 2001 to 2011 Source: Transportation and the New Generation: Why Young People Are Driving Less and What It Means for Transportation Policy
  • 11.
    increased safety concerns Sources: Dangerous By Design, 2014, Smart Growth America
  • 12.
    increased safety concerns “Walking in Orlando is almost akin to being on a theme park ride, but without the safety equipment or procedures…”
  • 13.
    By 2025: 1in 5 Americans will be over 65 focus on expanding mobility one third of all Americans don’t drive more than half of older Americans would rather drive less Sources: Surface Transportation Policy Project. “Americans’ Attitudes Toward Walking and Creating Better Walking Communities.” 2003; APTA 2009 Public Transportation Fact Book; 2008 National Household Travel Survey; Steven Raphael and Alan Berube. “Socioeconomic Differences in Household Automobile Ownership Rates: Implications for Evacuation Policy,” paper prepared for the Berkeley Symposium March 2006, http://urbanpolicy.berkeley.edu/pdf/raphael.pdf.
  • 14.
    •Doing More withLess •Changing Travel Patterns •Demand for More Travel Choices & Expanding Mobility •Increased Safety Concerns •Changing requests from our Communities New challenges
  • 15.
    Land Use Travel Road Capacity Conventional Approach GENERATES DEMANDS Anticipate Forecast (Based on Speed) Accommodate
  • 16.
    Integrated Transportation &Land Use Transportation Investments Travel Land Use HELP MANAGE INFLUENCES Multi-Modal Manage Coordinate
  • 17.
    Is this amulti-modal street?
  • 18.
    Ingredients to Multi-modalobility Place to comfortably and safely walk, bicycle, take transit, or drive on Places to conveniently walk to, bicycle to, reach by transit, or drive to
  • 19.
    •Doing More withLess •Changing Travel Patterns •Demand for More Travel Choices & Expanding Mobility •Increased Safety Concerns •Changing requests from our Communities Tools to address new challenges
  • 20.
    TRANSPORTATION DESIGN FORLIVABLE COMMUNITIES “It is the policy of the Department to consider Transportation Design for Livable Communities features on the State Highway System …” Principles: 1.Safety of all modes 2.Balancing community values and mobility needs 3.Efficient use of energy resources 4.Protection of the environment 5.Coordinated land use and transportation planning 6.Local and state economic development goals 7.Complementing and enhancing existing Department standards and processes Chapter 21 of Plans Preparation Manual: TDLC credit: Eric E Johnson / Flickr
  • 21.
    Talking about AccommodatingAll Modes in Design is too Late Planning PD&E Design ROW Impacts ($, Public Trust, Mitigation) Construction Built Project •More Costly •More Community Controversy •More Mitigation Cost •Least cost •More opportunities to incorporate community goals •Greater flexibility to evaluate a wide range of options
  • 22.
    State Directives Regional Planning And Priorities (LRTPs) Planning Capital Improvement Programs PD&E & Preliminary Engineering Final Design & Permitting ROW & Utilities Construction & Maintenance When should we plan?
  • 23.
    What projects doyou want? What problems do we have? How can we leverage our investments to make us more sustainable and competitive? Multi-Modal Planning Stronger planning leads to better results What opportunities do we have?
  • 24.
  • 26.
    Land Use Strategies •Land Use Policies/Regulations •Detailed Land Use Plans •Land Use Programs •Other Land Use Strategies Transportation Strategies (all modes) •Capital Improvements •Transportation Operations •Maintenance Project •More Detailed/Area-Specific Transportation Plans and Programs •Other Transportation Strategies Other Strategies •Utility/Infrastructure Improvements •Organizational Changes •Do nothing (No-Build) •Other Strategies Planning within the project development process Long Range Transportation Plans FDOT Operations Other Sources Sources for Planning Studies Multi-modal Corridor Planning
  • 27.
    It is oknot to know the solution!
  • 28.
    It is oknot to know the problem!
  • 29.
  • 30.
    Transportation & CommunityBuilding Strategies from the SR 50 Multi-Modal Corridor Study
  • 31.
    •4-lane major arterial,recently widened to 6 lanes •Future travel demand far exceeds future capacity •Limited alternative parallel network •Roadway being used for BOTH local and regional trips •Designated a multi-modal corridor in TRANSPORTATION 2035 •Multi-modal solutions viable only with land use strategies Lake Apopka Lake Minneola Lake Minnehaha Citrus Tower Hancock Avalon Hartwood Marsh Johns Lake SR 50 the challenge
  • 32.
    1974 The Turnpike- now completed - provides a new and faster connection to N & S Florida Small subdivisions become a more common as a development type Commercial Development starts along SR 50 near US 27 Residential development continues S & E of downtown
  • 33.
    1999 Citrus TowerBlvd becomes a major connection to SR-50 Rapid residential development occurs
  • 34.
    2010 Few sectionsof local network added Most of undeveloped land is located along the south side of SR 50 and East of US 27 Development of large commercial parcels becomes common Some development on previously approved master planned communities continues
  • 35.
    Weekday AM PeakEast Bound Traffic Weekday PM Peak West Bound Traffic Corridor used for local traffic
  • 36.
    Network does notsupport effective multi-modal local traffic Historic Clermont Street Network Newer development East of Clermont
  • 37.
    1 Preserve &Celebrate Our Landscape 2 Preserve Historic Character & Sense of Place 3 More Play 4 Enhance Local Connectivity & Walkability 5 “Turn the Car Around” community values & guiding principles
  • 38.
    Scenario A ScenarioB Existing Roadway Proposed Roadway Existing Multi-use Trail Proposed Multi-use Trail Potential Bus Stop
  • 39.
  • 40.
  • 41.
  • 42.
    a system ofcomplete streets
  • 43.
  • 44.
  • 45.
    credit: Pablo Abreu/ Flickr Evolving DOT Role Reactive to Land Use Decisions Proactive Partner CSS & Multi-Modal Mobility Auto Through- put Economic Development & Other Community Goals
  • 46.
    Thank you! http://cfgis.org/FDOT-Resources/Resource-Guidebooks.aspx Jane Lim-Yap, AICP jlim-yap@kittelson.com John P. Moore, EI john.moore@state.dot.fl.us