Downloaded 123 times

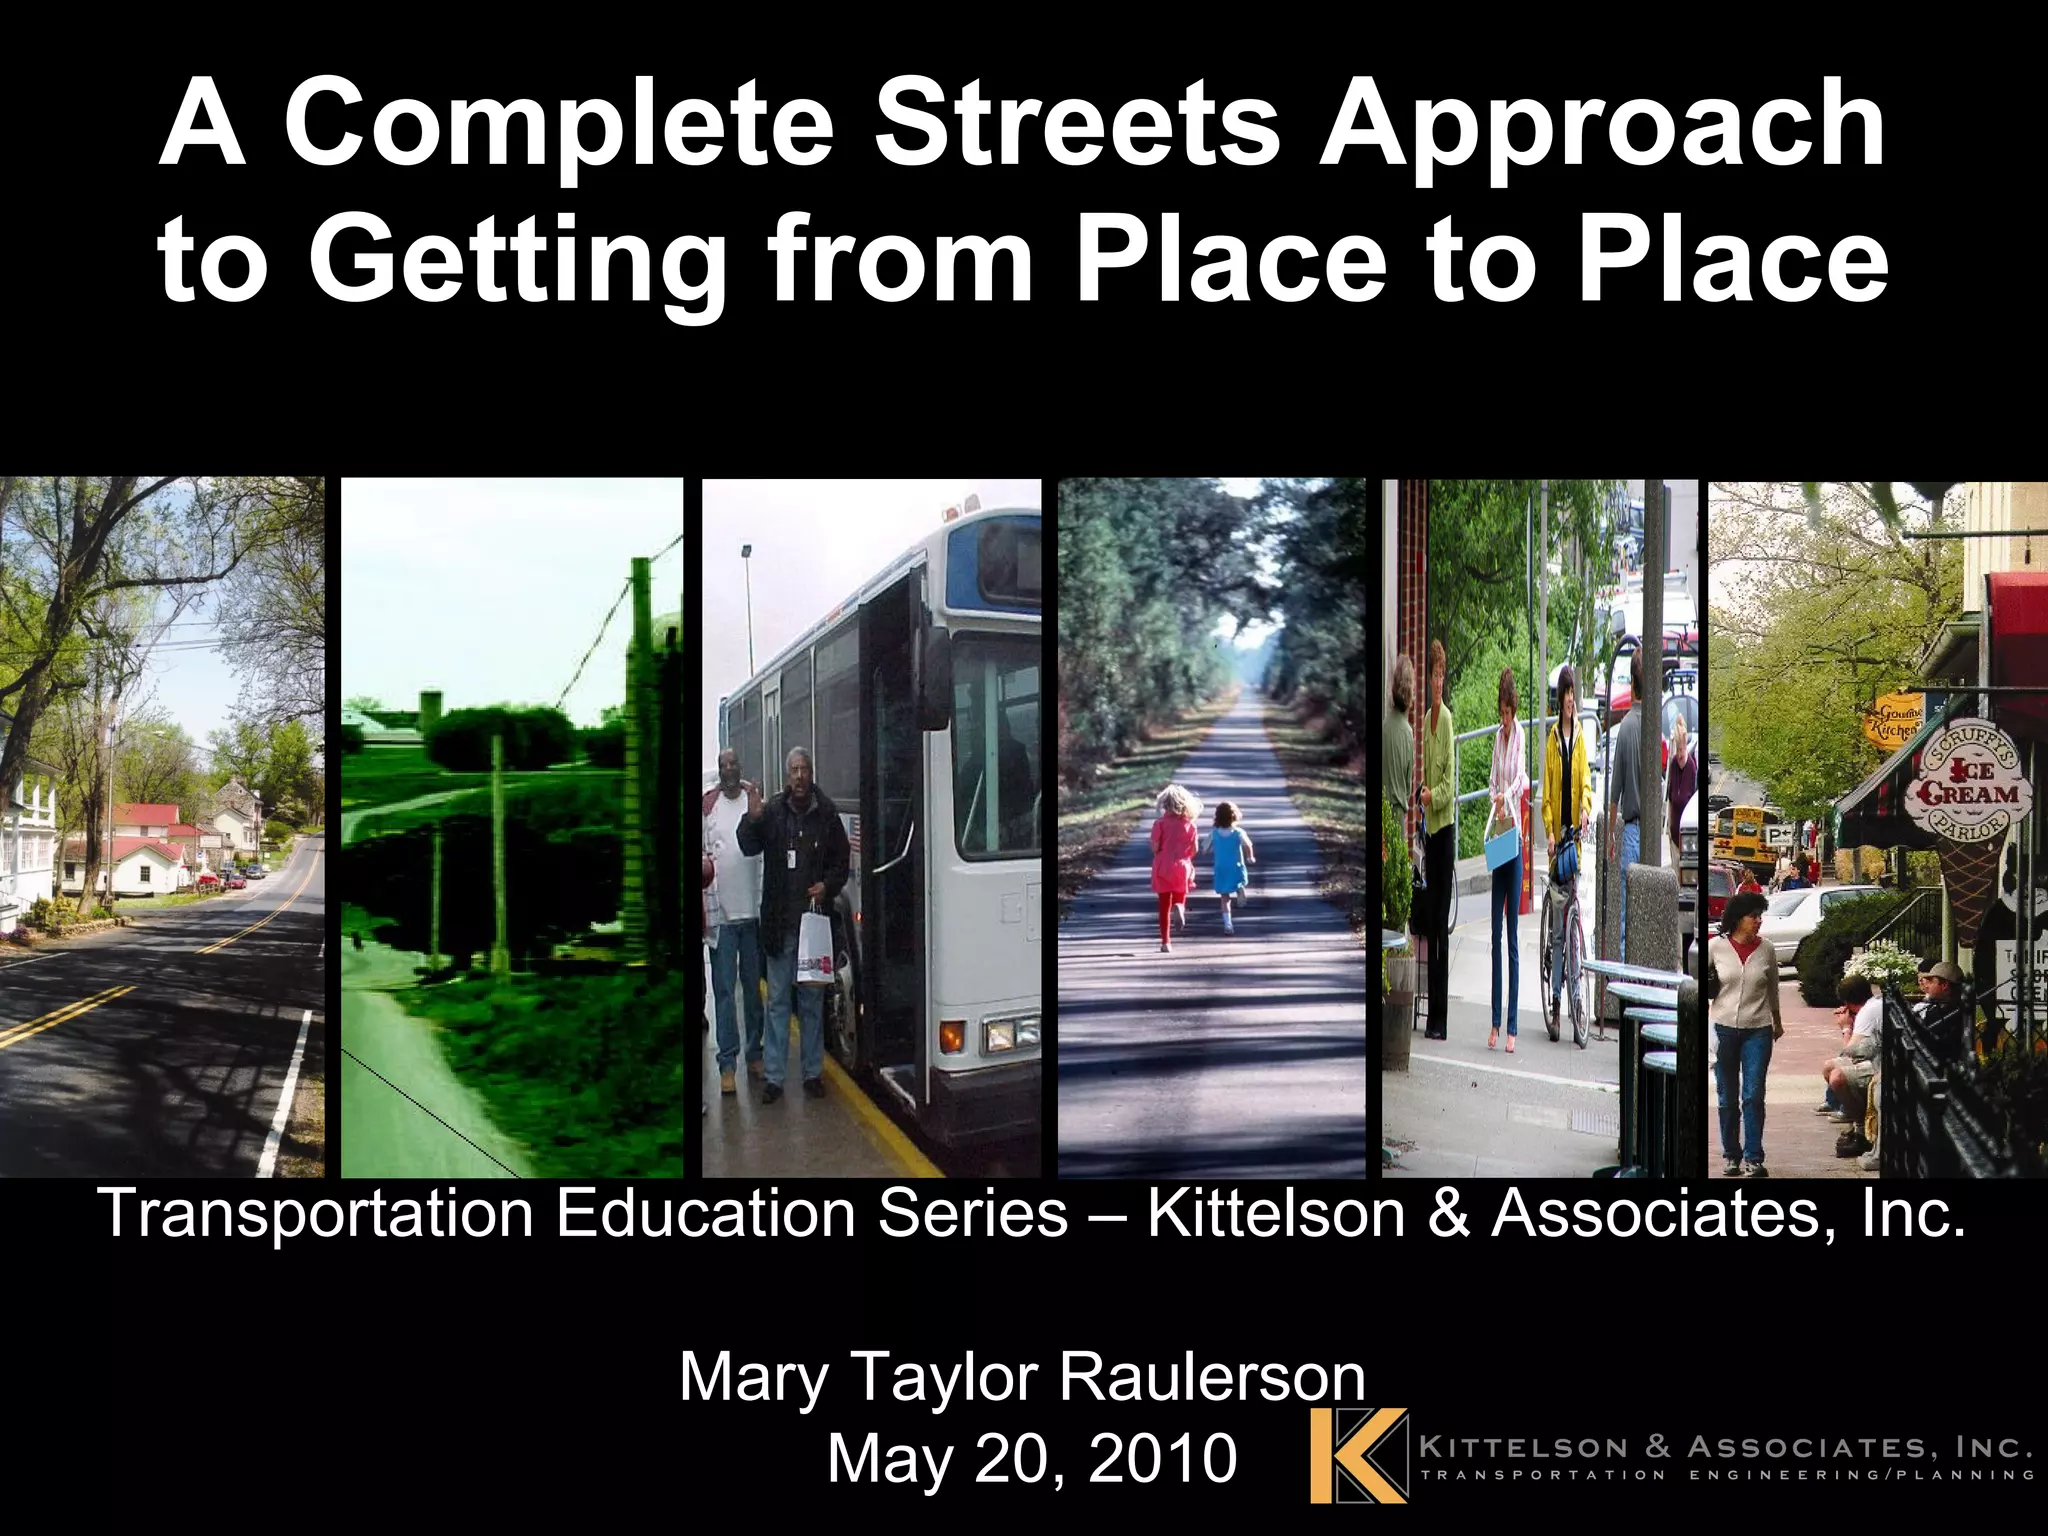

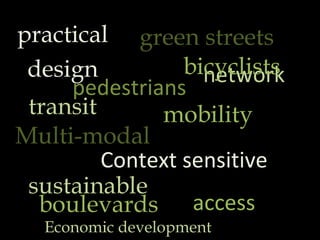
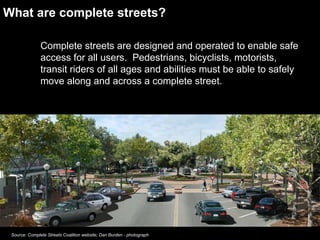


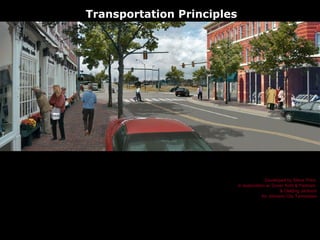

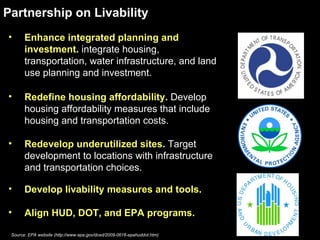


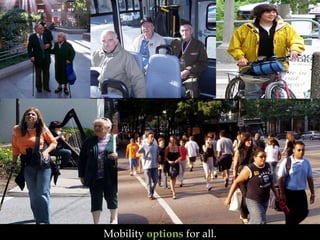

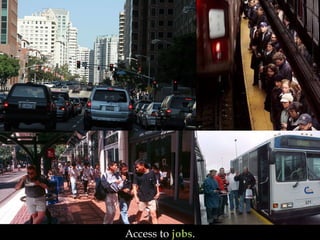
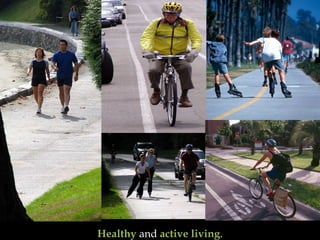

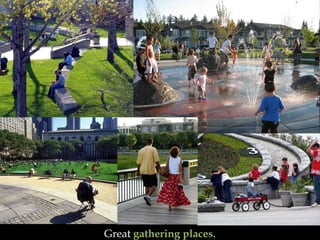
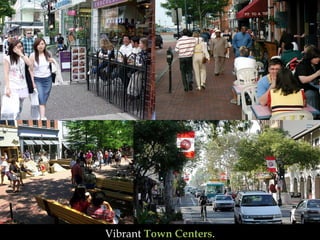


The document discusses the concept of 'complete streets,' which are designed to ensure safe access for all users, including pedestrians, cyclists, and motorists, thereby promoting livability in transportation planning. It emphasizes the need for integrated planning that encompasses housing, transportation, and community development, and highlights the challenges faced in implementing livable transportation projects. Various case studies illustrate the importance of visioning, partnerships, and context-sensitive design in achieving successful transportation outcomes.


