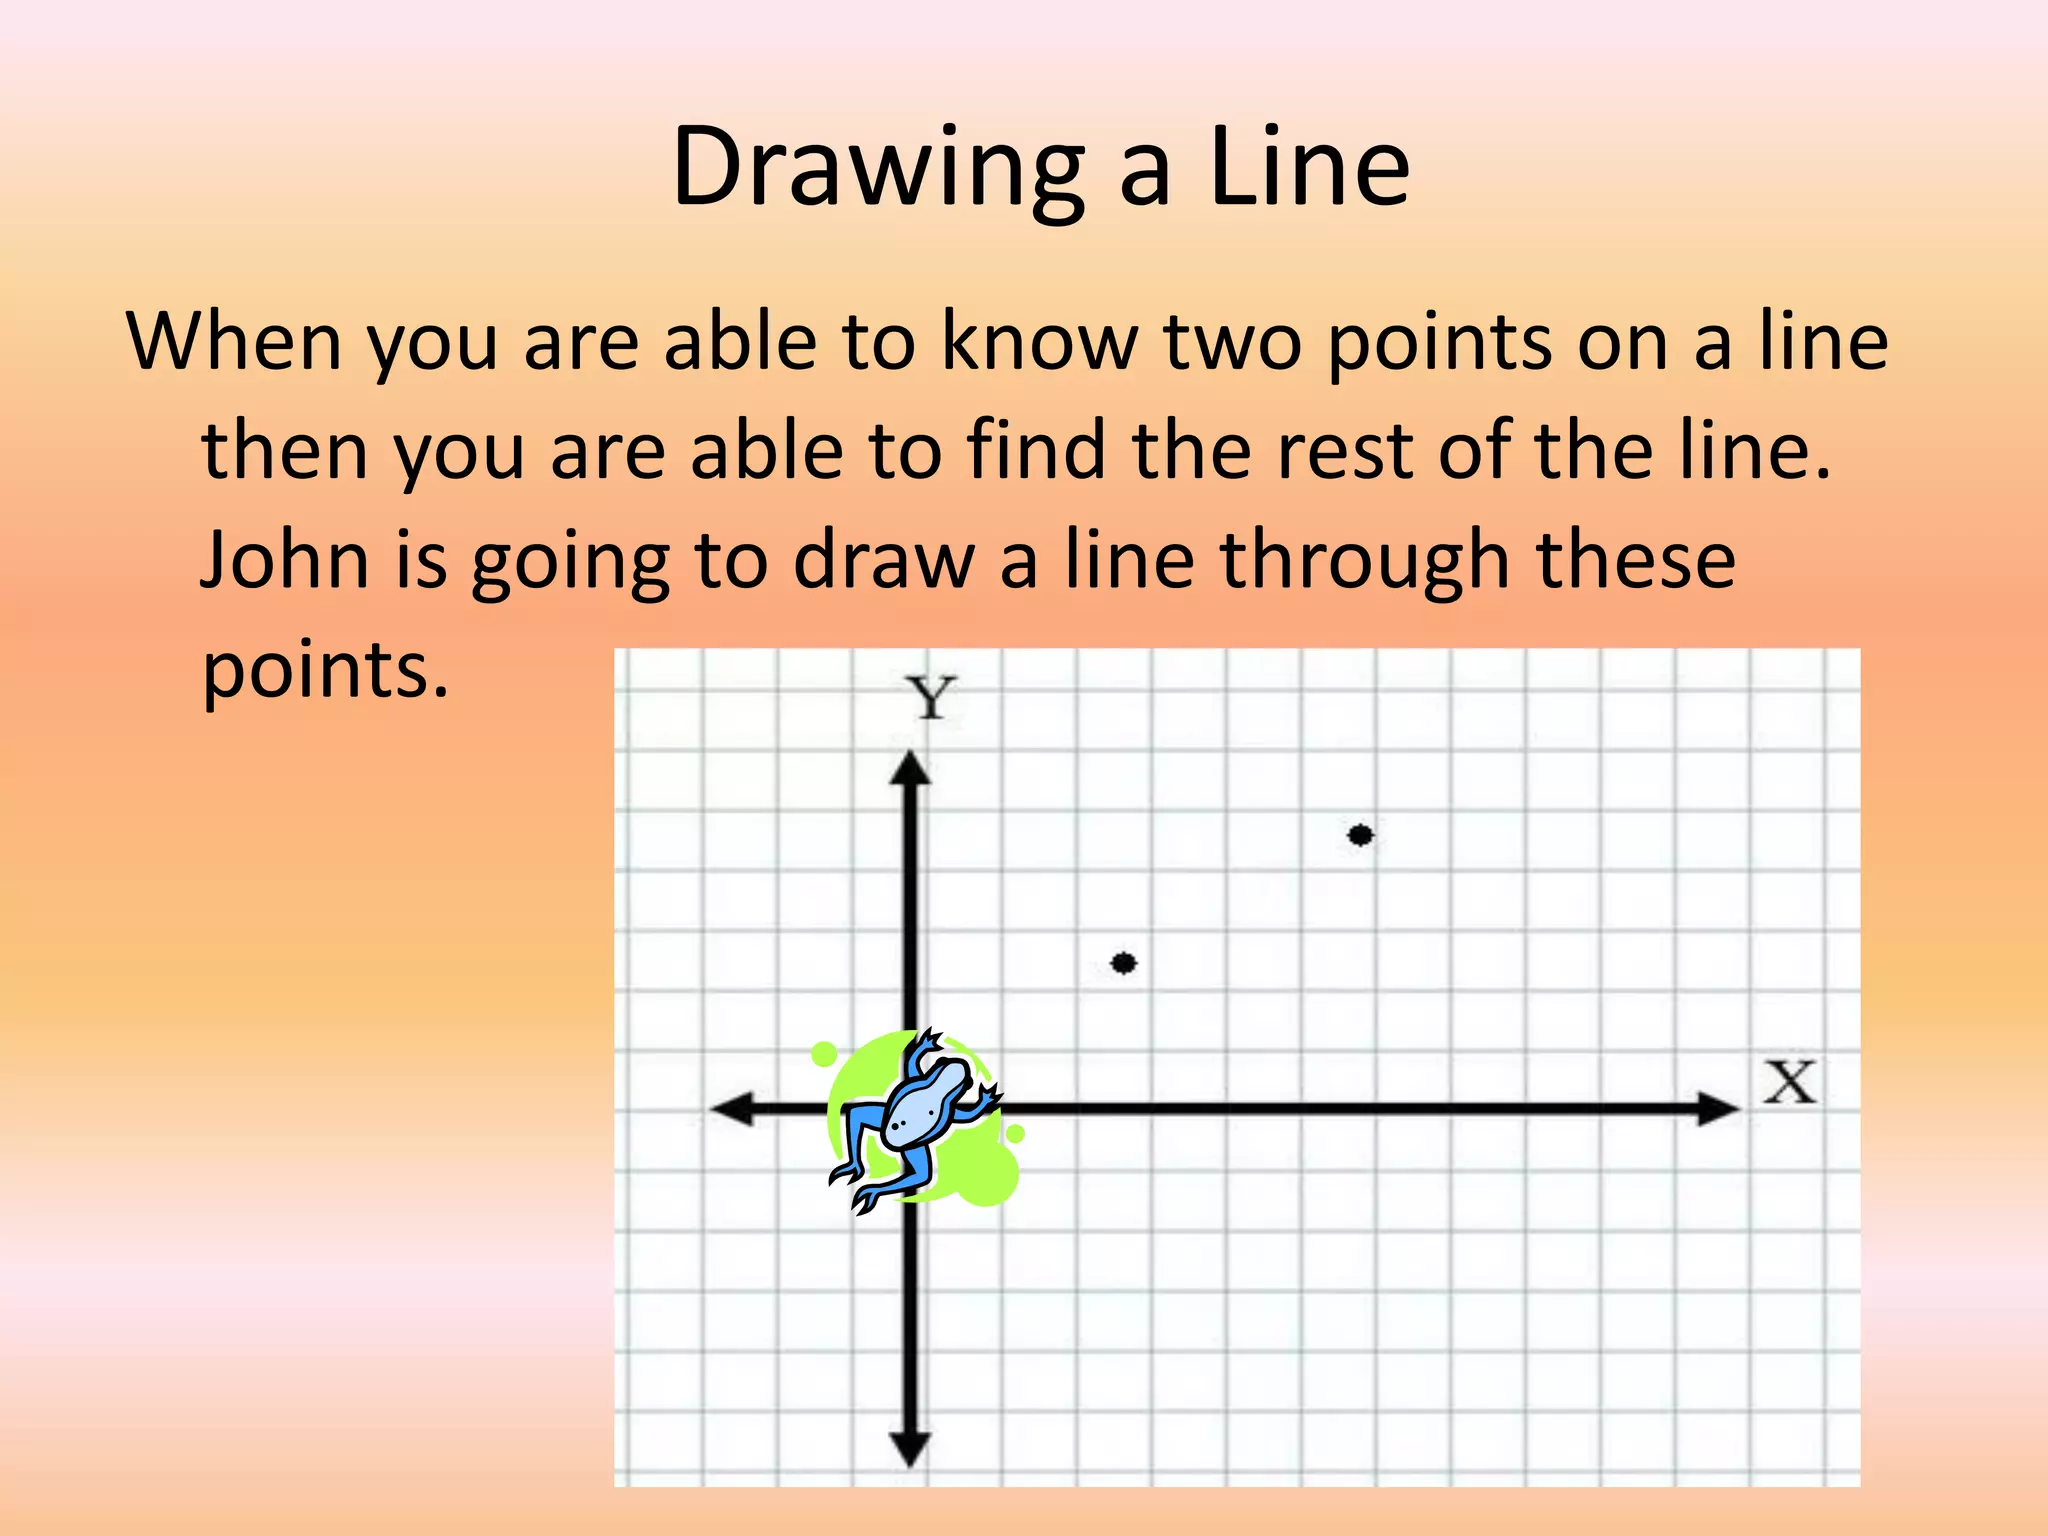
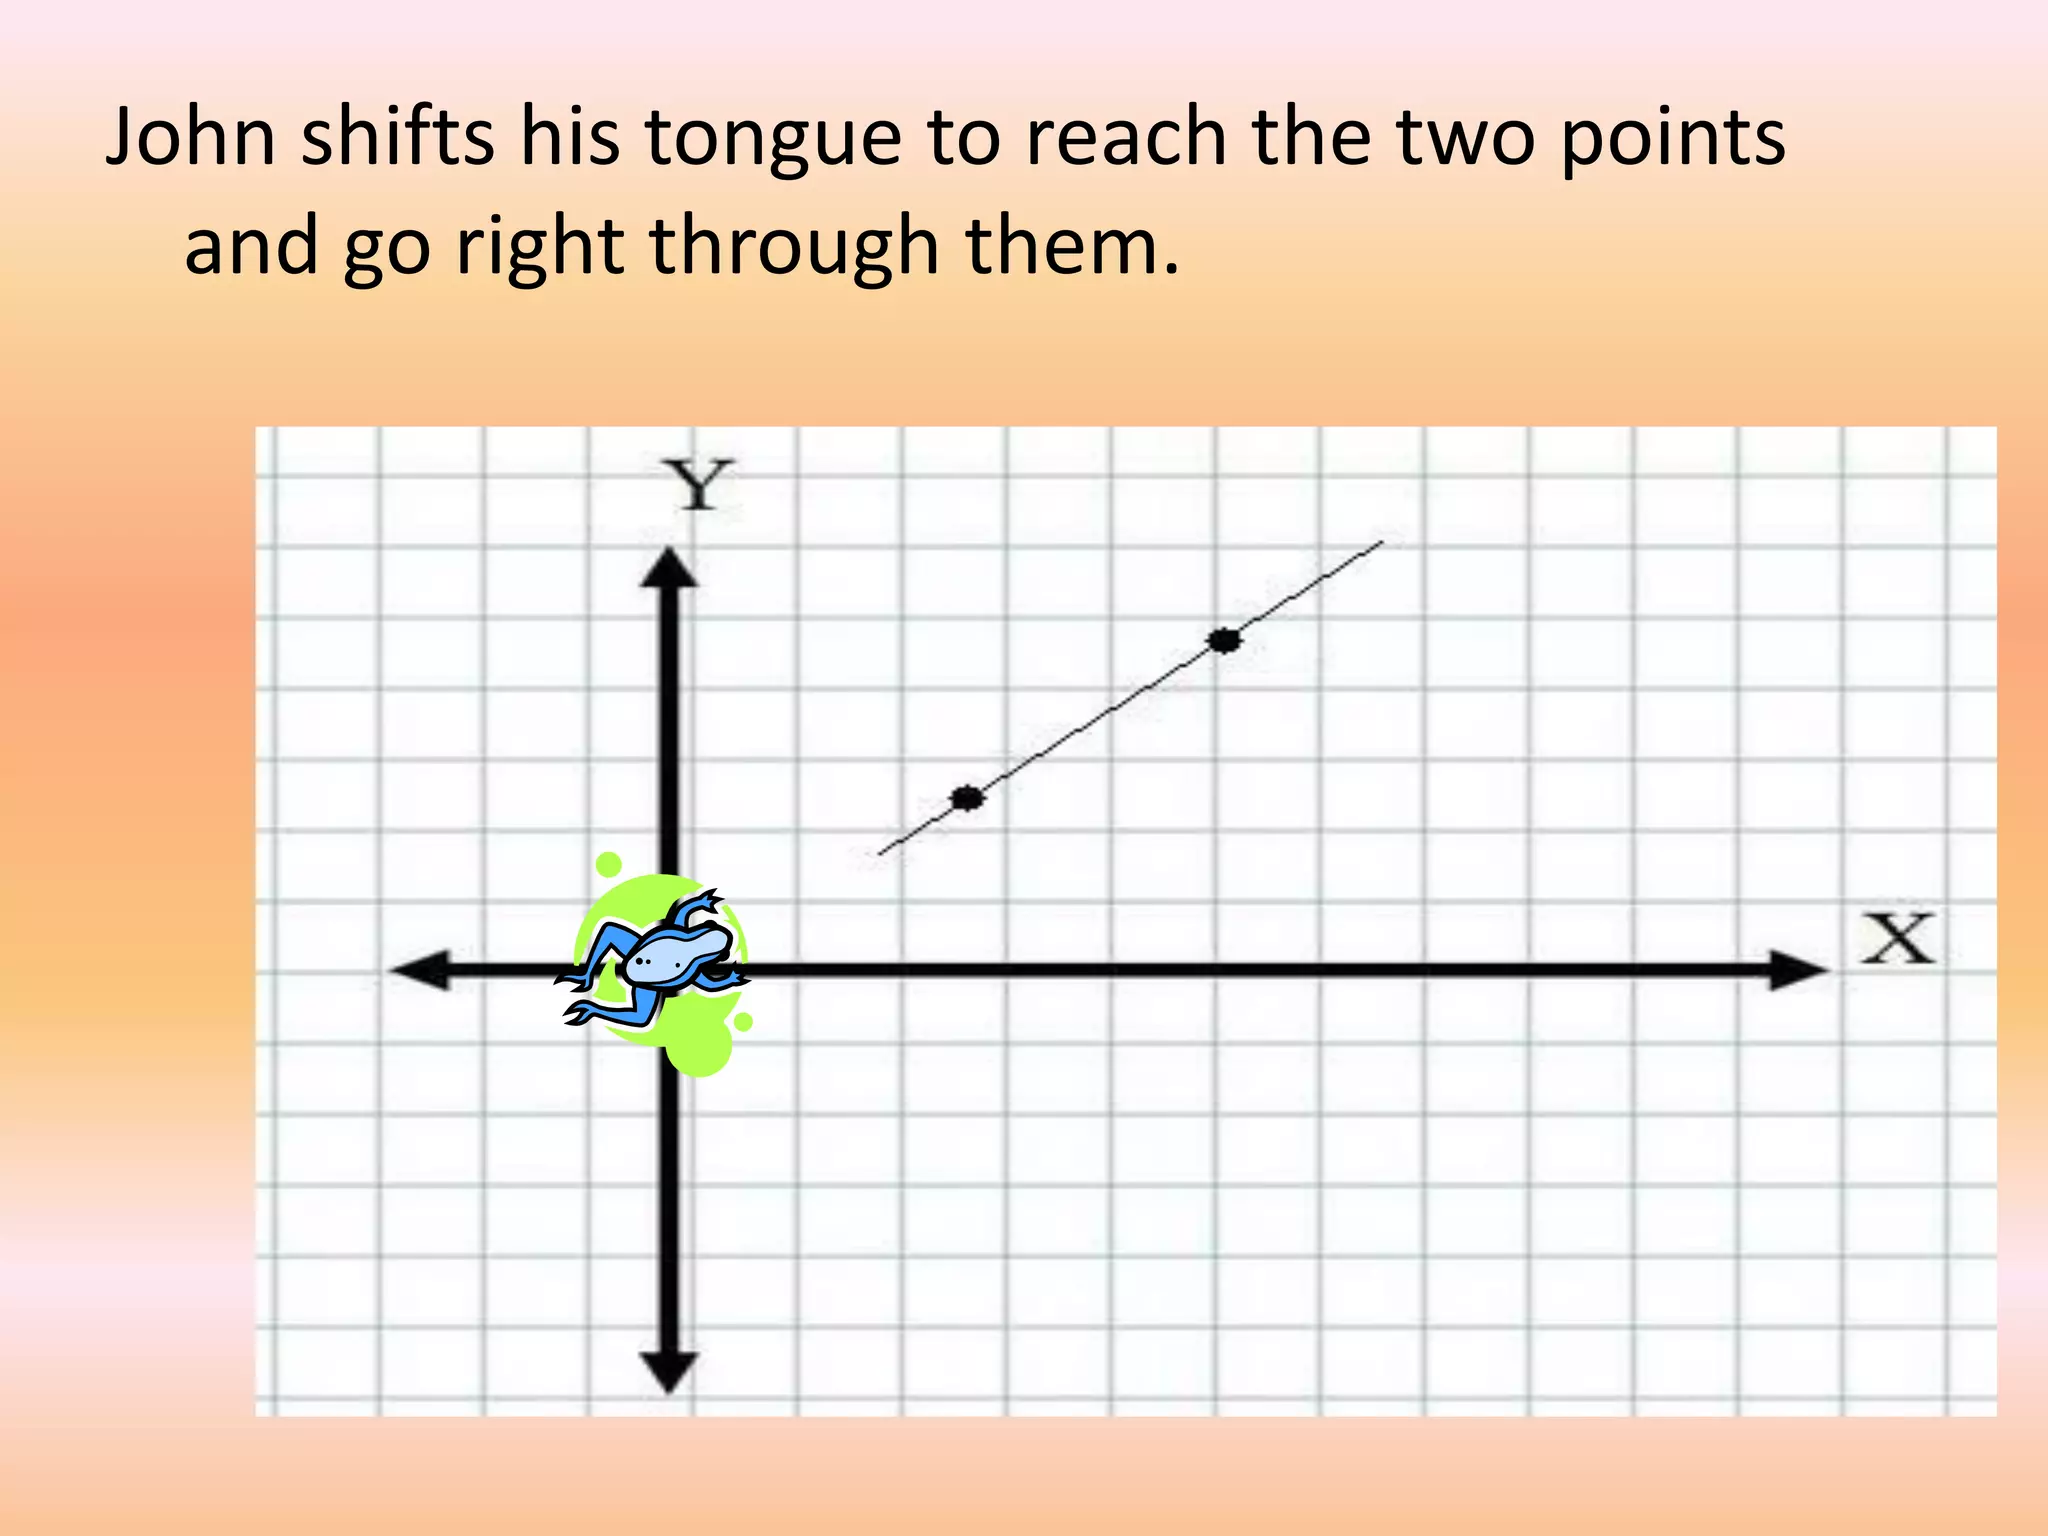
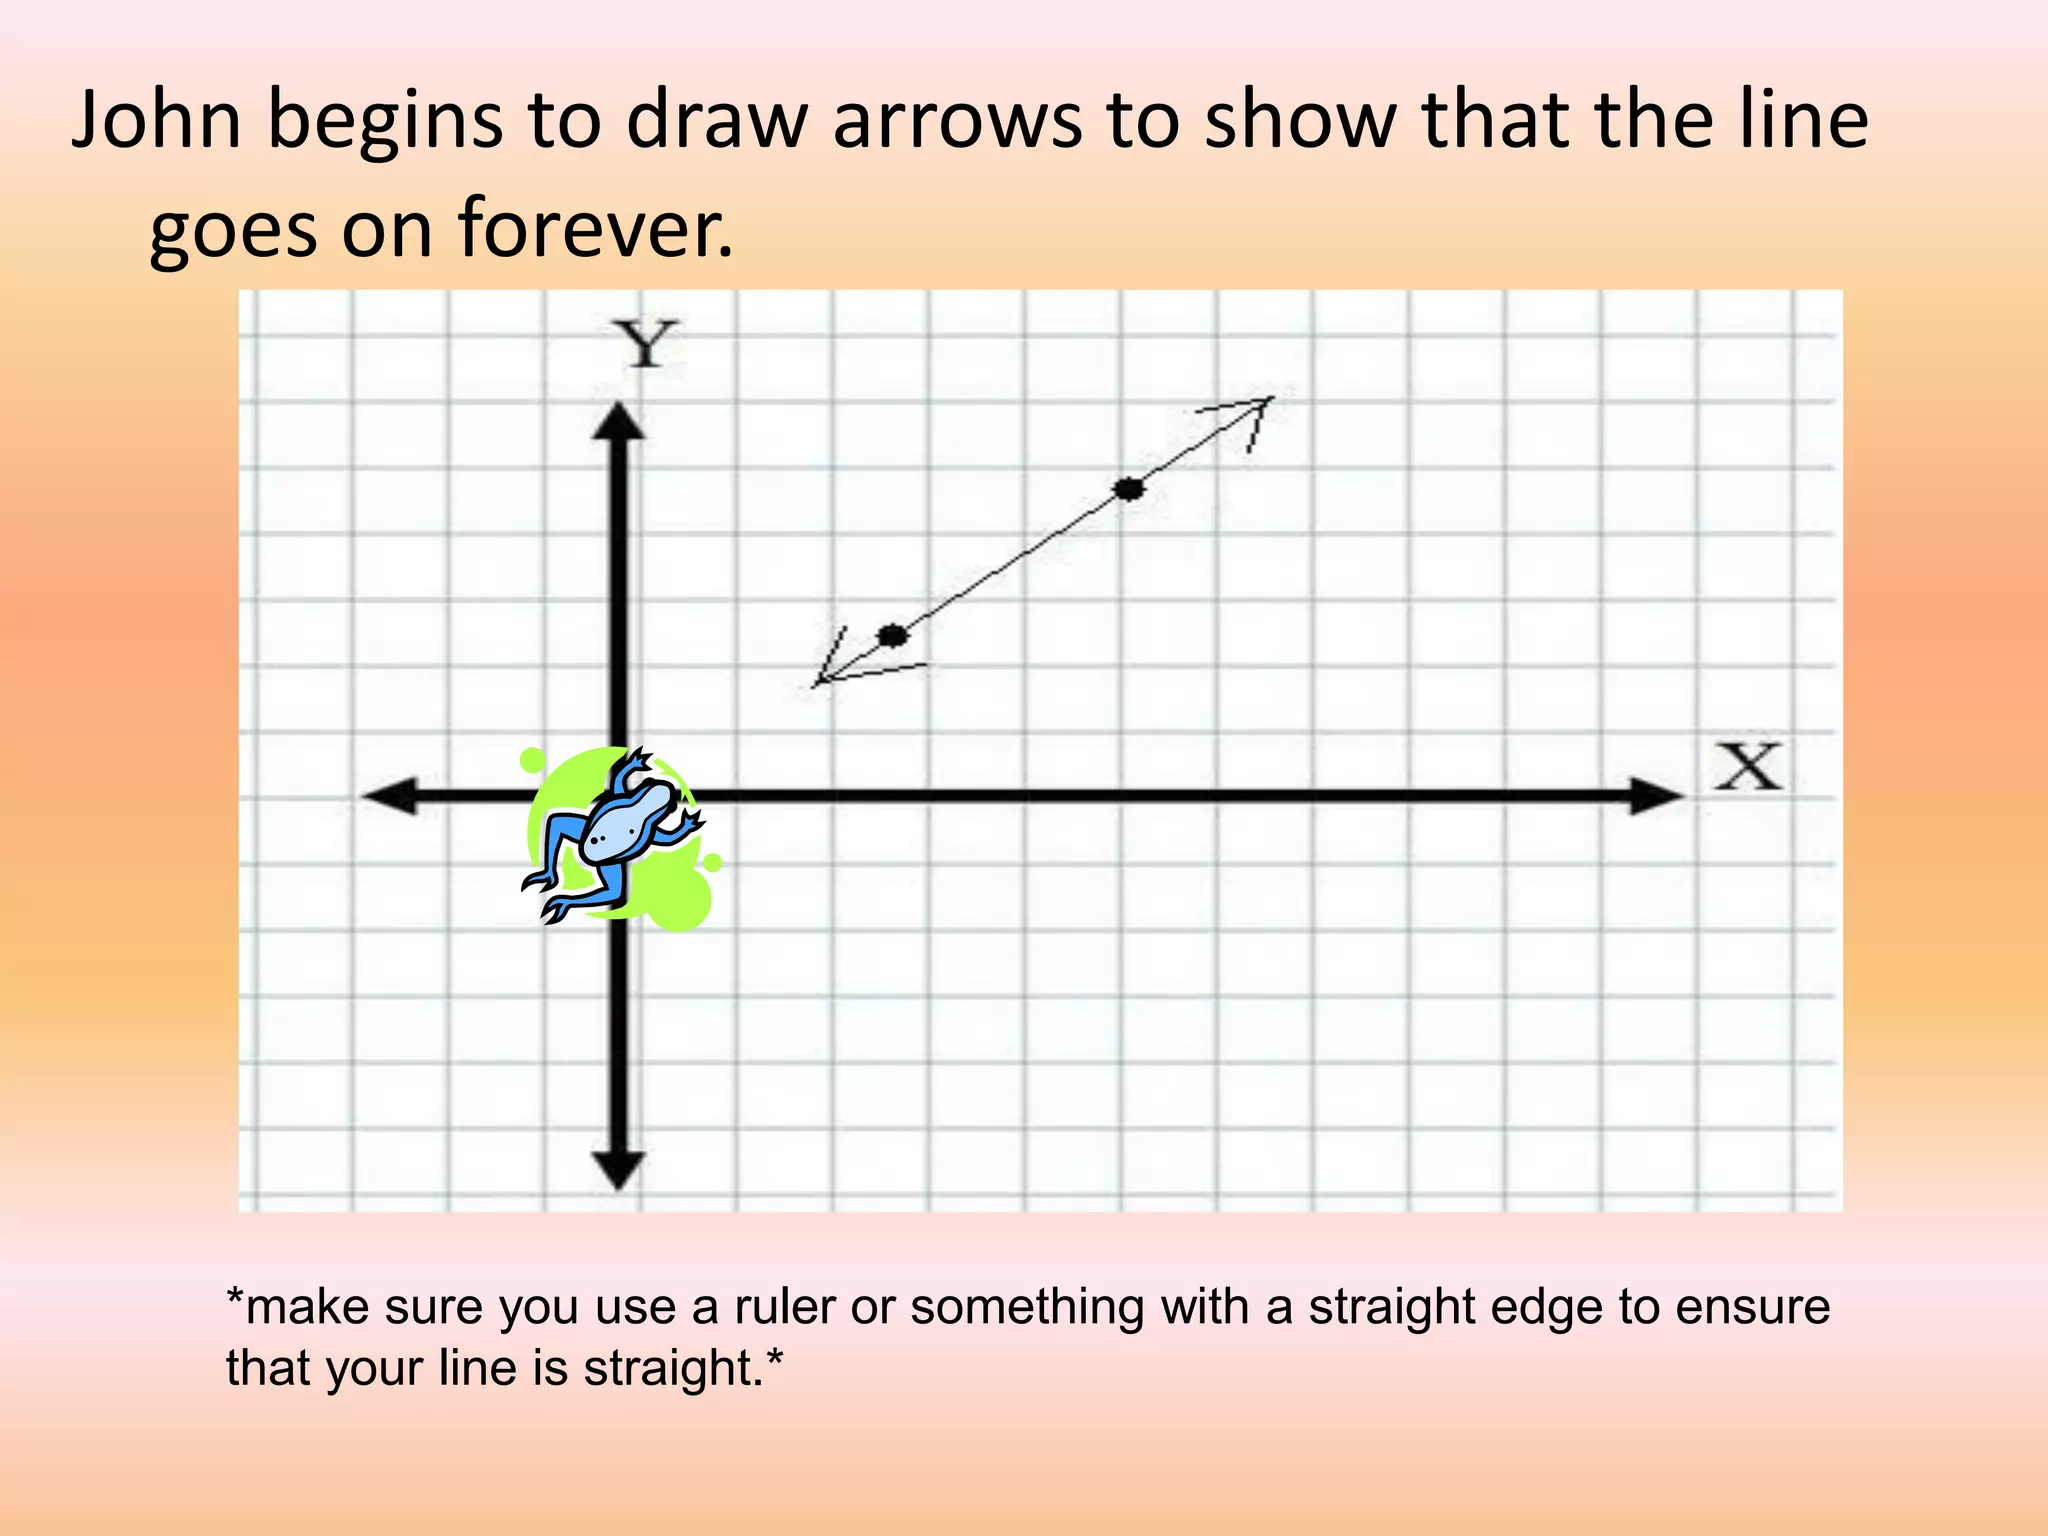
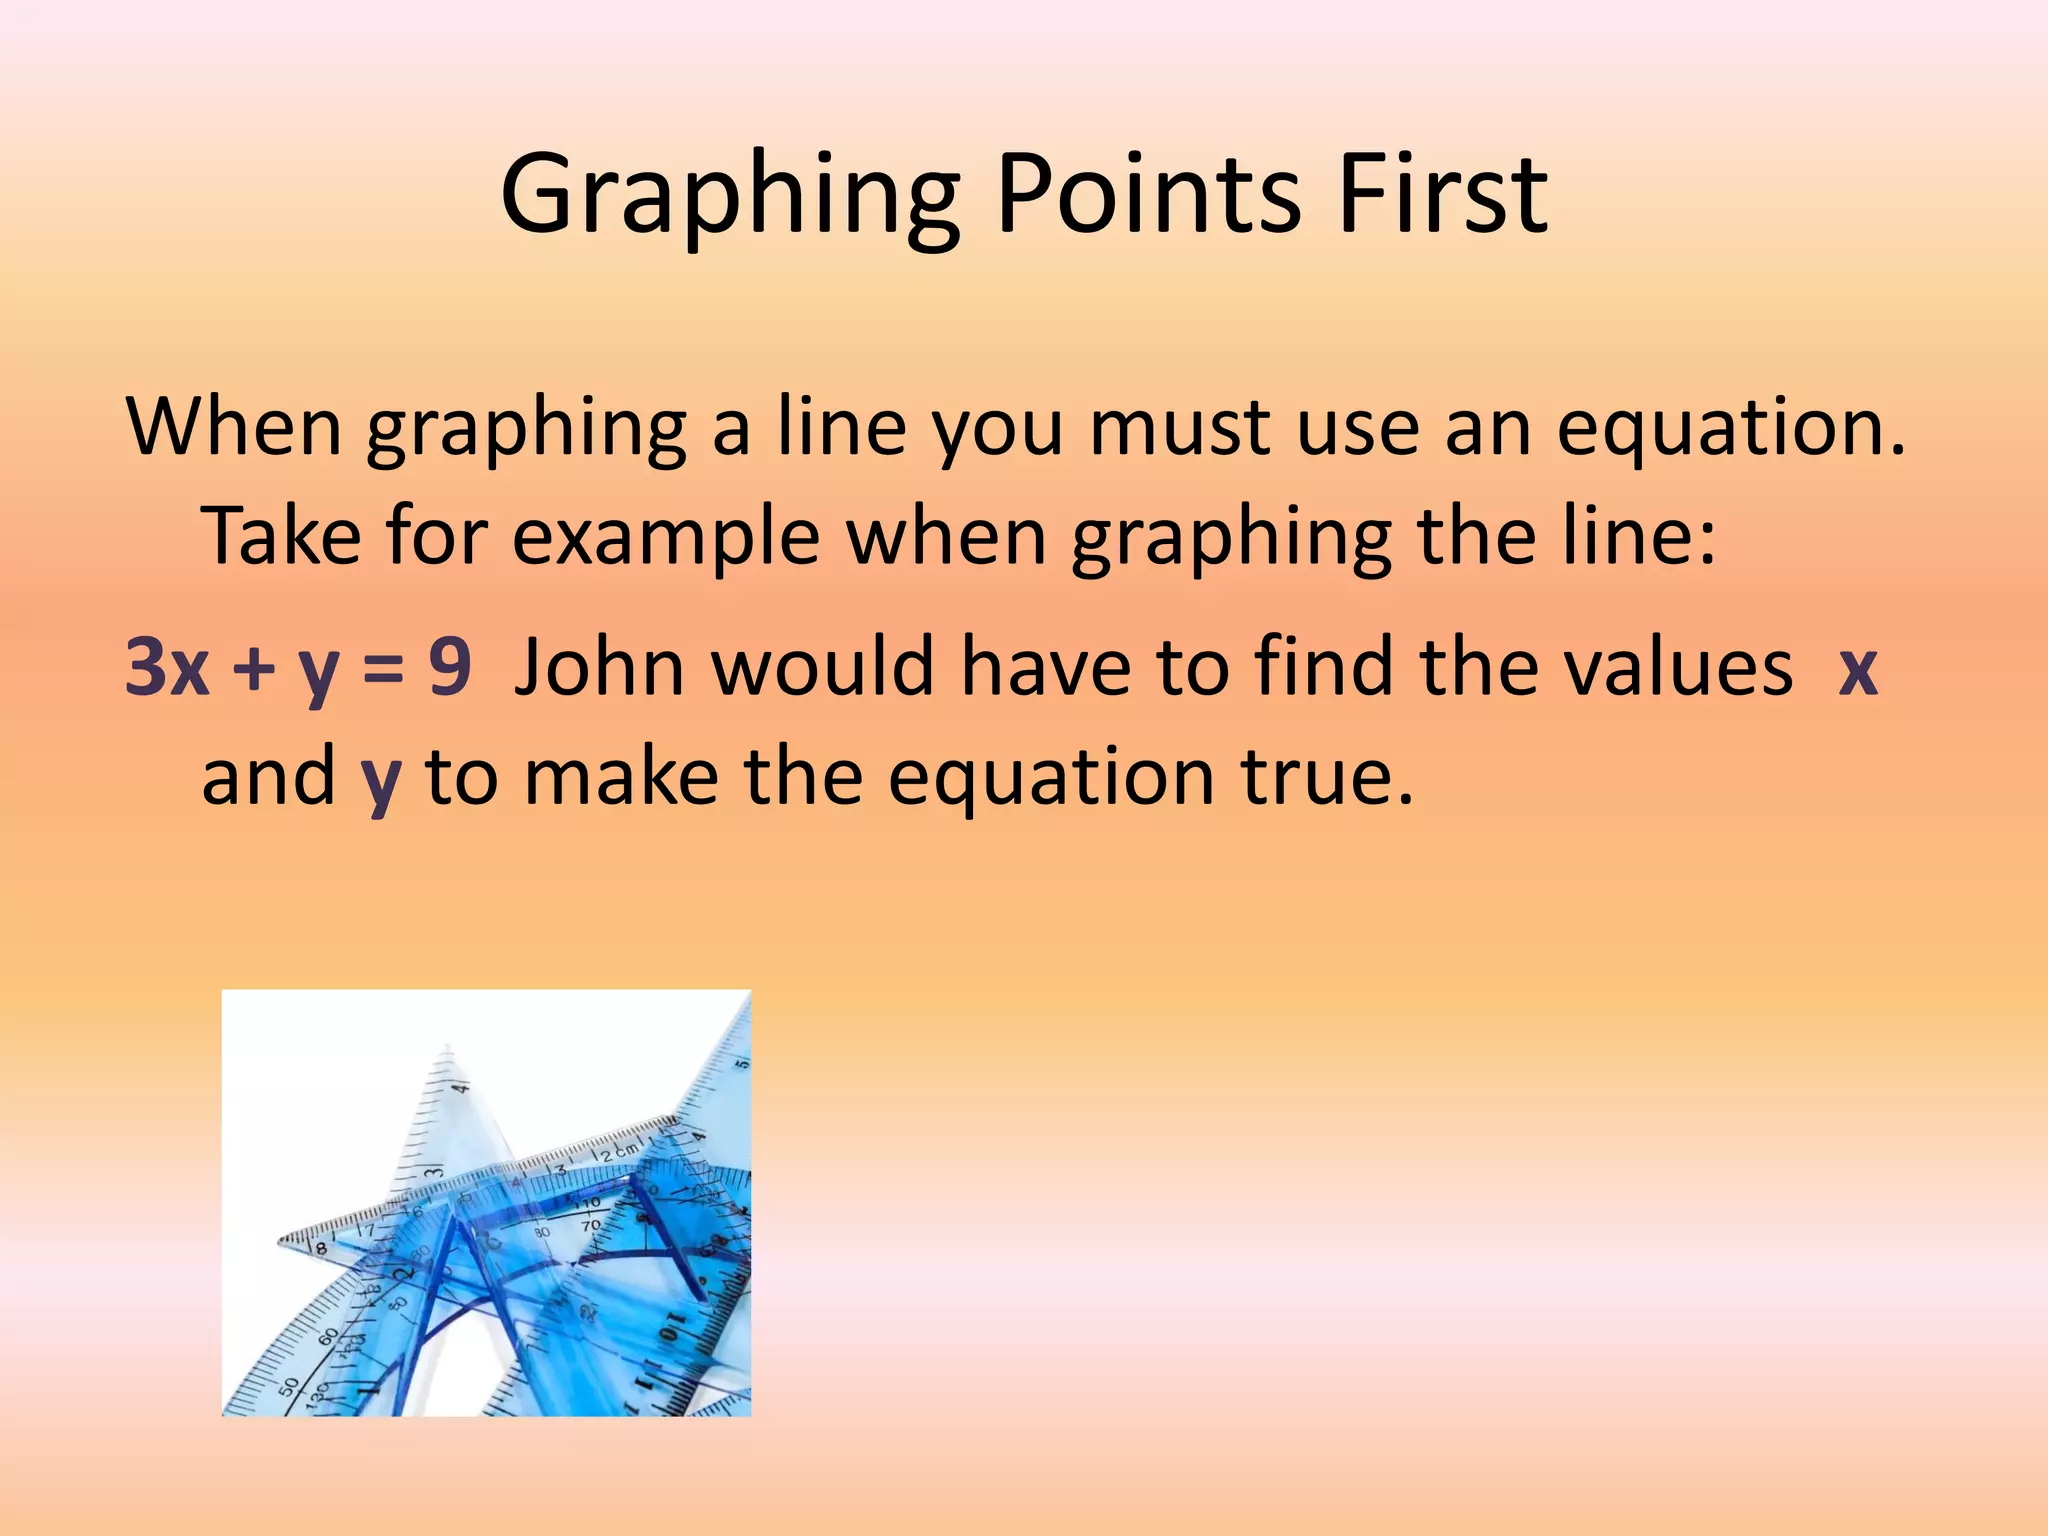
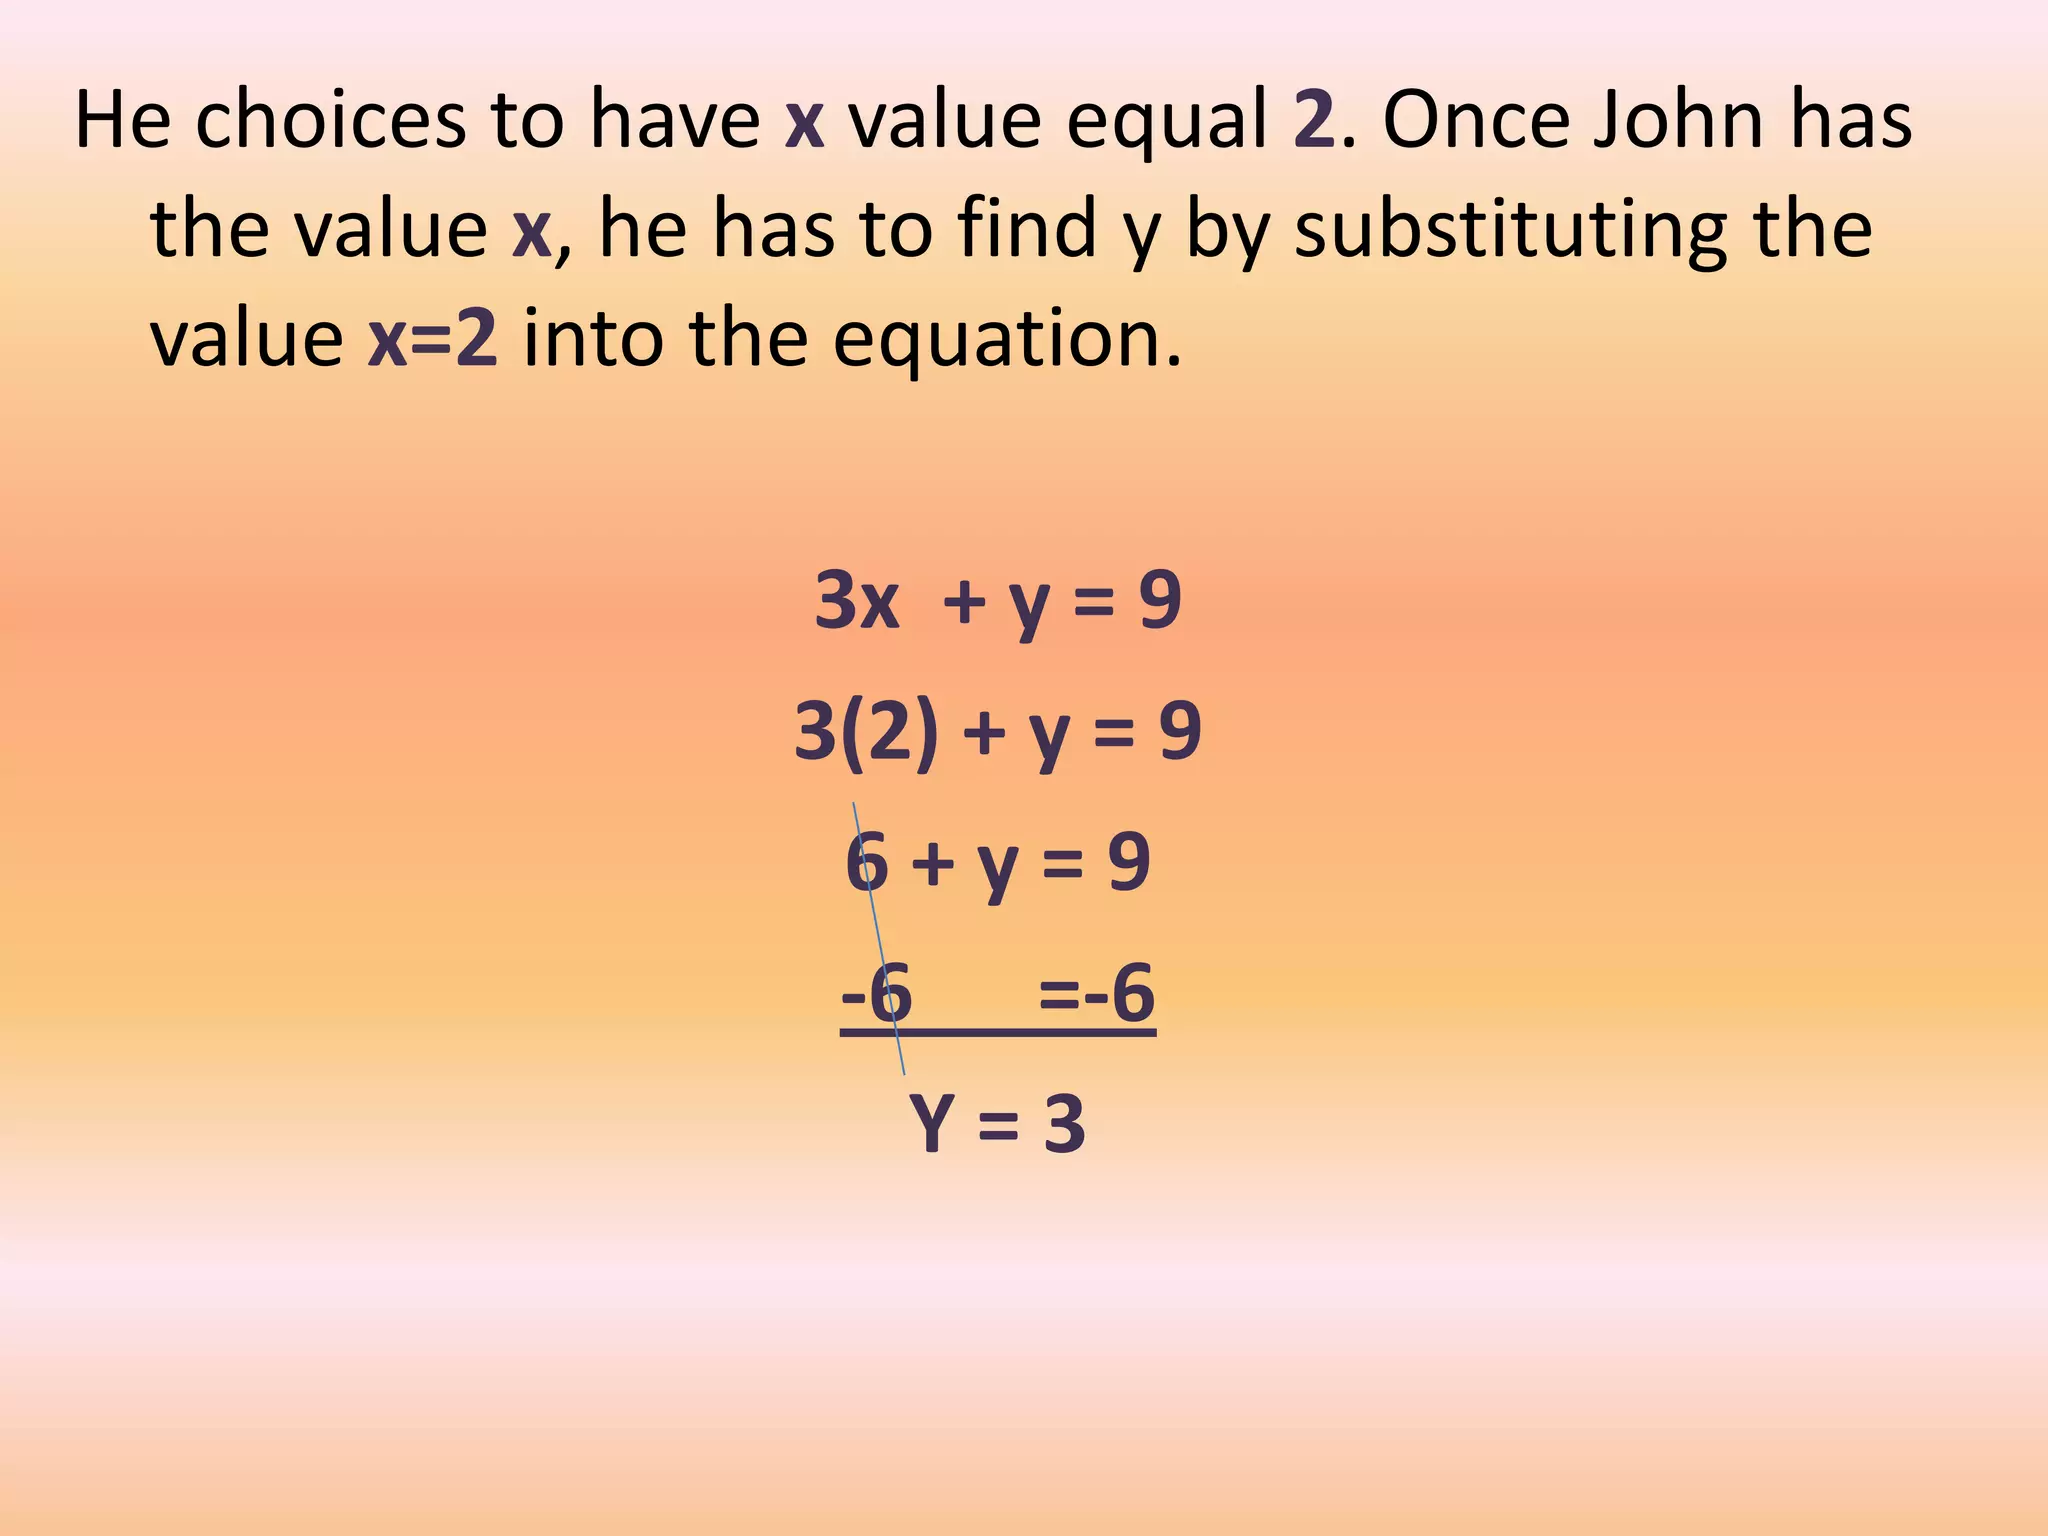
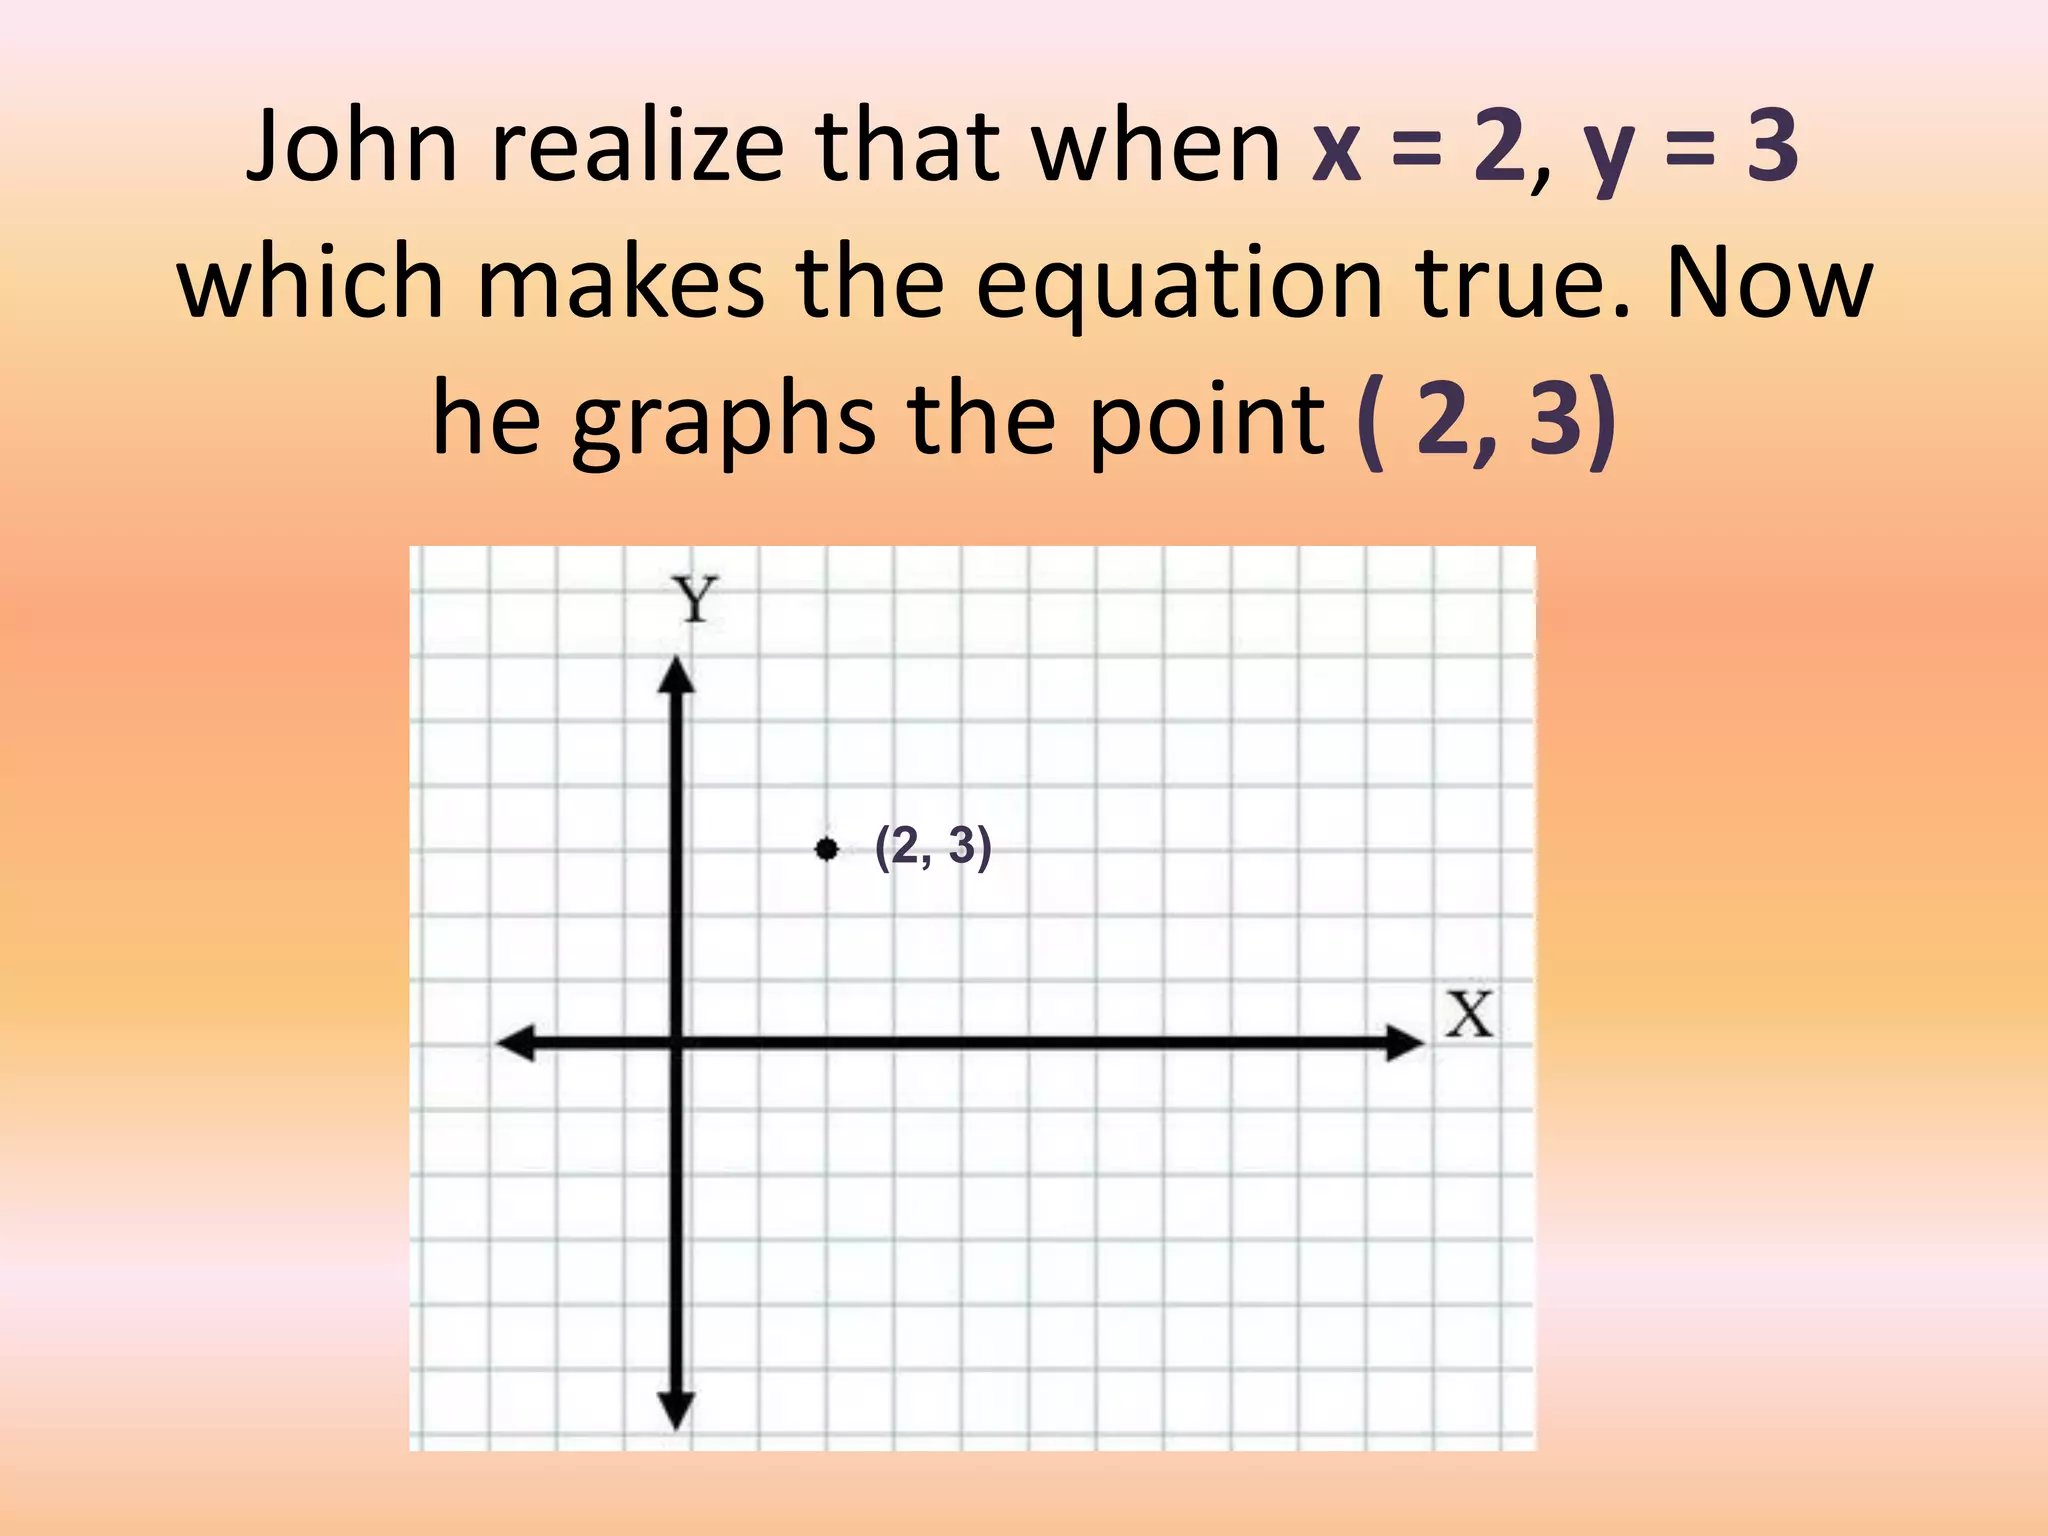
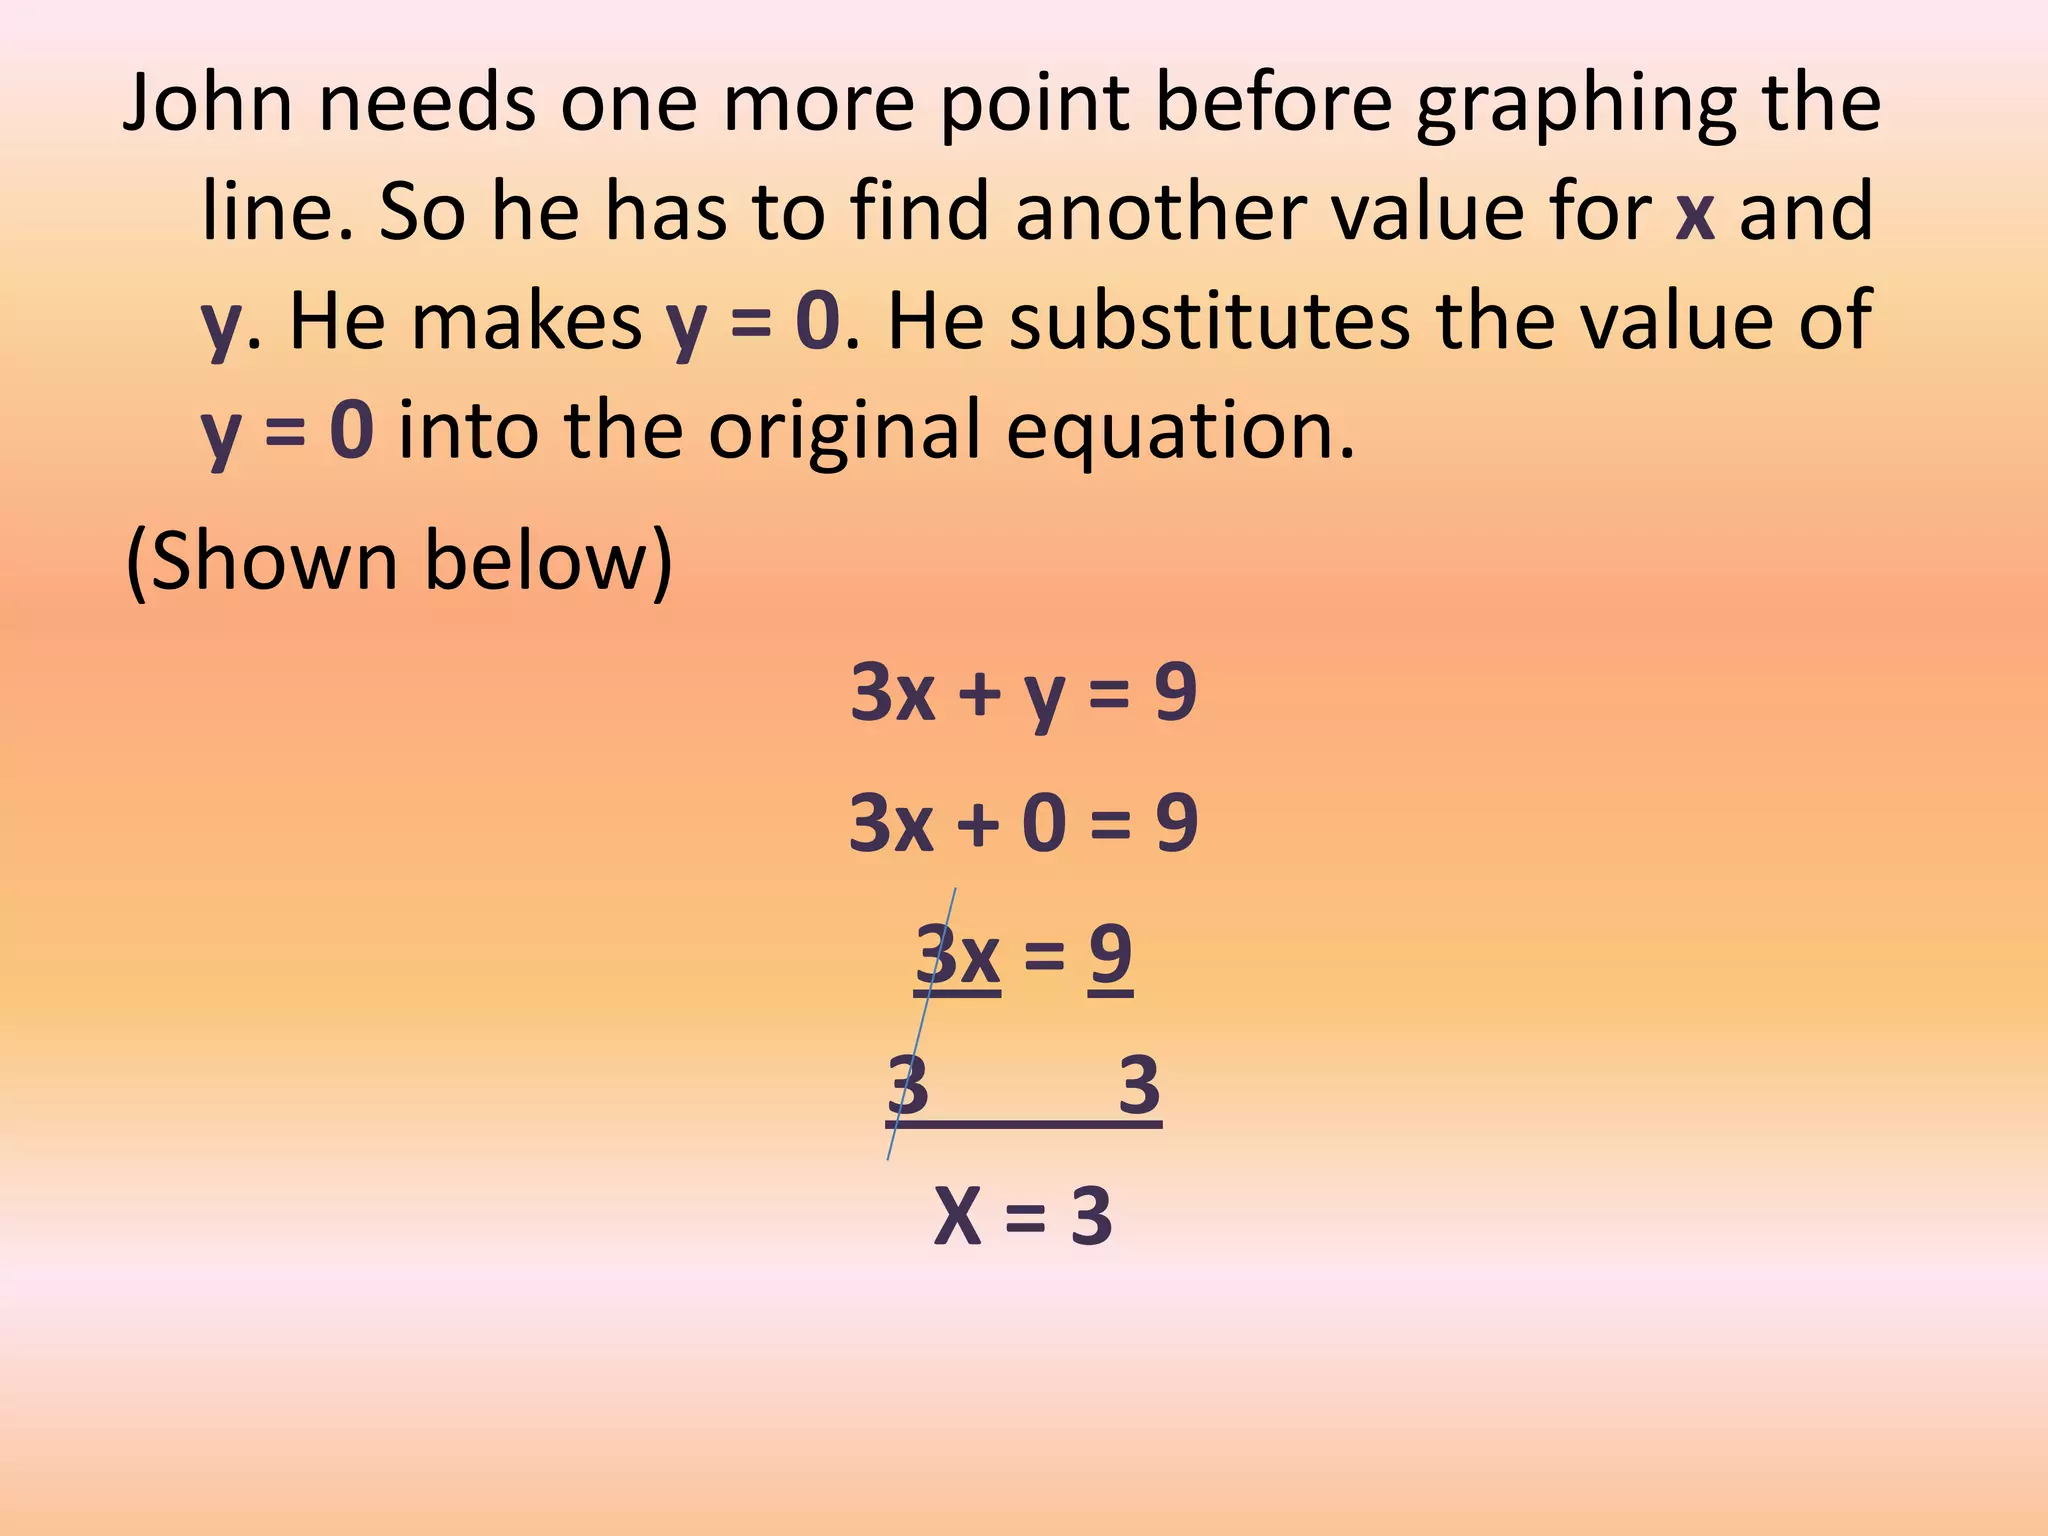
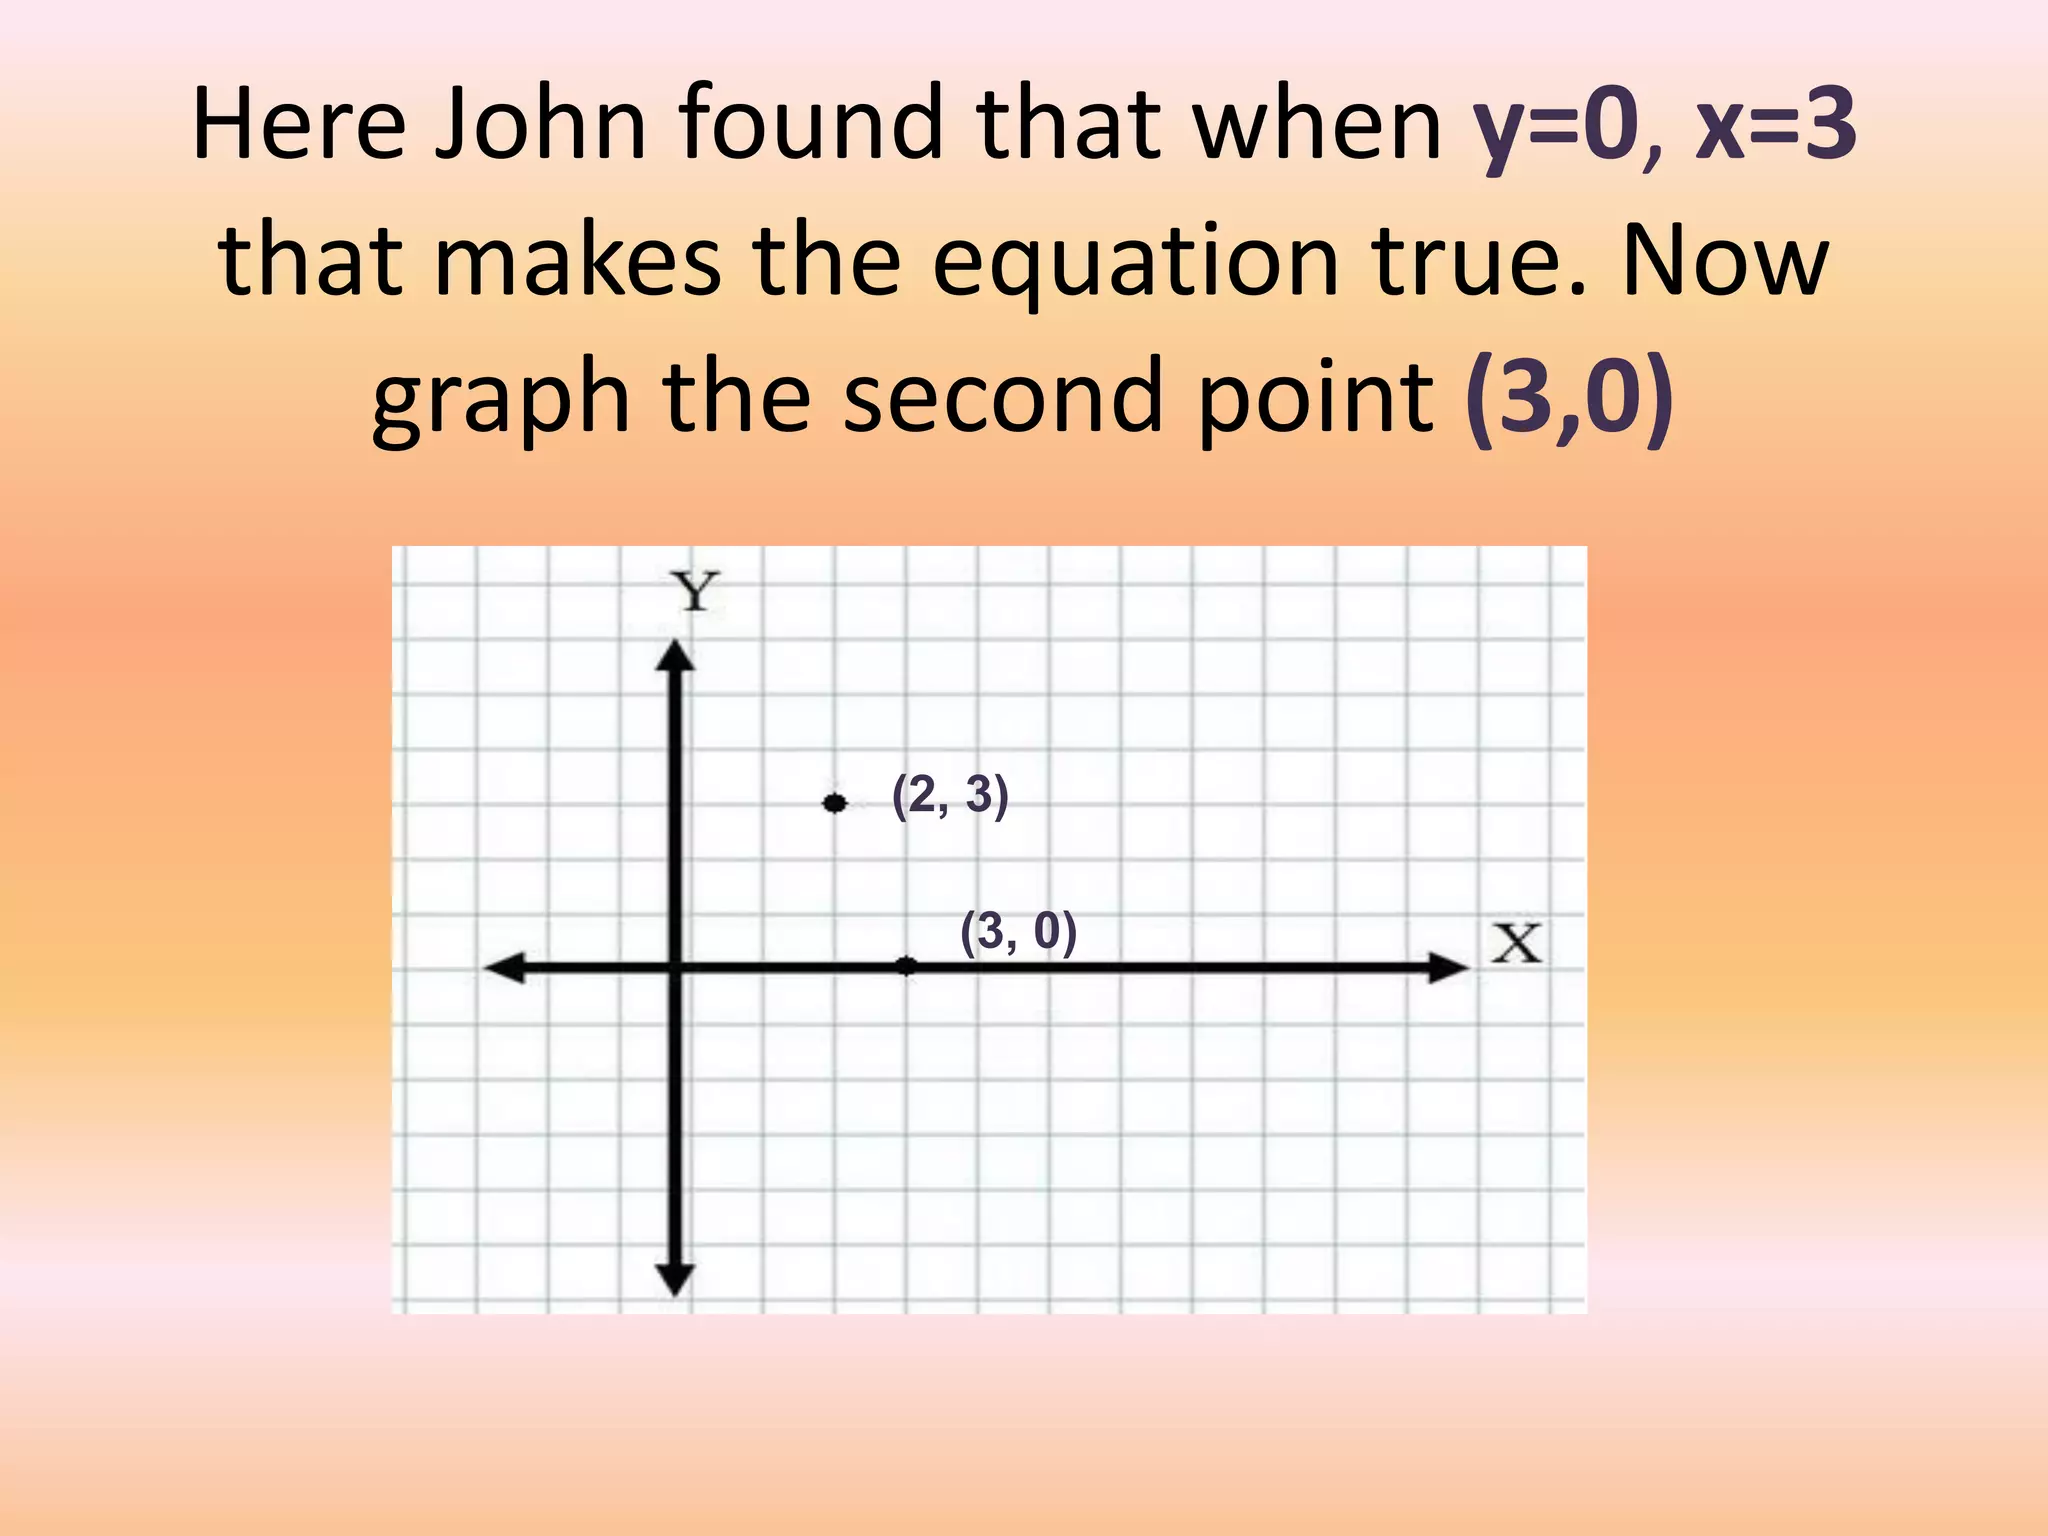
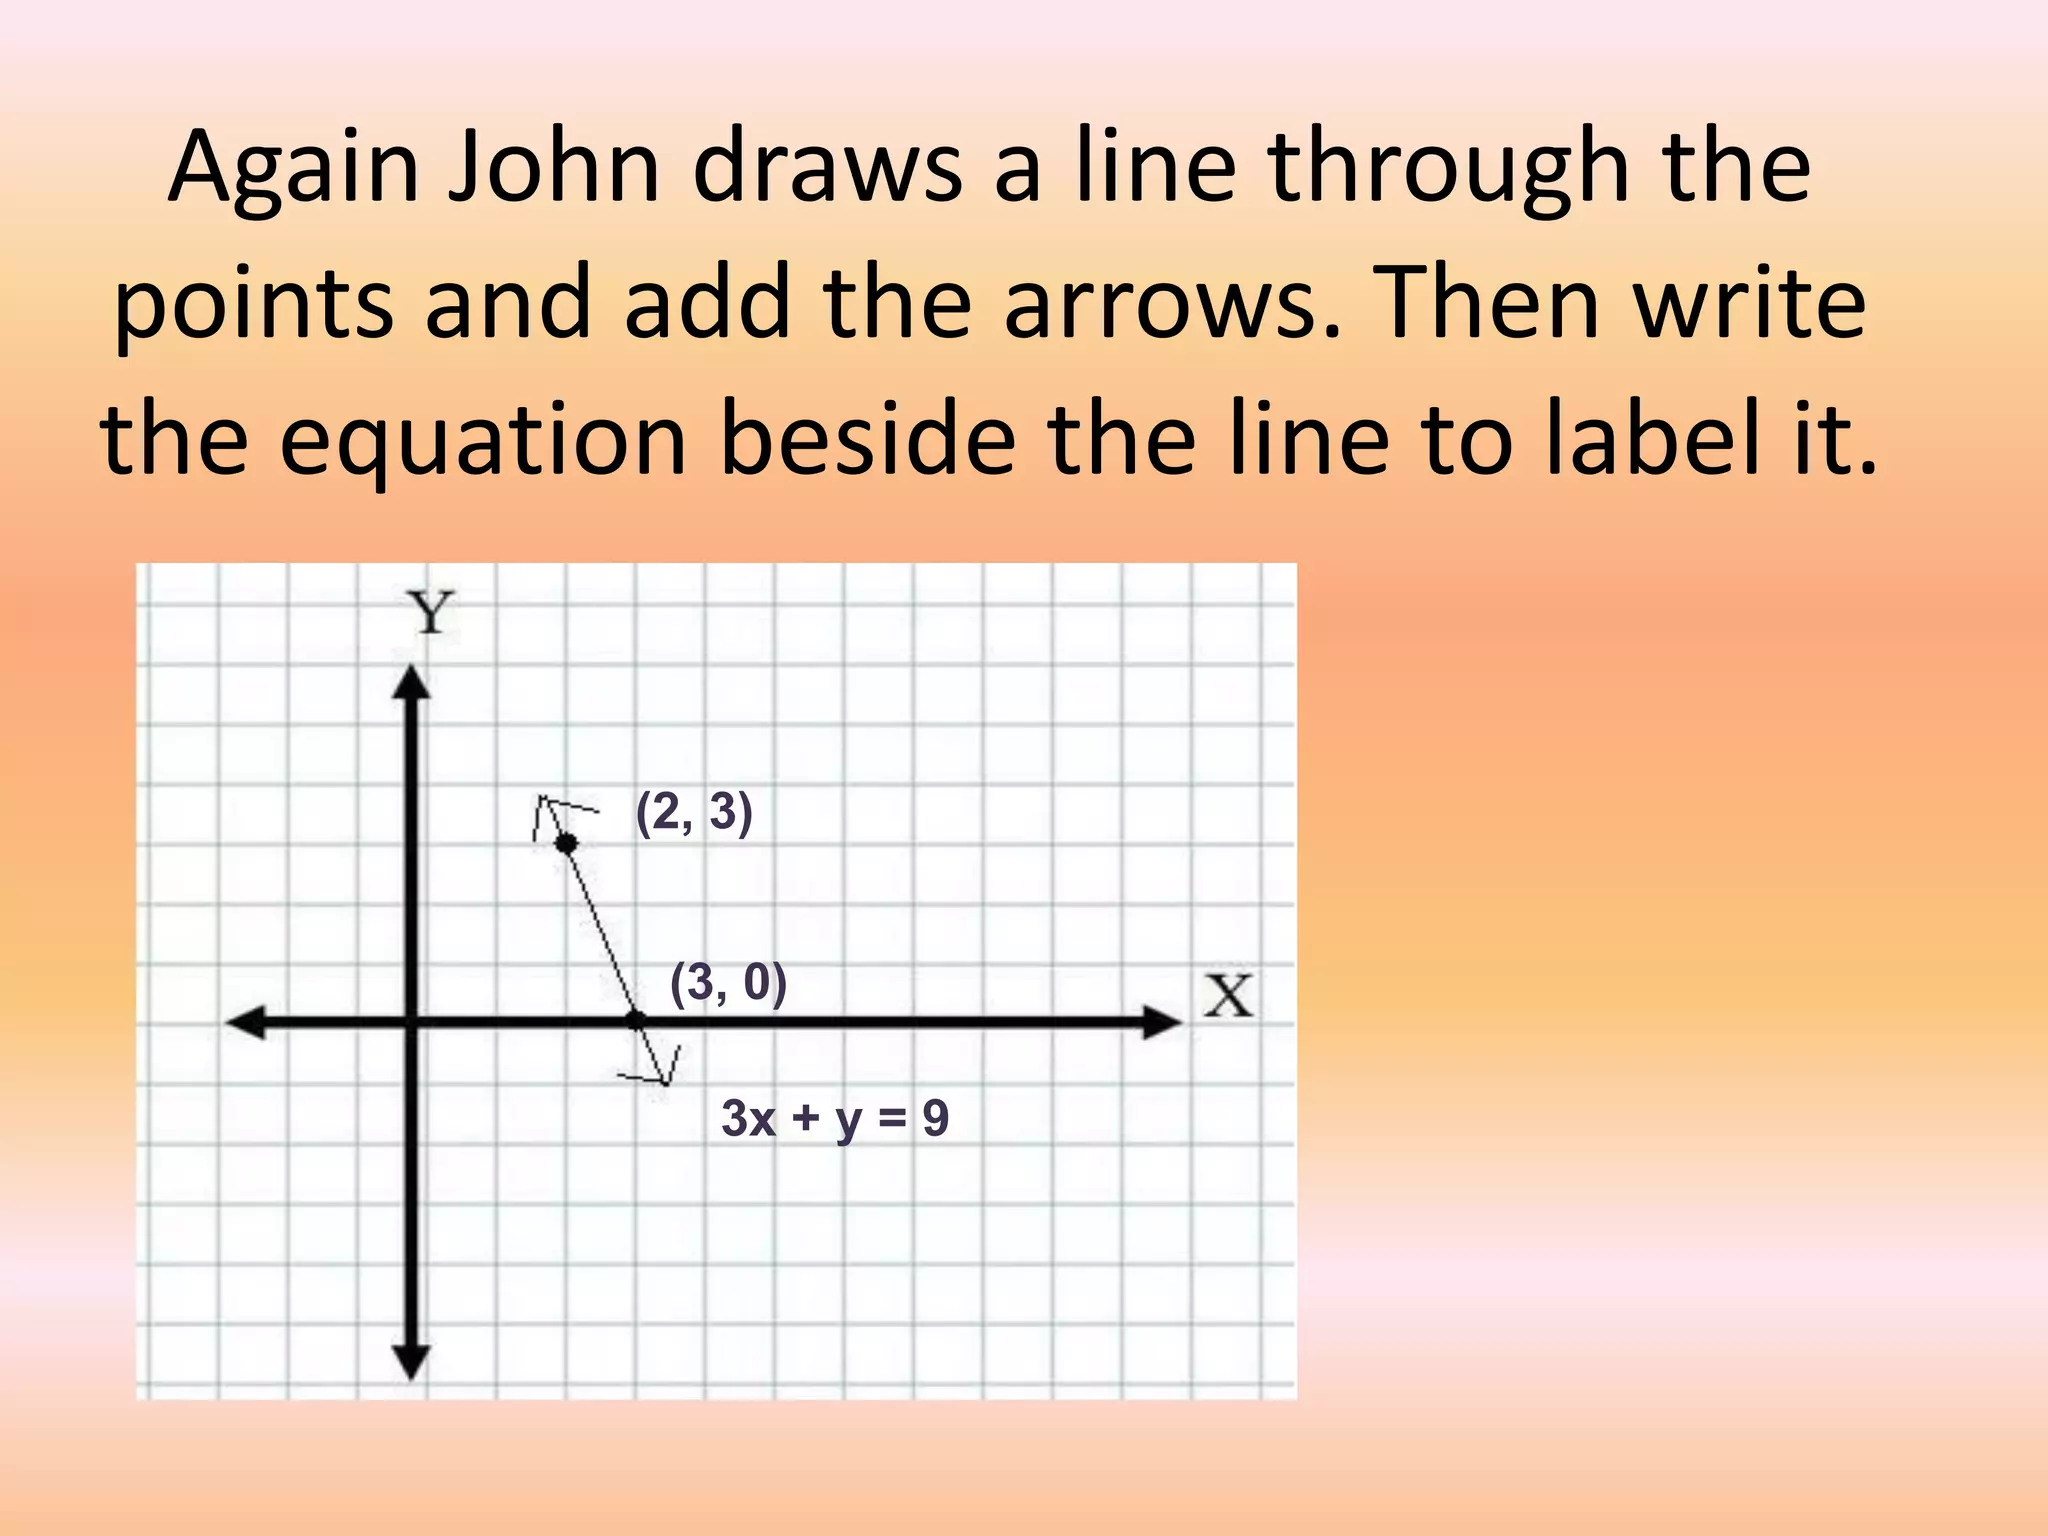
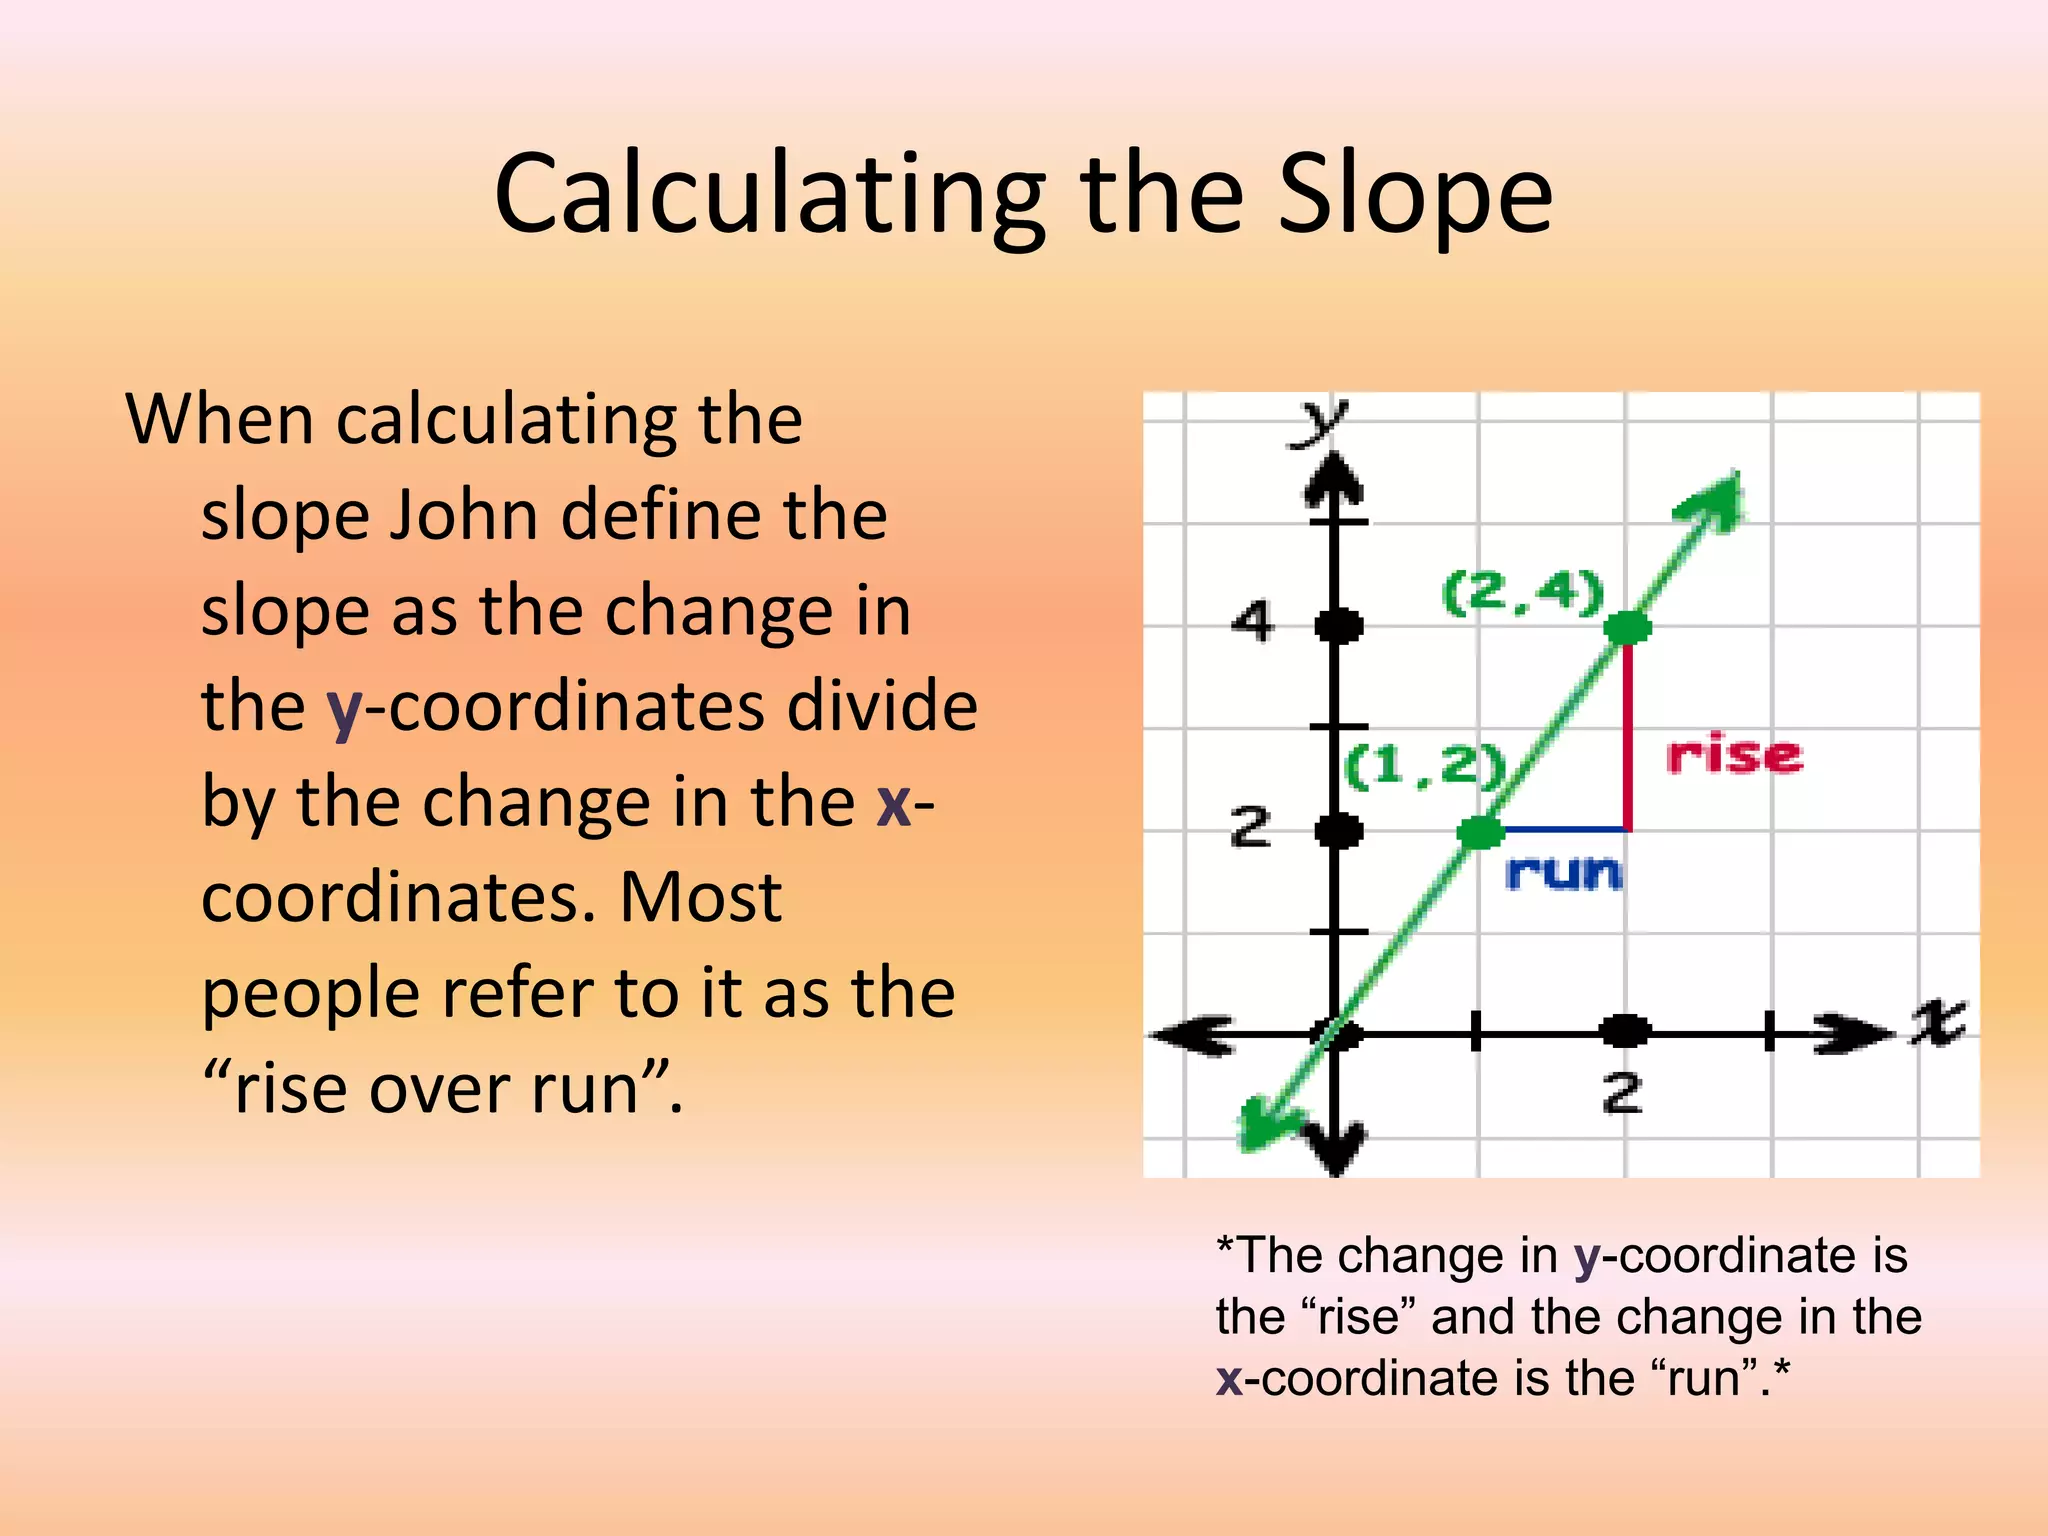
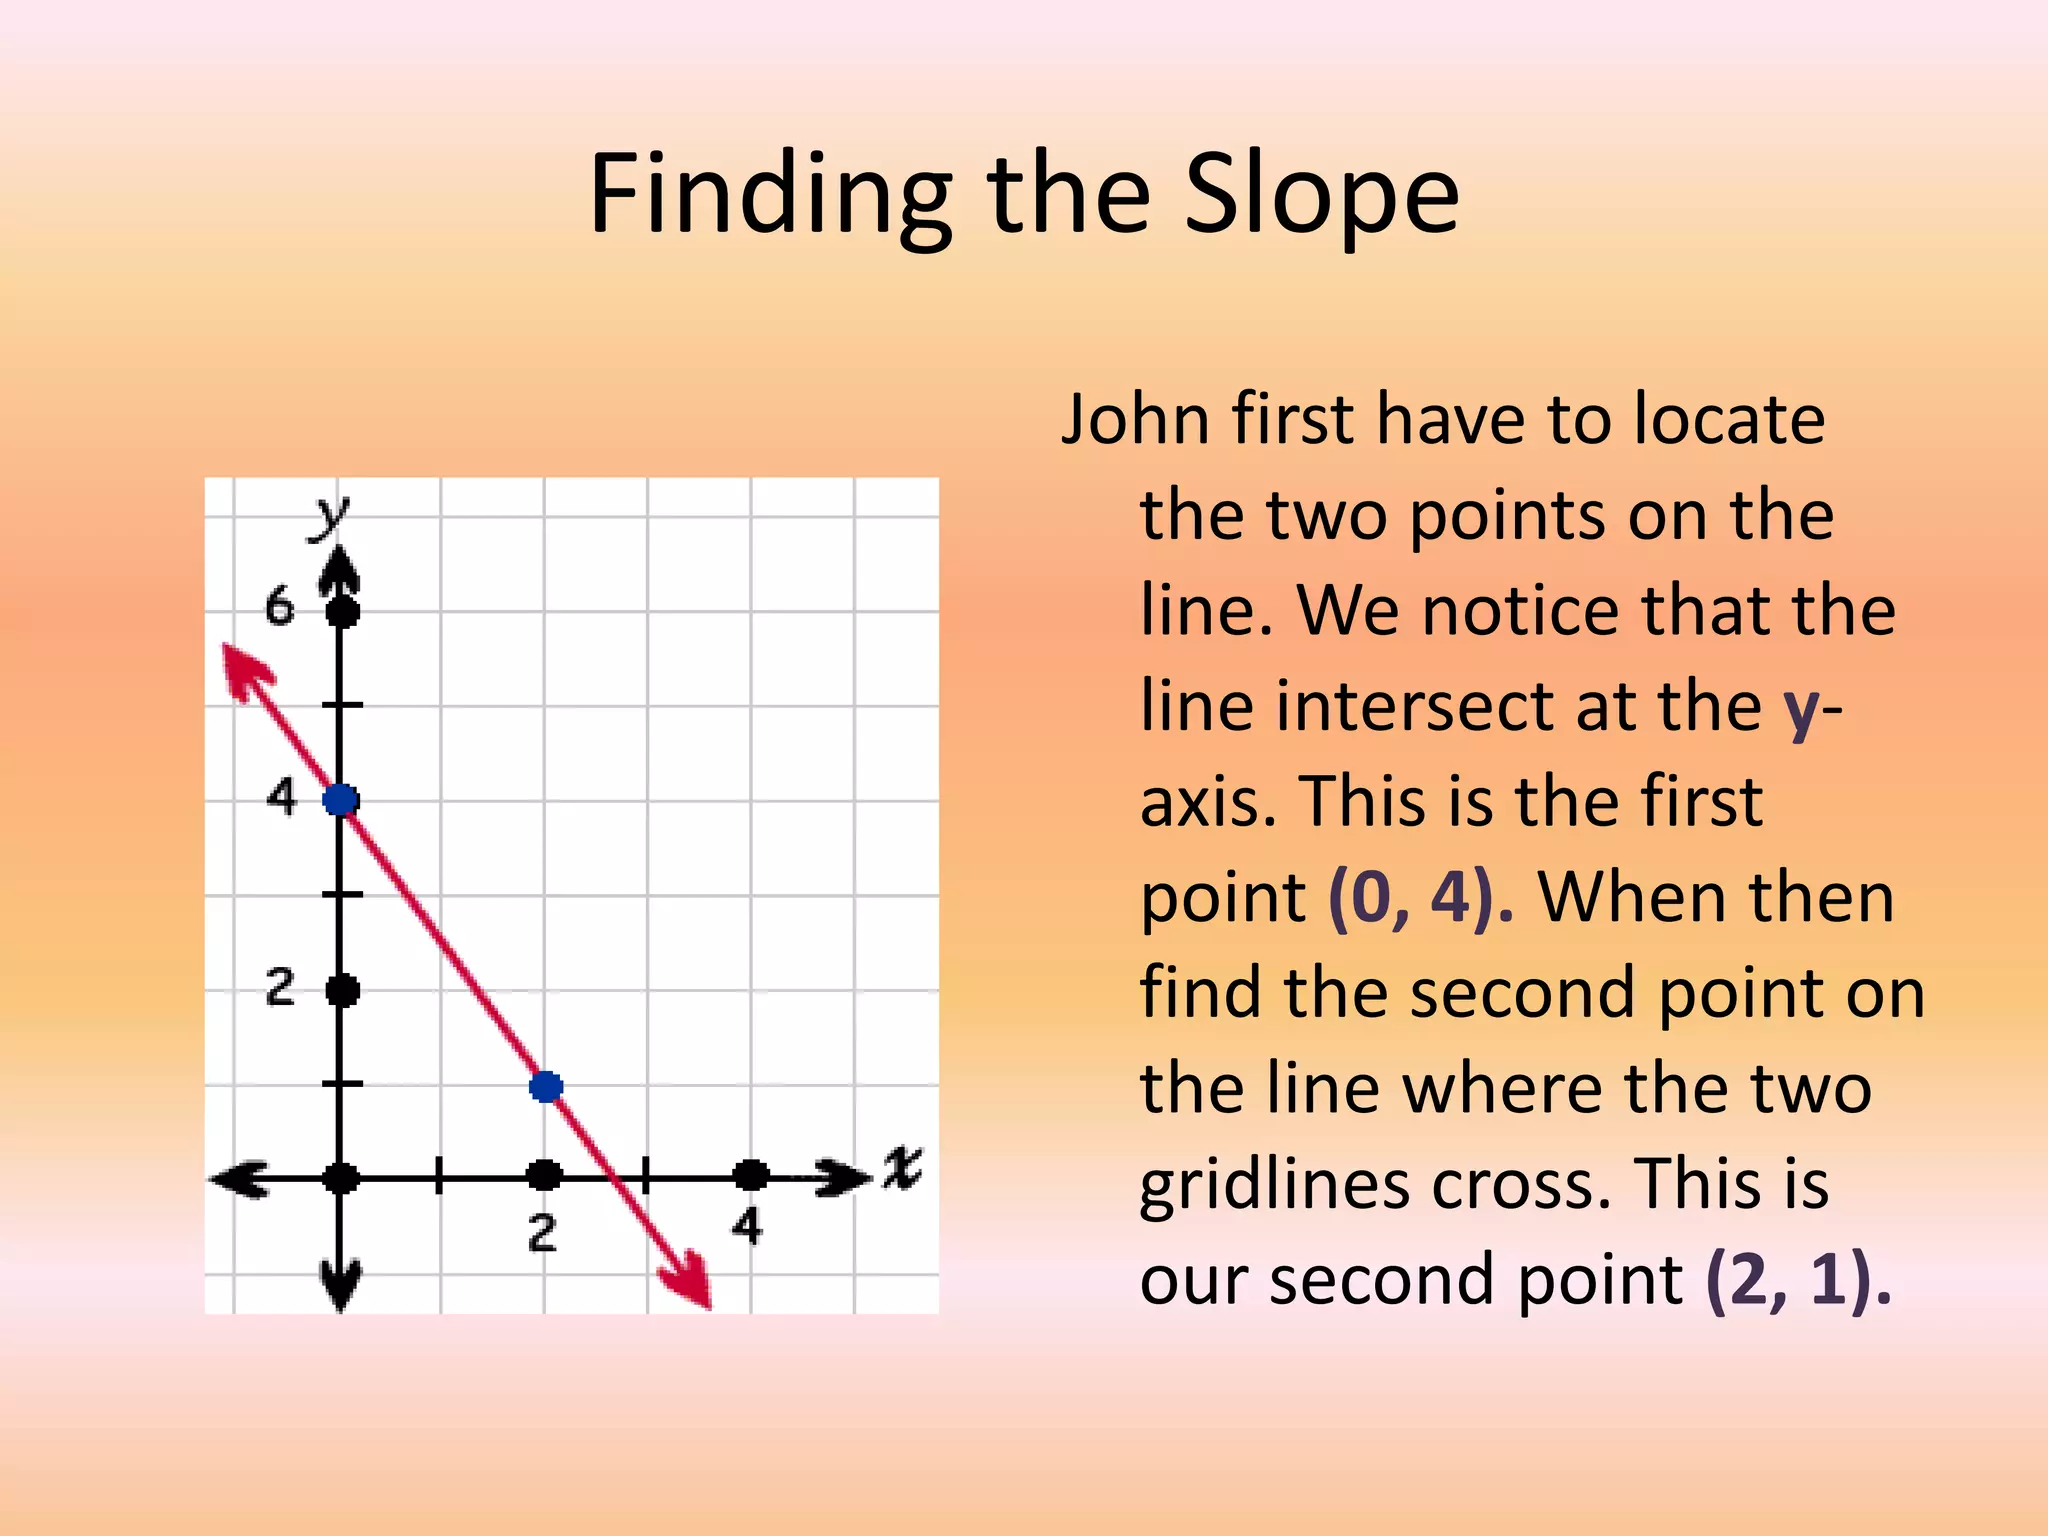
Lines and Slopes
                   Table of Contents
• Introduction
• Drawing a Line
  - Graphing Points First
• Slope
  - Calculating Slope
  - Finding Those Slopes
Introduction
John and his friend wants to catch flies with
 their tongues. Their tongues are going to go
straight just how a line would. John begins to
 use his knowledge about lines to catch flies.
Drawing a Line
When you are able to know two points on a line
 then you are able to find the rest of the line.
 John is going to draw a line through these
 points.
John shifts his tongue to reach the two points
  and go right through them.
John begins to draw arrows to show that the line
  goes on forever.


    *make sure you use a ruler or something with a straight edge to ensure
    that your line is straight.*
Graphing Points First
When graphing a line you must use an equation.
  Take for example when graphing the line:
3x + y = 9 John would have to find the values x
  and y to make the equation true.
He choices to have x value equal 2. Once John has
 the value x, he has to find y by substituting the
 value x=2 into the equation.

                   3x + y = 9
                   3(2) + y = 9
                    6+y=9
                    -6 =-6
                      Y=3
John realize that when x = 2, y = 3
which makes the equation true. Now
     he graphs the point ( 2, 3)


              (2, 3)
John needs one more point before graphing the
  line. So he has to find another value for x and
  y. He makes y = 0. He substitutes the value of
  y = 0 into the original equation.
(Shown below)
                     3x + y = 9
                     3x + 0 = 9
                       3x = 9
                      3      3
                        X=3
Here John found that when y=0, x=3
that makes the equation true. Now
   graph the second point (3,0)


              (2, 3)

                 (3, 0)
Again John draws a line through the
points and add the arrows. Then write
the equation beside the line to label it.


            (2, 3)


             (3, 0)

                3x + y = 9
To be sure John understands how to graph a
      line. He graphs another equation:
                   y = 2x - 4
Again he has to find
two points to graph         Y = 2x – 4
the equation. He has
to find the values for x   Y = 2(0) – 4
and y to make sure          Y=0–4
the equation is true.
For the first point he        Y = -4
substitutes 0 for the
variable x.
When John value x = 0 then y = -4. He
  can now graph the point (0, -4).


           (0, -4)
For the second
point he substitutes
1 for the variable x.

       Y= 2x – 4
      Y = 2(1) – 4
       Y=2–4
                                 Y = 2x - 4       (1, -2)
         Y = -2
                                              (0, -4)


 John value x = 1 then y = -2.                     He draws the line through the
 Now he can graph the second                       points and add the arrows. He
 point (1, -2).                                    then labels the line with the
                                                   equation.
Slope
   When using slope we use it to measure a line’s
                     slant.
 Here is a picture with three
 different types of slopes.
                                 There can even
                                 be a negative
                                 slope line and
                                 that’s when the
                                 lines point down
                                 instead of up.
                                 Ex. Shown to
                                 the right


The green line has the biggest slope and
  the red line has the smallest slope out of
  the three slopes.
Calculating the Slope
When calculating the
 slope John define the
 slope as the change in
 the y-coordinates divide
 by the change in the x-
 coordinates. Most
 people refer to it as the
 “rise over run”.

                             *The change in y-coordinate is
                             the “rise” and the change in the
                             x-coordinate is the “run”.*
Slope Formula
Change in x-coordinate         When identifying our
  and change in my y-           points, our first point
  coordinate is put in a        (x1, y1) and the second
  formula using the Greek       point (x2, y2). John
  letter delta ∆. This is an    substitute these points
  abbreviation for              in for the delta ∆.
  change.                                 Y2 –Y1
            ∆Y                    M= X2 – Y1
      M= ∆ X
Finding the Slope
         John first have to locate
           the two points on the
           line. We notice that the
           line intersect at the y-
           axis. This is the first
           point (0, 4). When then
           find the second point on
           the line where the two
           gridlines cross. This is
           our second point (2, 1).
Now that we have our points John
plugs it into the slope equation to find
the slope.

M = (y2 – y1)/ (x2 – x1)
M = (1 – 4) / (2 – 0)
M = -3 / 2

The slope is negative.
Overall
John has taught us how to draw a line by
  graphing the points and calculating the slope.
  Know he and his friends can catch their flies.
Cited
This is the site where I found my lesson plan and
  some of my graphs.
• http://mathforum.org/cgraph/cslope/drawlin
  e.html
This is the site where I found some of my
  graphs.
• http://nghsapphysicsb.blogspot.com/2009/10
  /super-explanation-of-how-rolling.html

Lines and Slopes

  • 2.
    Lines and Slopes Table of Contents • Introduction • Drawing a Line - Graphing Points First • Slope - Calculating Slope - Finding Those Slopes
  • 3.
    Introduction John and hisfriend wants to catch flies with their tongues. Their tongues are going to go straight just how a line would. John begins to use his knowledge about lines to catch flies.
  • 4.
    Drawing a Line Whenyou are able to know two points on a line then you are able to find the rest of the line. John is going to draw a line through these points.
  • 5.
    John shifts histongue to reach the two points and go right through them.
  • 6.
    John begins todraw arrows to show that the line goes on forever. *make sure you use a ruler or something with a straight edge to ensure that your line is straight.*
  • 7.
    Graphing Points First Whengraphing a line you must use an equation. Take for example when graphing the line: 3x + y = 9 John would have to find the values x and y to make the equation true.
  • 8.
    He choices tohave x value equal 2. Once John has the value x, he has to find y by substituting the value x=2 into the equation. 3x + y = 9 3(2) + y = 9 6+y=9 -6 =-6 Y=3
  • 9.
    John realize thatwhen x = 2, y = 3 which makes the equation true. Now he graphs the point ( 2, 3) (2, 3)
  • 10.
    John needs onemore point before graphing the line. So he has to find another value for x and y. He makes y = 0. He substitutes the value of y = 0 into the original equation. (Shown below) 3x + y = 9 3x + 0 = 9 3x = 9 3 3 X=3
  • 11.
    Here John foundthat when y=0, x=3 that makes the equation true. Now graph the second point (3,0) (2, 3) (3, 0)
  • 12.
    Again John drawsa line through the points and add the arrows. Then write the equation beside the line to label it. (2, 3) (3, 0) 3x + y = 9
  • 13.
    To be sureJohn understands how to graph a line. He graphs another equation: y = 2x - 4 Again he has to find two points to graph Y = 2x – 4 the equation. He has to find the values for x Y = 2(0) – 4 and y to make sure Y=0–4 the equation is true. For the first point he Y = -4 substitutes 0 for the variable x.
  • 14.
    When John valuex = 0 then y = -4. He can now graph the point (0, -4). (0, -4)
  • 15.
    For the second pointhe substitutes 1 for the variable x. Y= 2x – 4 Y = 2(1) – 4 Y=2–4 Y = 2x - 4 (1, -2) Y = -2 (0, -4) John value x = 1 then y = -2. He draws the line through the Now he can graph the second points and add the arrows. He point (1, -2). then labels the line with the equation.
  • 16.
    Slope When using slope we use it to measure a line’s slant. Here is a picture with three different types of slopes. There can even be a negative slope line and that’s when the lines point down instead of up. Ex. Shown to the right The green line has the biggest slope and the red line has the smallest slope out of the three slopes.
  • 17.
    Calculating the Slope Whencalculating the slope John define the slope as the change in the y-coordinates divide by the change in the x- coordinates. Most people refer to it as the “rise over run”. *The change in y-coordinate is the “rise” and the change in the x-coordinate is the “run”.*
  • 18.
    Slope Formula Change inx-coordinate When identifying our and change in my y- points, our first point coordinate is put in a (x1, y1) and the second formula using the Greek point (x2, y2). John letter delta ∆. This is an substitute these points abbreviation for in for the delta ∆. change. Y2 –Y1 ∆Y M= X2 – Y1 M= ∆ X
  • 19.
    Finding the Slope John first have to locate the two points on the line. We notice that the line intersect at the y- axis. This is the first point (0, 4). When then find the second point on the line where the two gridlines cross. This is our second point (2, 1).
  • 20.
    Now that wehave our points John plugs it into the slope equation to find the slope. M = (y2 – y1)/ (x2 – x1) M = (1 – 4) / (2 – 0) M = -3 / 2 The slope is negative.
  • 21.
    Overall John has taughtus how to draw a line by graphing the points and calculating the slope. Know he and his friends can catch their flies.
  • 22.
    Cited This is thesite where I found my lesson plan and some of my graphs. • http://mathforum.org/cgraph/cslope/drawlin e.html This is the site where I found some of my graphs. • http://nghsapphysicsb.blogspot.com/2009/10 /super-explanation-of-how-rolling.html