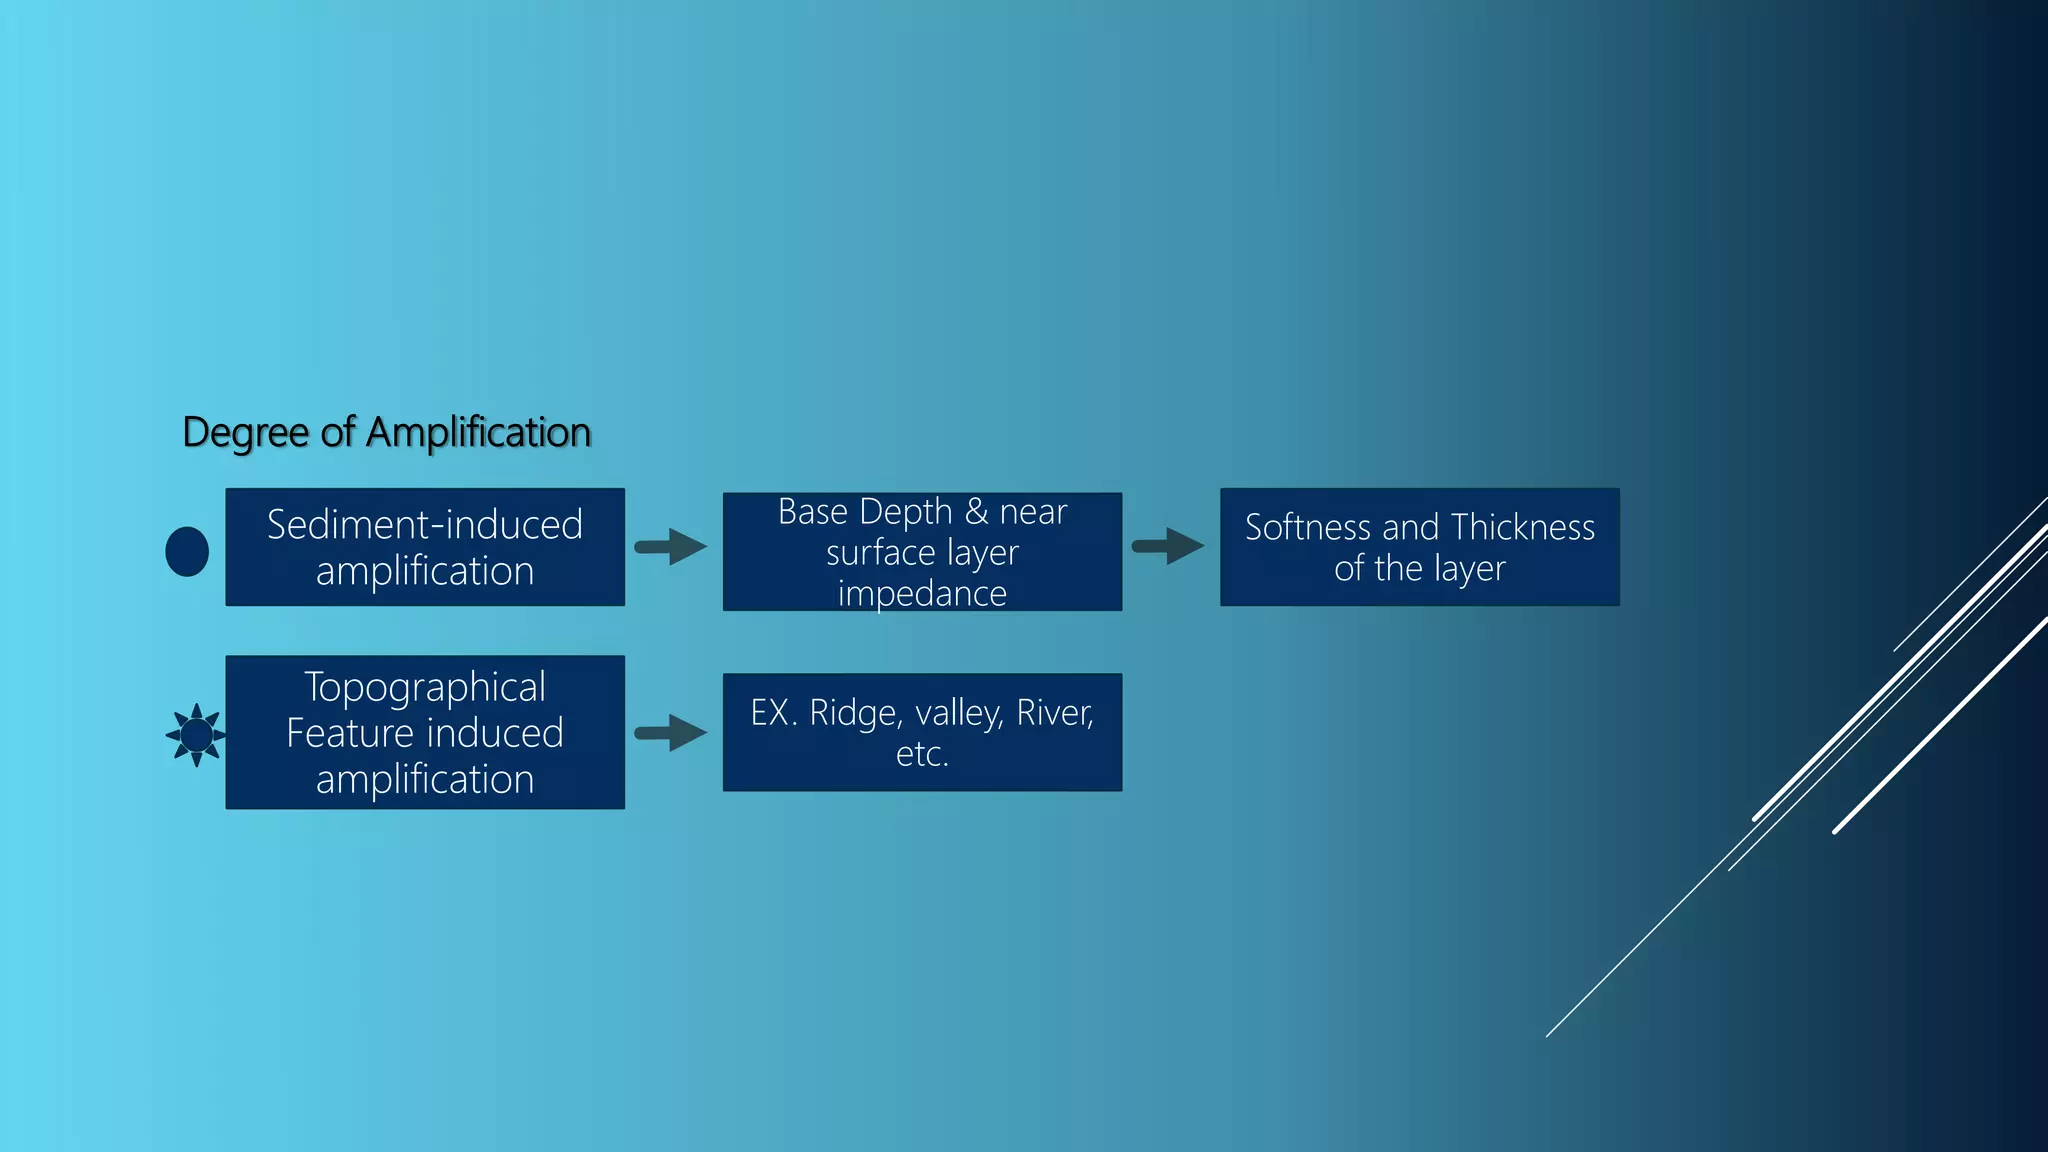
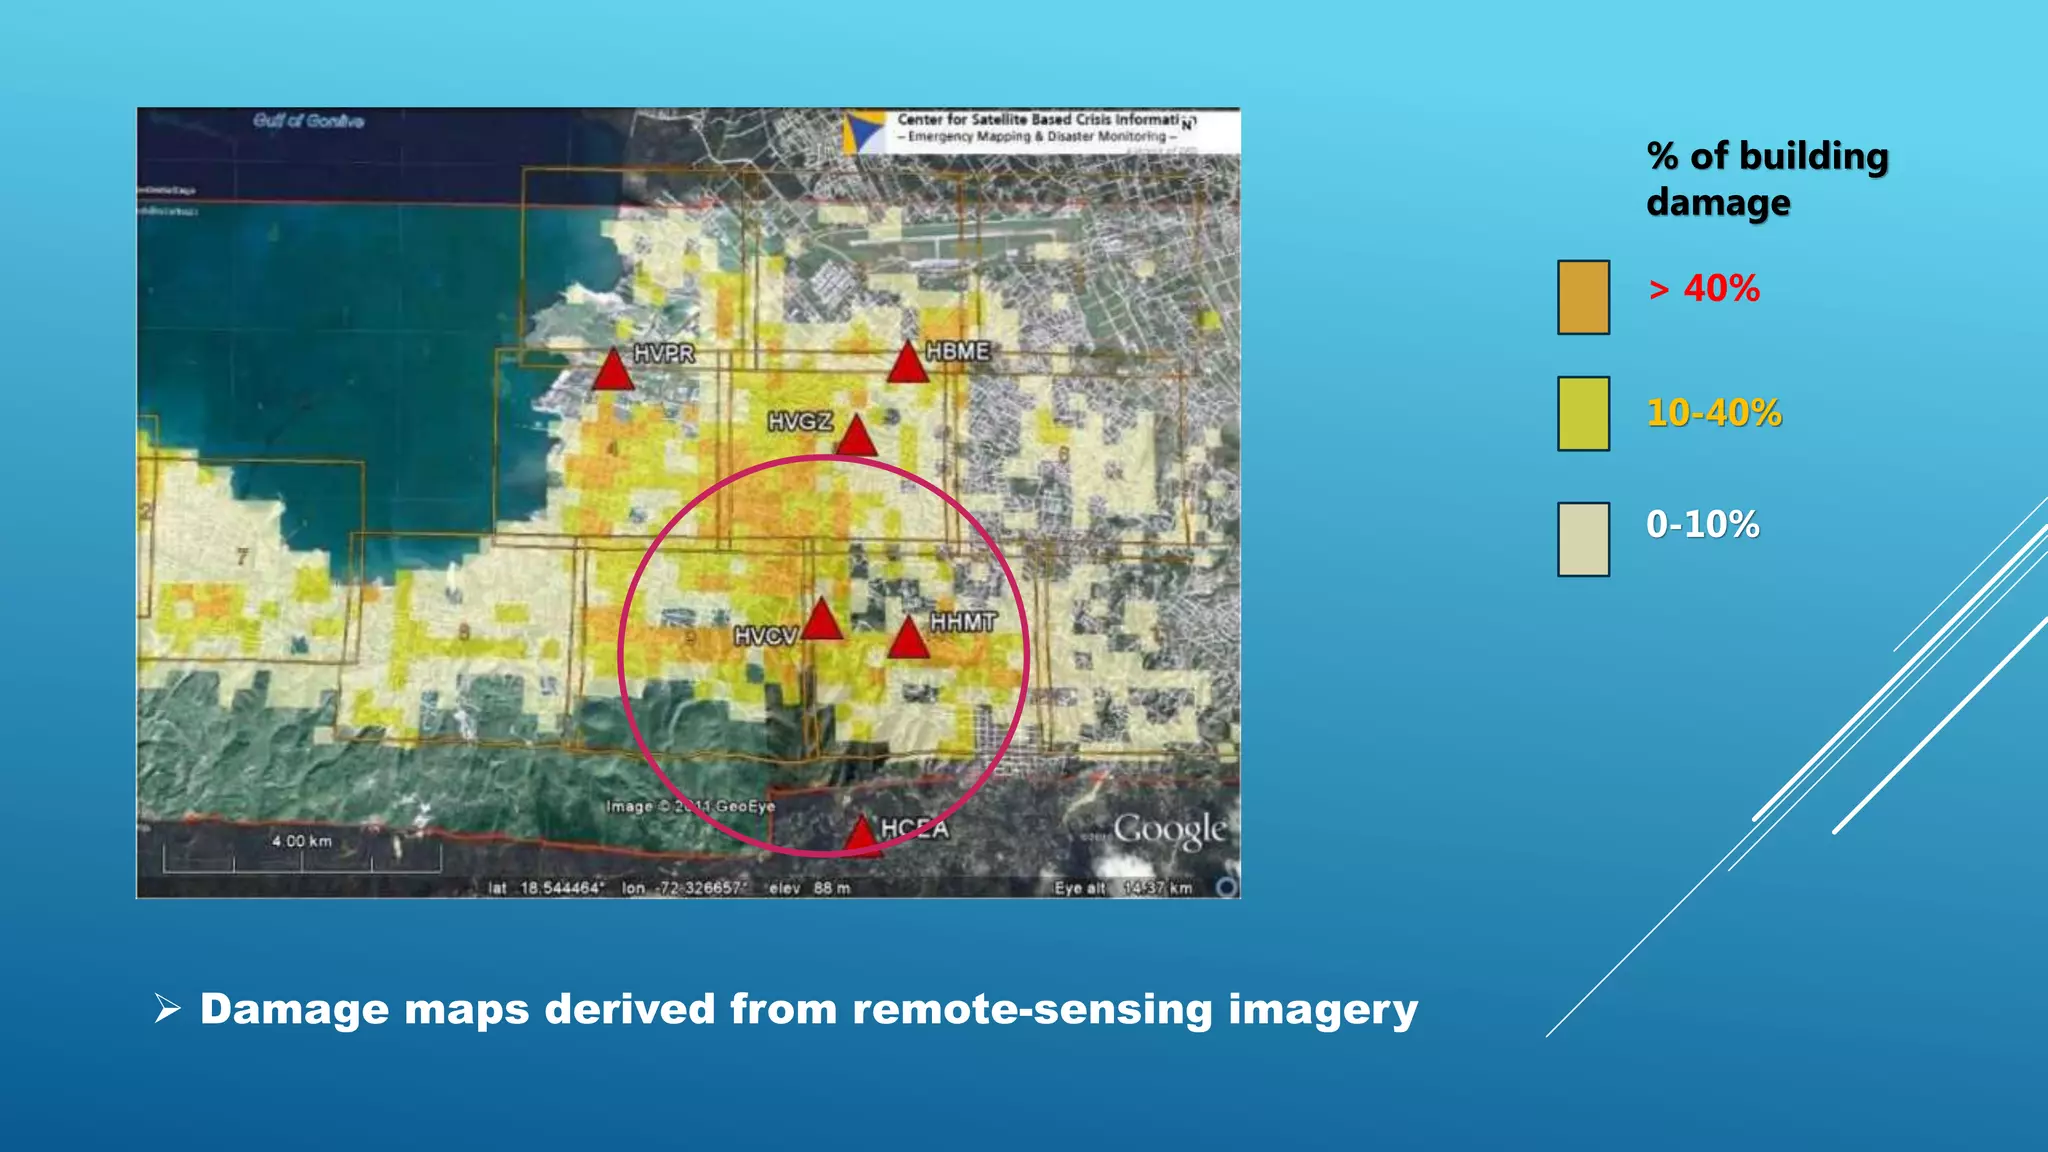
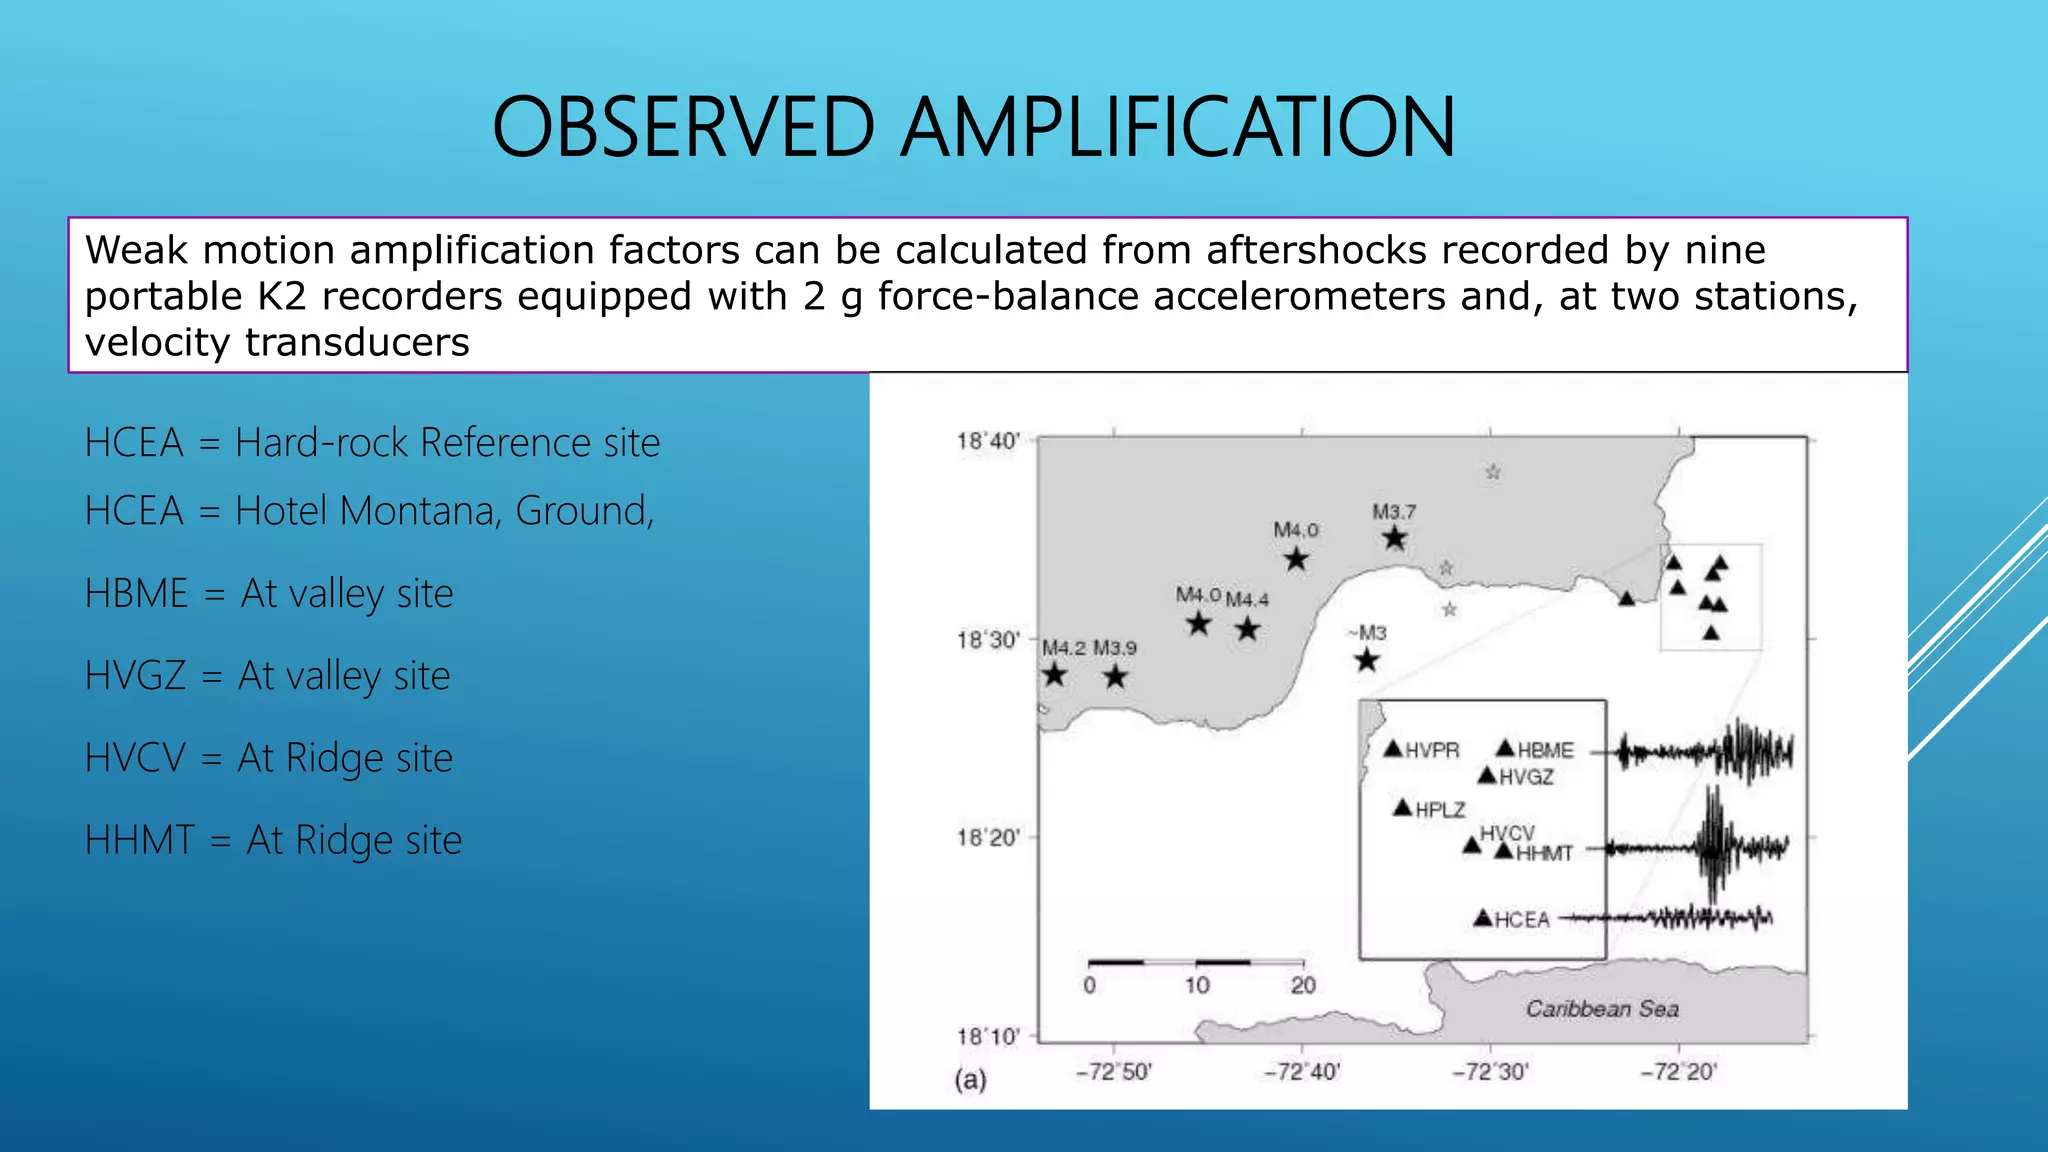
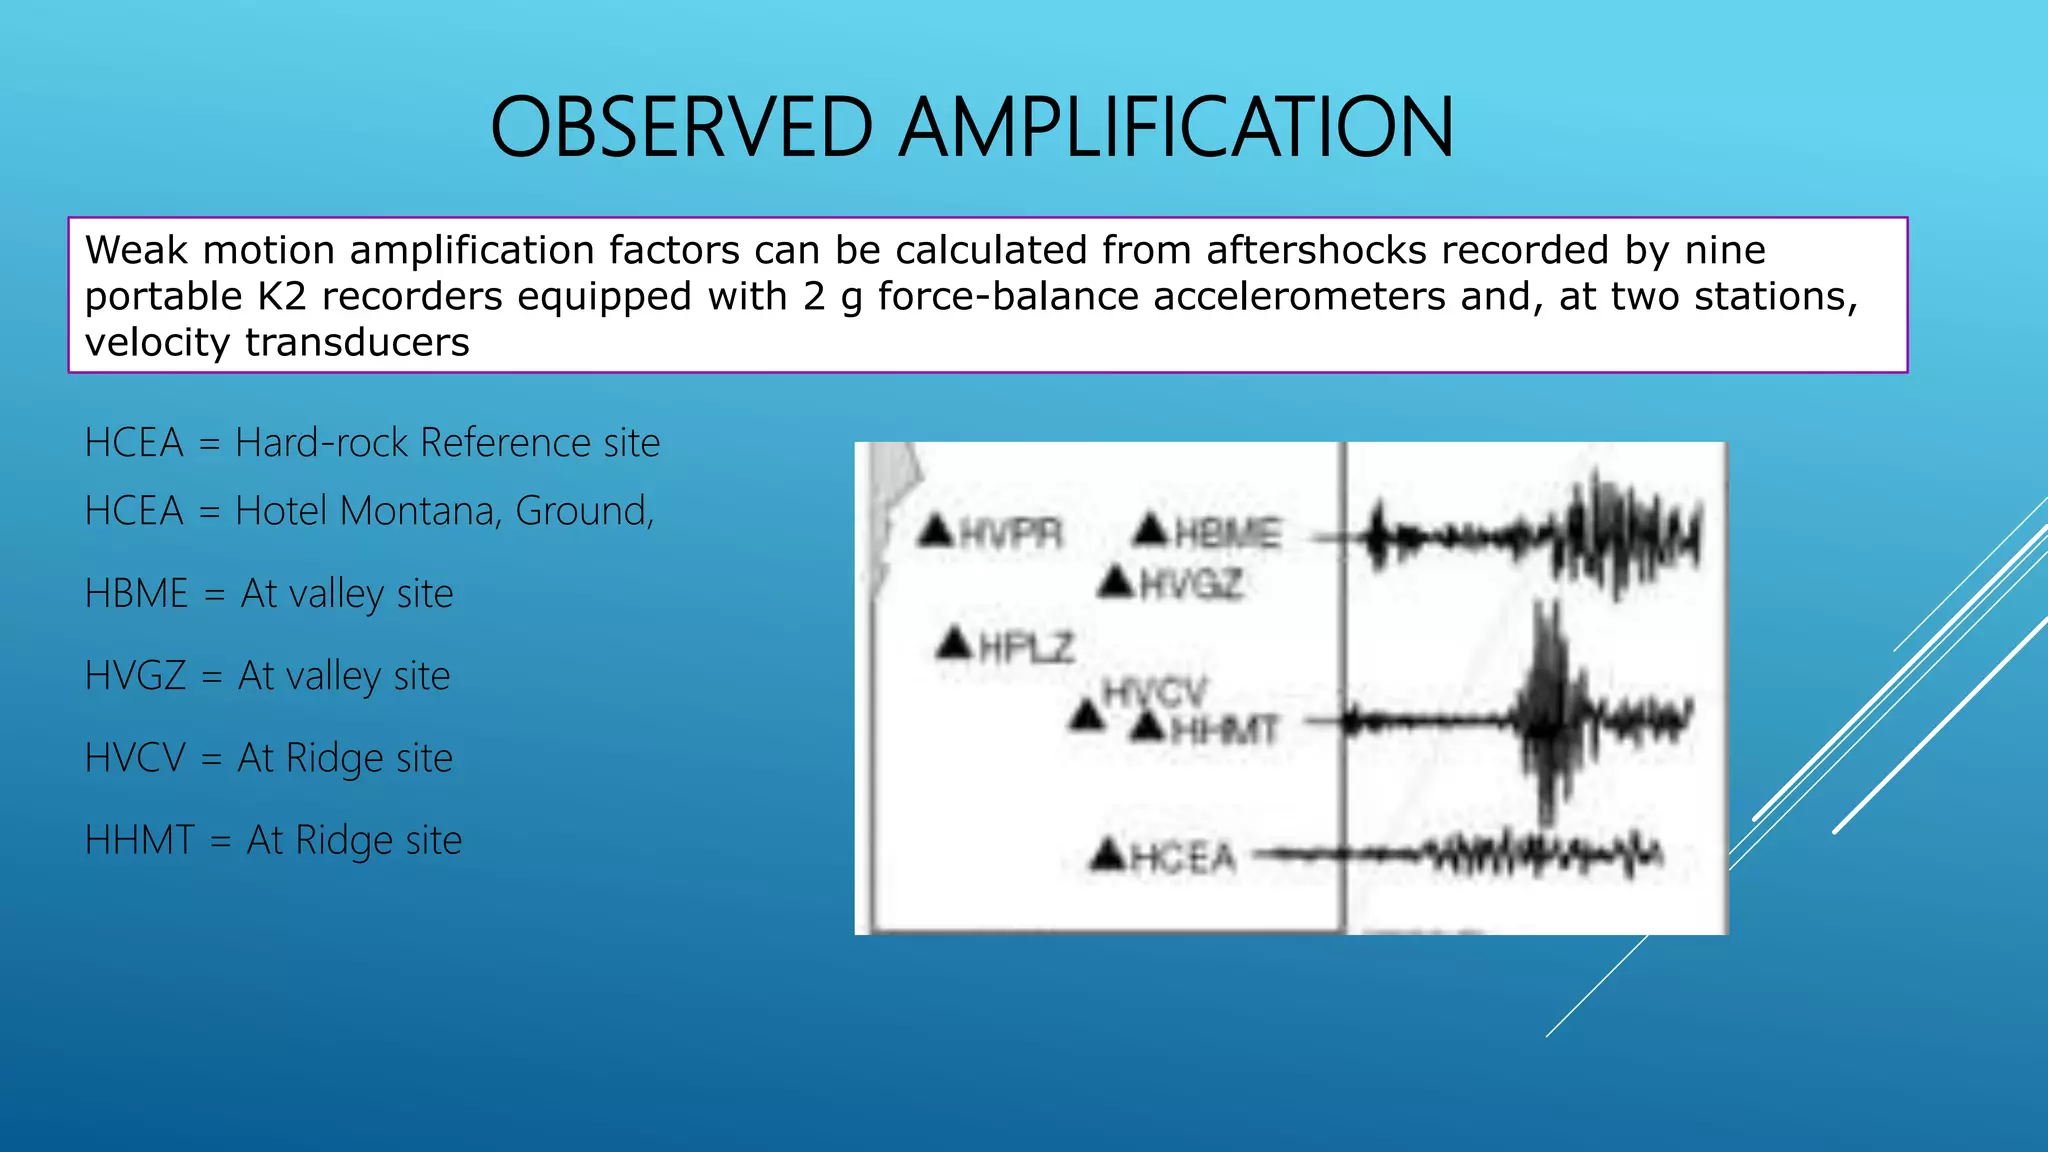
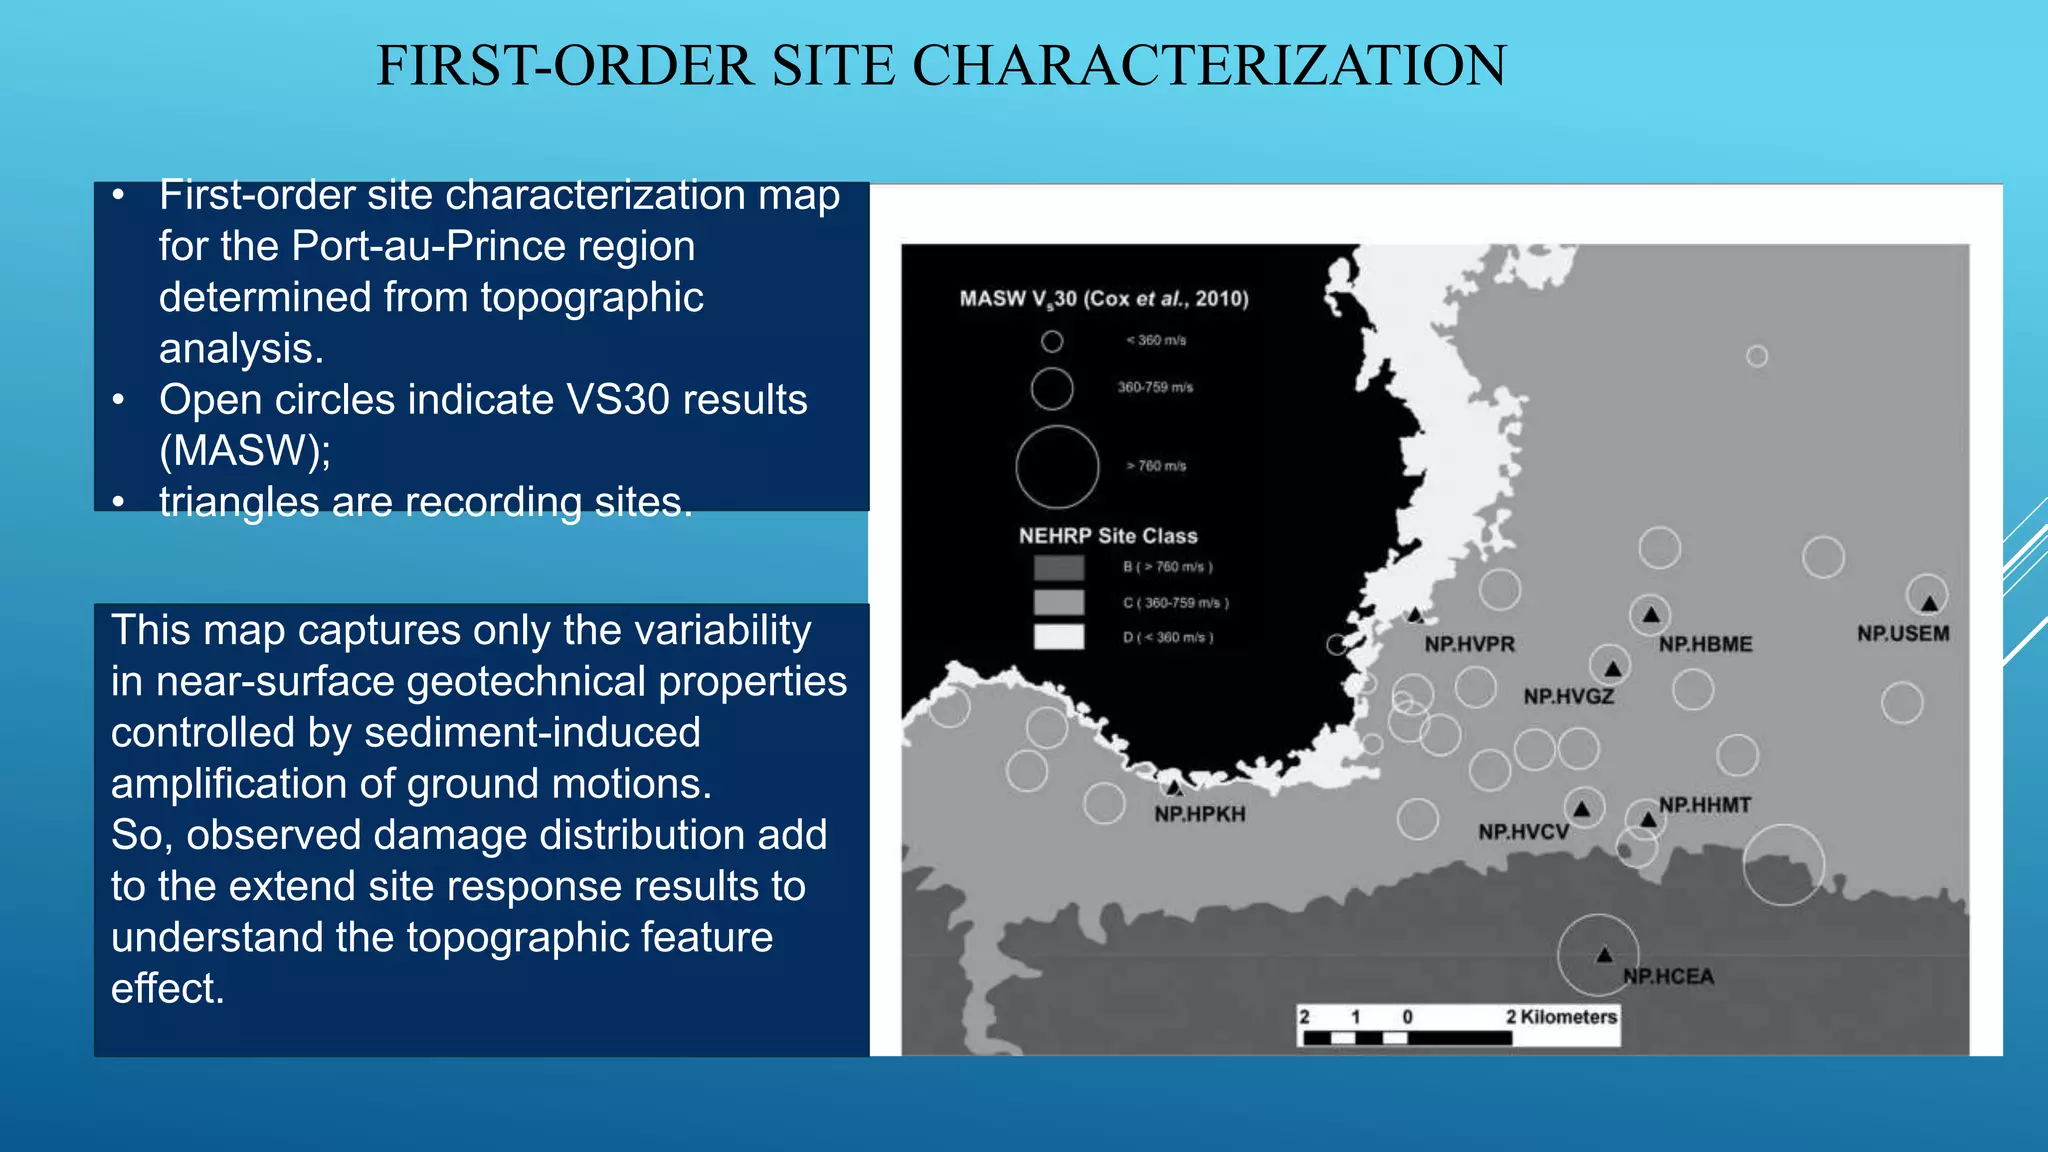
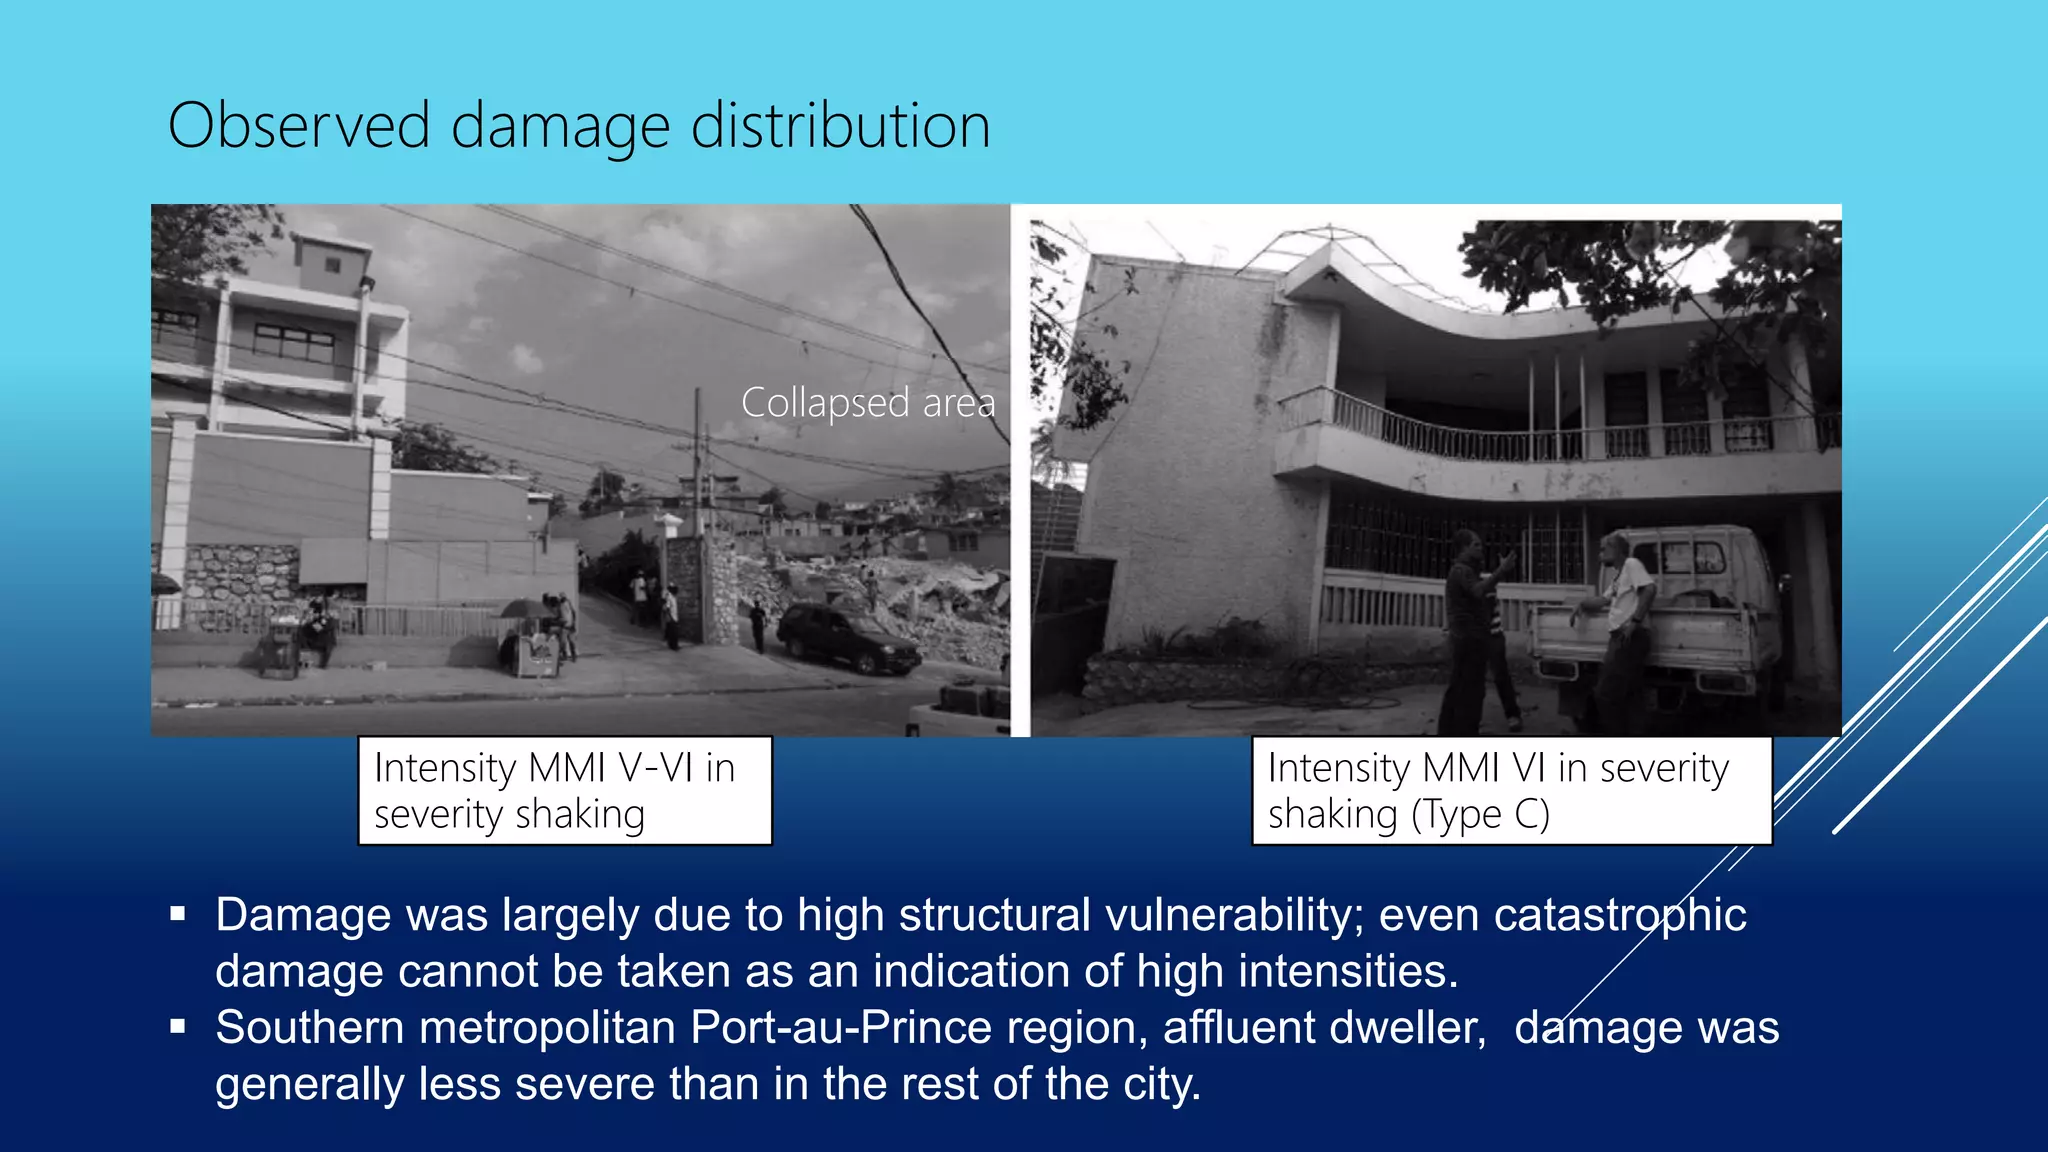
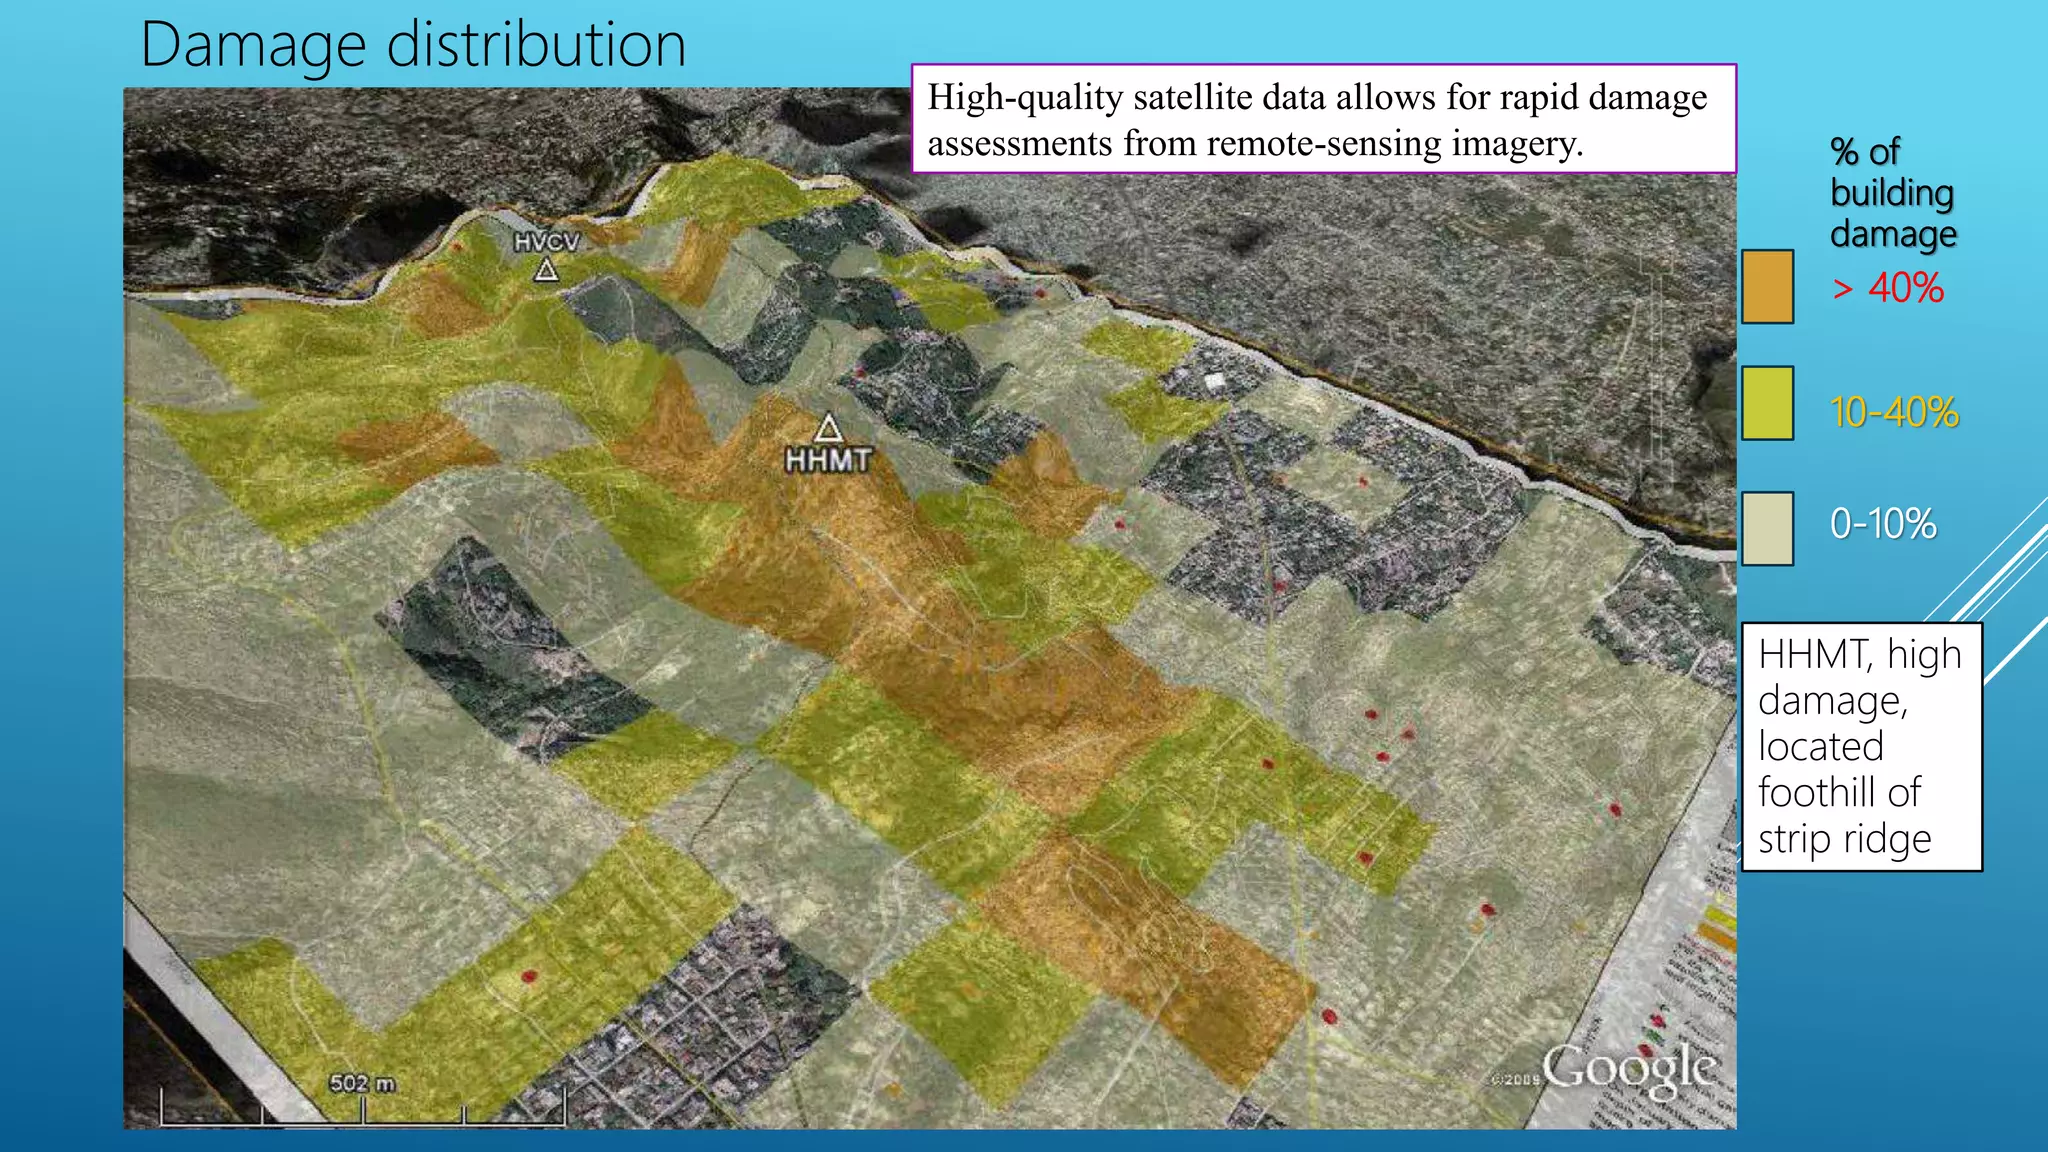
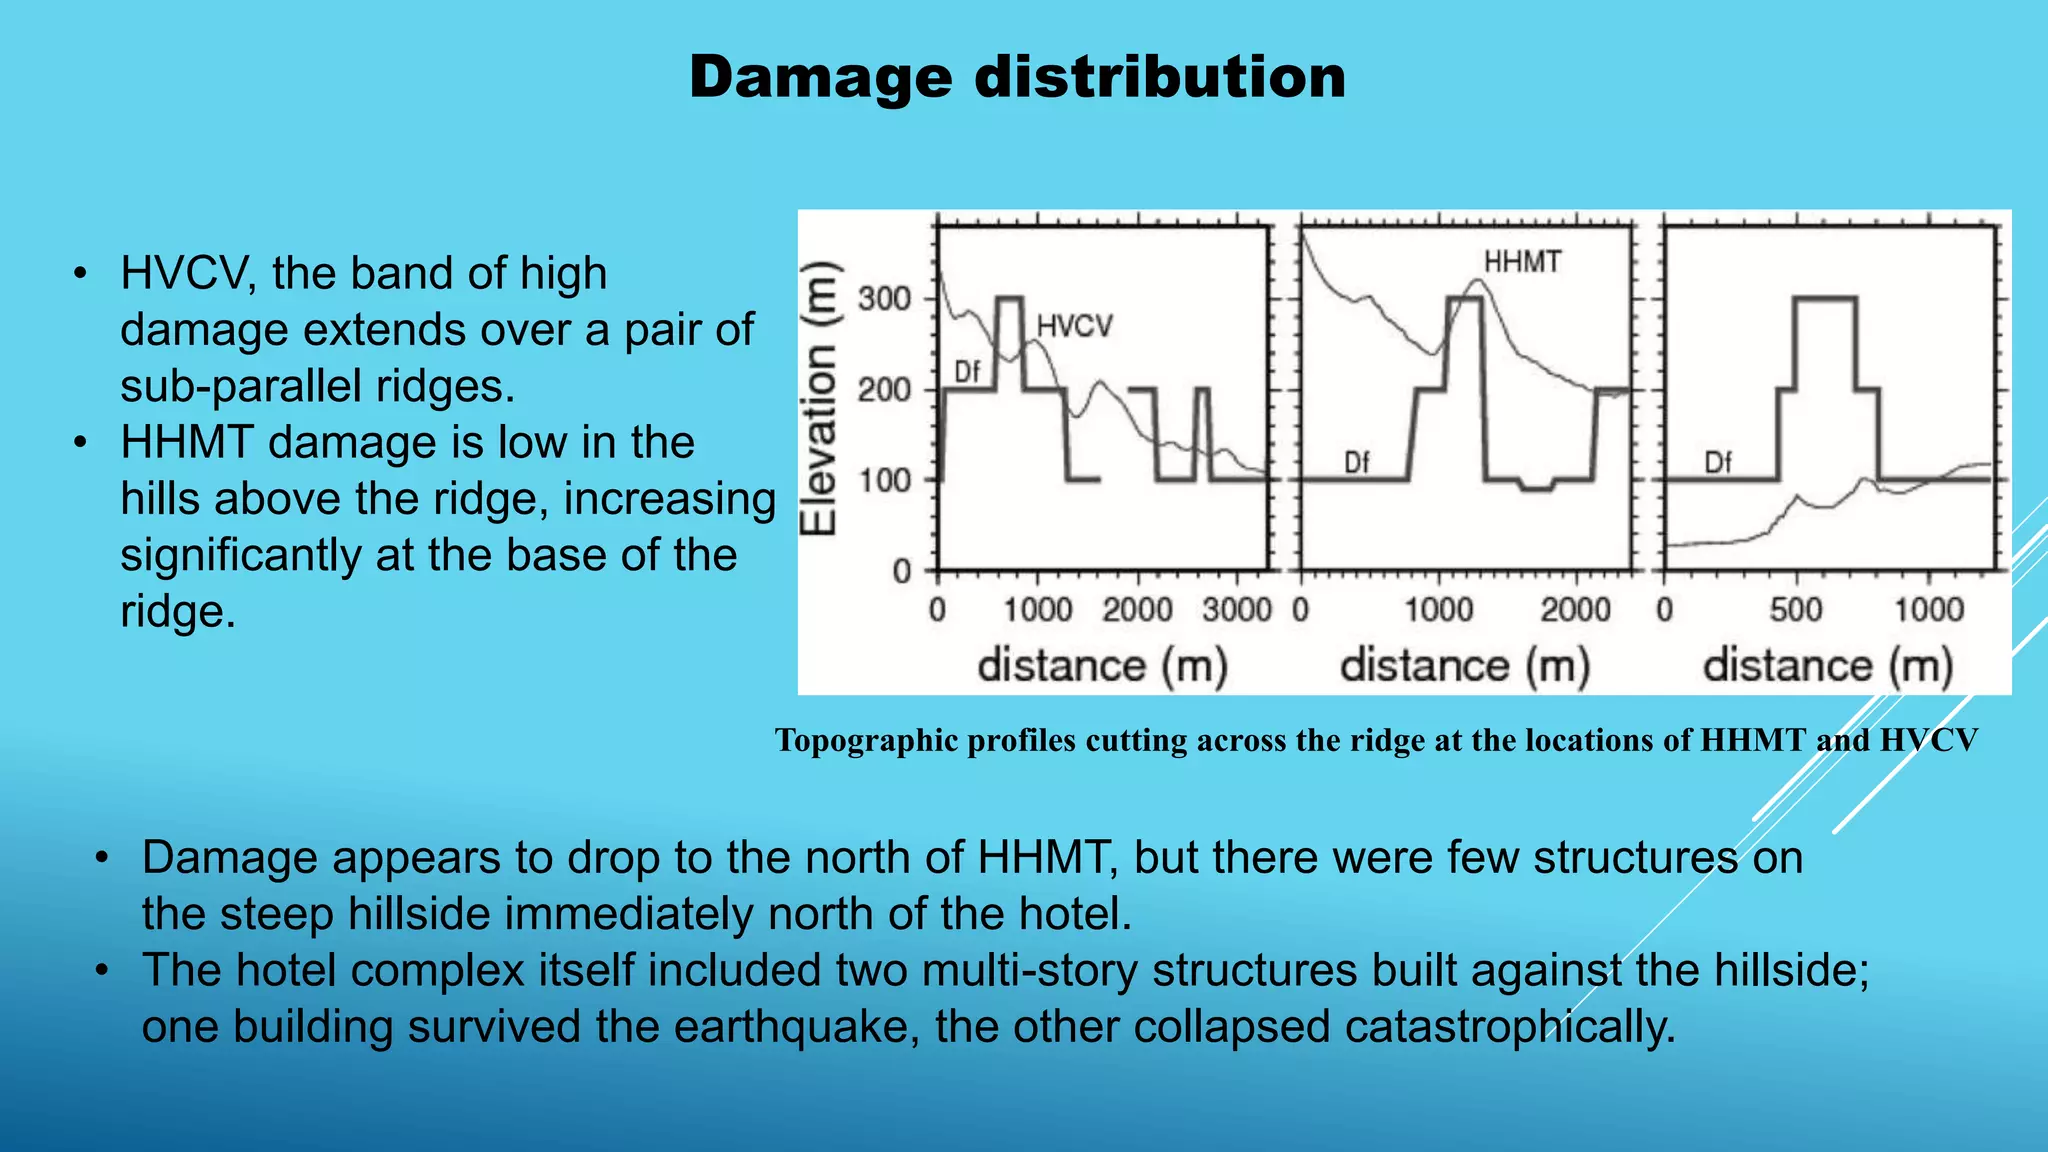
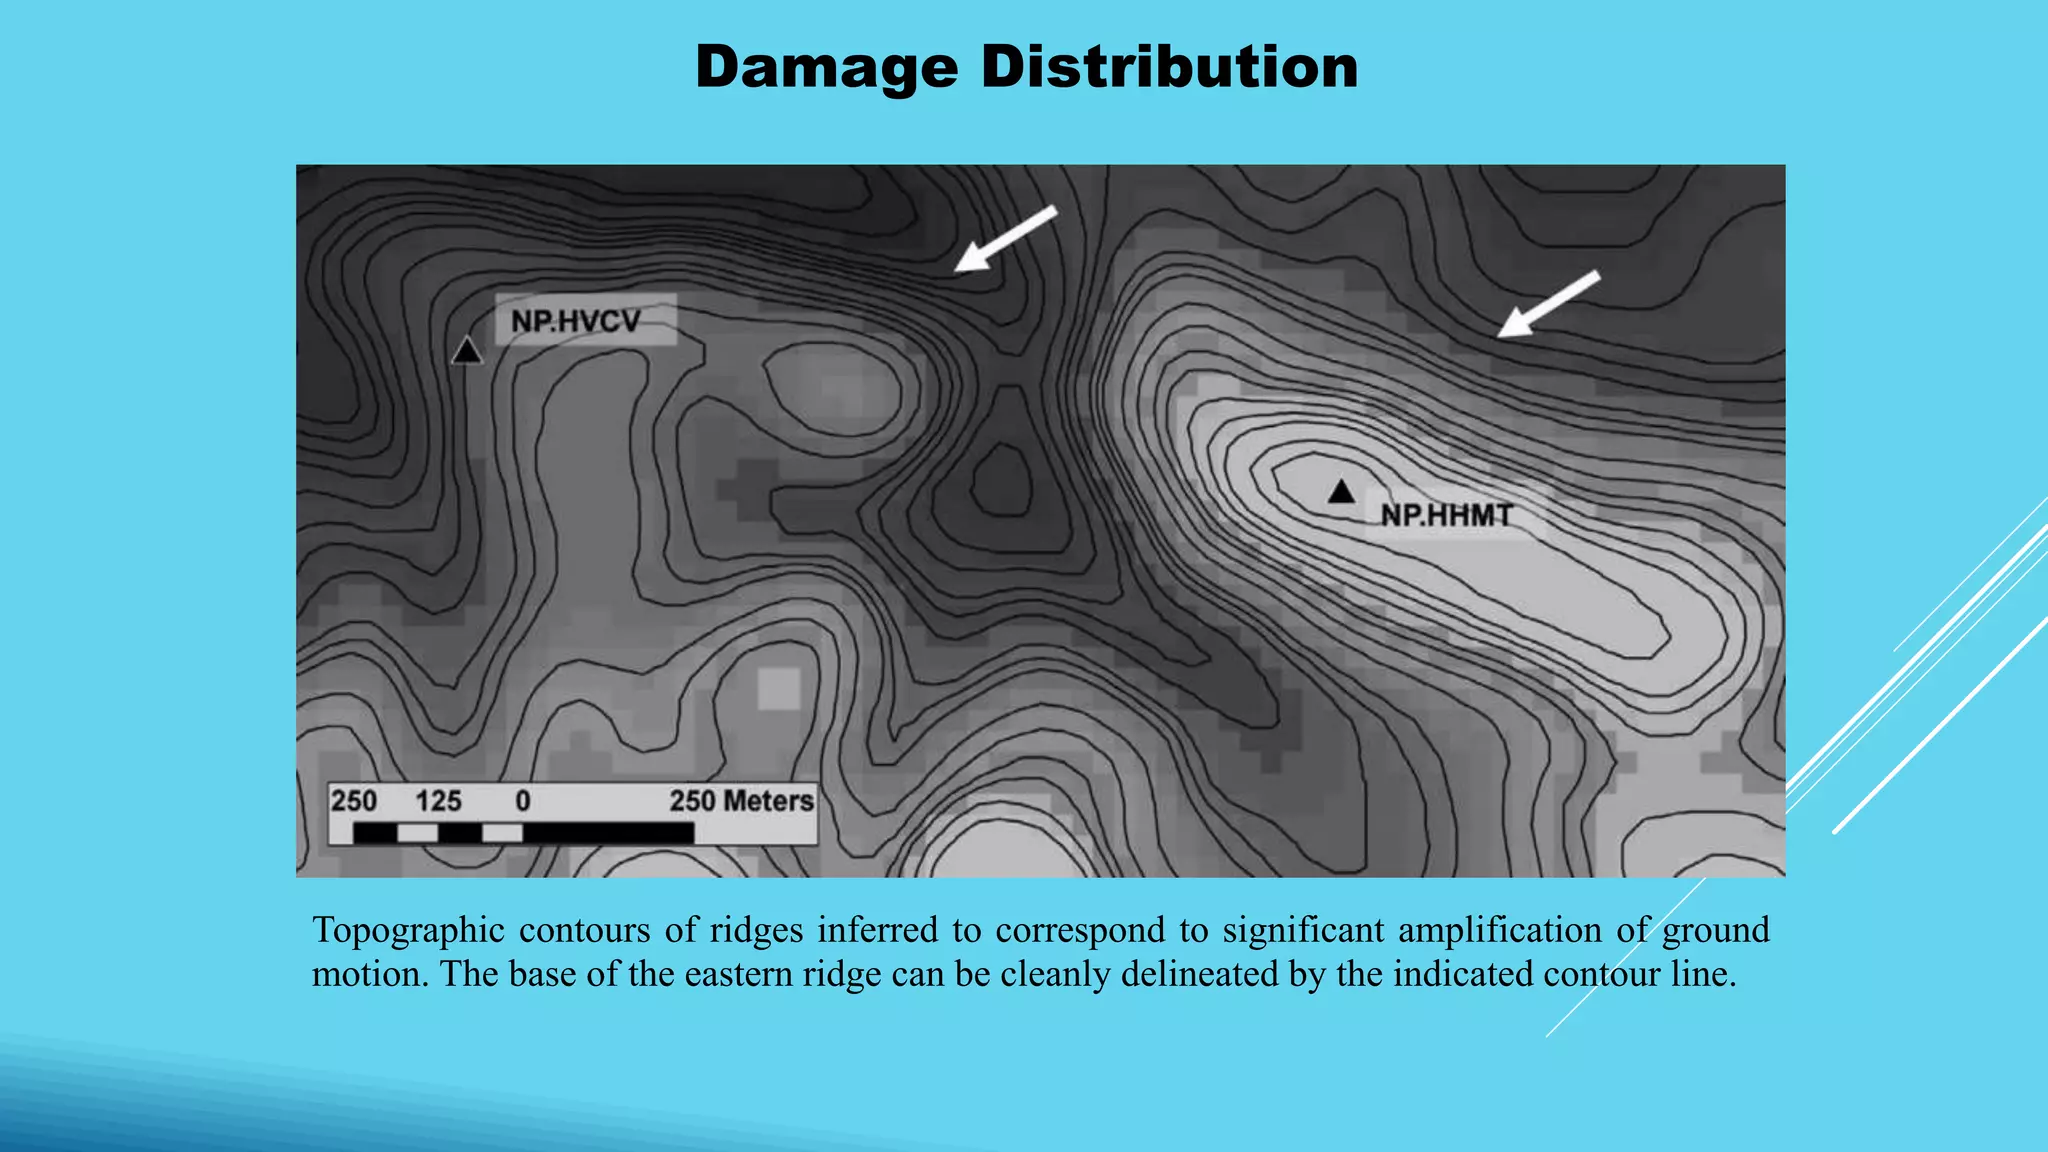
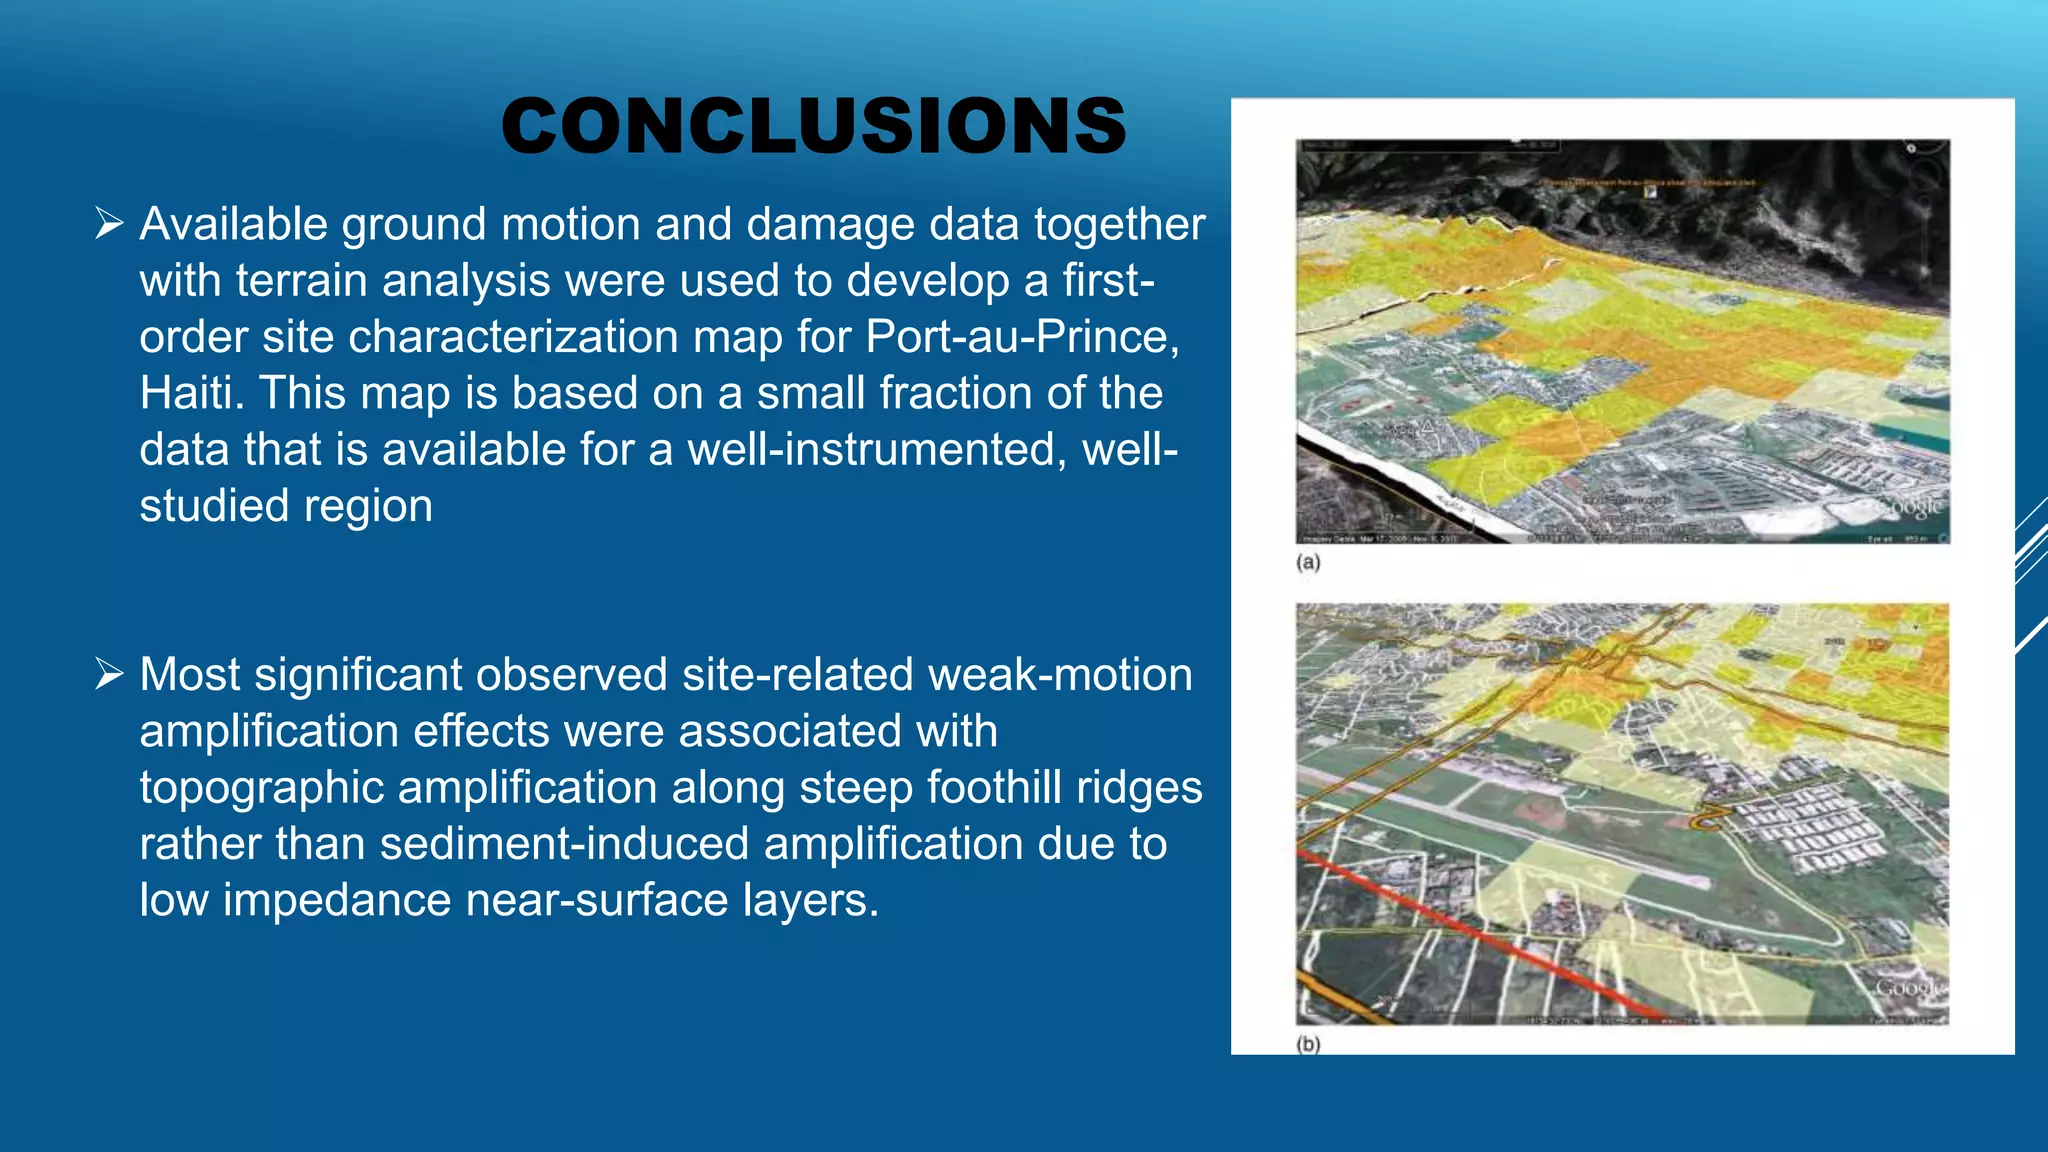
SITE CHARACTERIZATION AND SITE
RESPONSE IN PORT-AU-PRINCE, HAITI
Susan E. Hough, Alan Yong, Jean Robert Altidor,Dieuseul Anglade,
Doug Given, and Saint-Louis Mildor
Presented By:
Shuvendu Biswas 0417042248
Md. Aminul Islam 0417042249
INTRODUCTION
Geological map of Port-au-Prince region
 Is situated within the Cul de Sac
depression, a large rift valley
 Is underlain by young Quaternary
sediments
 Is characterized by lower impedance
than the adjacent central mountainous
core
Factors Behind the Damage :
 Proximity of the earthquake to Port-au-Prince
 High vulnerability of many structures
 High population density
 Amplified shaking by local Topological feathers
 VS30 values at 36 sites by the multi-channel analysis of surface wave
(MASW) method
 NEHRP site class C
 NEHRP class D along the coast, 0.5–2 km wide zone
Degree of Amplification
Sediment-induced
amplification
Topographical
Feature induced
amplification
Base Depth & near
surface layer
impedance
EX. Ridge, valley, River,
etc.
Softness and Thickness
of the layer
 Damage maps derived from remote-sensing imagery
% of building
damage
> 40%
10-40%
0-10%
OBJECTIVE
1. Compare the observed amplitude, predominant periods, variability,
polarization of amplification and predicted topographic amplification
by a steep, narrow ridge
2. Expand the preliminary results, analyze additional events and consider
the variability of site response at the sites on the ridge
3. Develop a site characterization map for the rest of the city based on a
supervised classification approach of terrain units together with
available
OBSERVED AMPLIFICATION
Weak motion amplification factors can be calculated from aftershocks recorded by nine
portable K2 recorders equipped with 2 g force-balance accelerometers and, at two stations,
velocity transducers
HCEA = Hard-rock Reference site
HCEA = Hotel Montana, Ground,
HBME = At valley site
HVGZ = At valley site
HVCV = At Ridge site
HHMT = At Ridge site
M D Time ML Stations
03 21 02:44:28 3.7 HVPR,HBME, HHMT, HCEA,HVGZ,USEM,HPKH
03 28 07:16:17 4.2 HBME,HHMT,HCEA.HVCV,HVGZ,USEM,HPKH
04 10 21:37:14 4.0 HVPR,HBME,HVCV,HVGZ,USEM,HPKH
04 11 16:32:24 3.9 HBME,HVCV,HVGZ,USEM,HPKH
05 03 05:38:48 4.0 HVPR,HCEA,HVCV,HVGZ,USEM,HPKH,HPLZ
05 03 19:21:24 4.4 HVPR,HBME,HCEA,HVCV,HVGZ,USEM,HPKH,HPLZ
05 07 21:30:04 3.6 HHMT,HCEA
05 20 06:34:09 4.4 HHMT, HPLZ, HCEA
06 22 16:06:55 3.3 HBME, HHMT, HCEA, HVCV, HPLZ
09 21 04:33:04 4.4 HBME, HHMT, HCEA, HVCV, HPKH
List of Stations recording 11 (M3.3 – 4.5) events recorded between 21 March,
2010 and 21 September, 2010.
Site Response
Seismic Wave
Travel through different soils
(Mechanical and Hydraulic
quality)
Altered seismic Wave
Intensity
Frequency
Duration
‘Site response Analysis’ is used for this transition evaluation Change
Site response Application
• Response spectra development for surface structure
• Estimating
• Stress
• Strain
• Settlement
• Liquefaction hazard
Site Response affected by
• Soil density
• Plasticity index
• Stiffness
• Soil damping ratio
Site Response
Site response analyses assume vertically propagating shear waves in a horizontally layered soil–
rock system and simply ignore the effect of site response to vertical earthquake motion, although
actual ground motions are comprised of both horizontal and vertical components
Site Response
 Site response measured by calculating spectral rations at HBME, HVGZ,
HVCV, and HHMT stations using smoothed spectra with a 12-sec window
bracketing the S wave(both component)
 Spectral Rations are characterized by high variability; aleatory and
epistemic uncertainty.
Valley stations(HBME & HVGZ)
• Similar Spectral Rations
• Ground Motion at stations
systematically amplified w.r.t. HCEA.
• Amplification not dramatic, 0.5 ~10
Hz.
Ridge stations(HVCV & HHMT )
• Different spectral Rations
• HHMT amplification 6~8 Hz
• NS component > EW component
• HVCV amplification dramatic, 0.5~20
Hz
Ref. station’s ground motion uncertainty influenced the site
response of local station
Site Response
PGA is measured by instruments, accelerographs.
Moderate Earthquakes damage can assess from PGA value; but
for severe earthquakes PGV used.
PGA amplification
factor (Relative to
HCEA station) chart
→ NS component govern
→ Strong polarization of the highest
amplitude ground motions in the
direction perpendicular to the ridge
axis.
→ For low values of amplification,
strong polarization is not observed
→ Spectral response at HVCV
consistent
→ Site response varied > source
property
Particle motion at HHMT station
3.7 ML
Earthquake
3.3 ML
Earthquake
Topographic Amplification
Topography is the study of the shape and features of the surface of the Earth.
Example of topographical features are Hill, Ridge, valley, rift, etc.
HHMT and HVCV located near Ridge, which has a effect on the earthquake
amplification.
According to Sanchez-Sesma, 1985,
For a wedge with internal angle ʋπ and width x, a maximum amplification factor of
approximately 2/ʋ is predicted for frequencies kx/π ~ 2.
Where, x = Ridge width,
k = Wave number.
In our case,
interior wedge angle = 135°
x = 400m
Average shear wave velocity for hill = 2 km/s
the correspondent amplification = 2.7 and frequency = 7.5 Hz
For average shear wave velocity = 1 km/s the frequency = 3.5 Hz
Topographic Amplification
• The predominant frequency of amplification depends on the incidence
angle.
• Estimate a VS30 value of 626 m/s at HHMT.
• Topographic amplification depends on
1. The incident angle
2. Potentially other characteristics of incoming waves.
A limited number of events well recorded across the array, so it is not
possible to investigate systematically the response at HHMT or HVCV as a
function of source location, mechanism, etc.
Topographic Amplification
3.3 ML3.7 ML
4.4 ML 4.4 ML
Sec 
Spectrograms computed for the NS component at station HHMT
Hz
High variability
of amplification
o site is located
edge of a
steep edge
ridge.
o incident angle
and/or source
mechanism
vary
significantly.
Topographic Amplification
Spectrograms computed for the NS component at HVCV
4.4 ML
4.4 ML
3.3 ML
Consistent spectral response at
HVCV
 site is located on a small hill
along the narrow ridge.
FIRST-ORDER SITE CHARACTERIZATION
Digital Elevation Model derived from remote-sensing imagery  Site Characterization map
Advance Spaceborne Thermal Emission and
Reflection Radiometer (ASTER) instrument
Explore the small-scale topographic
features and amplification
Produce gDEM(Global digital elevation
model) (Elevation -15m to 3116m)
• Built by Japan’s METI (Ministry of Economy, Trade and Industry) and launched
onboard NASA’s Terra spacecraft in December 1999.
• The spatial resolution is 15 m in the horizontal plane.
• One nadir-looking ASTER VNIR (visible near-infrared) scene consists of 4,100
samples by 4,200 lines, corresponding to about 60-km-by-60 km ground area
coverage.
• Automated processing of the entire 1.5-million-scene ASTER archive
• Cloud masking to remove cloudy pixels, stacking all cloud-screened DEMs,
removing residual bad values and outliers, averaging selected data to create
final pixel values, and then correcting residual anomalies before partitioning
the data into 1-by-1 tiles.
FIRST-ORDER SITE CHARACTERIZATION
1st step: Translate data values into
monitor and graphics displays
2nd step: Apply color map to the display
values
• In stretch use a histogram of the dataset (0 to 255)
• Sets a floor at 2% and a ceiling 98%
• Data values below and above these values are assigned display values of 0
and 255
• Because this is a linear stretch, the remaining 254 display values are
distributed evenly across the data range.
• The first step yields a picture with 0 (black) to 255 (white).
• For more effectively visualize the feature, color is assigned to each of the display values
• This called "color table.”
• The color table used here is EOS-B, which is a blue (display value 0) to dark red (display
value 255) gradual rainbow with 25 darker bars evenly spaced in the range.
FIRST-ORDER SITE CHARACTERIZATION
3rd step: Classify terrain using Vs30, which was determined by MASW method)
• Small-scale topographic features was filtered first.
• use object-oriented analysis to identify feature.
• the boundary between mountains (NEHRP class B)
• alluvial fan terrains (NEHRP class C)
• between the alluvial fan terrain and basin nearshore terrain
(NEHRP class D)
FIRST-ORDER SITE CHARACTERIZATION
• First-order site characterization map
for the Port-au-Prince region
determined from topographic
analysis.
• Open circles indicate VS30 results
(MASW);
• triangles are recording sites.
This map captures only the variability
in near-surface geotechnical properties
controlled by sediment-induced
amplification of ground motions.
So, observed damage distribution add
to the extend site response results to
understand the topographic feature
effect.
Collapsed area
Observed damage distribution
Intensity MMI V-VI in
severity shaking
Intensity MMI VI in severity
shaking (Type C)
 Damage was largely due to high structural vulnerability; even catastrophic
damage cannot be taken as an indication of high intensities.
 Southern metropolitan Port-au-Prince region, affluent dweller, damage was
generally less severe than in the rest of the city.
High-quality satellite data allows for rapid damage
assessments from remote-sensing imagery.
> 40%
10-40%
0-10%
% of
building
damage
HHMT, high
damage,
located
foothill of
strip ridge
Damage distribution
Damage distribution
Topographic profiles cutting across the ridge at the locations of HHMT and HVCV
• HVCV, the band of high
damage extends over a pair of
sub-parallel ridges.
• HHMT damage is low in the
hills above the ridge, increasing
significantly at the base of the
ridge.
• Damage appears to drop to the north of HHMT, but there were few structures on
the steep hillside immediately north of the hotel.
• The hotel complex itself included two multi-story structures built against the hillside;
one building survived the earthquake, the other collapsed catastrophically.
Topographic contours of ridges inferred to correspond to significant amplification of ground
motion. The base of the eastern ridge can be cleanly delineated by the indicated contour line.
Damage Distribution
CONCLUSIONS
 Available ground motion and damage data together
with terrain analysis were used to develop a first-
order site characterization map for Port-au-Prince,
Haiti. This map is based on a small fraction of the
data that is available for a well-instrumented, well-
studied region
 Most significant observed site-related weak-motion
amplification effects were associated with
topographic amplification along steep foothill ridges
rather than sediment-induced amplification due to
low impedance near-surface layers.
 All of our site response estimates are derived from weak-
motion data. the damage distribution provides a
confirmation that amplification is significant for strong as
well as weak ground motion.
 Effective microzonation for the city of Port-au-Prince will
need to incorporate both topographic and sediment-
induced amplification effects.
CONCLUSIONS
THANK YOU
ALL
ANY QUESTIONS?

Site characterization and site response in port au-prince, (1)

  • 1.
    SITE CHARACTERIZATION ANDSITE RESPONSE IN PORT-AU-PRINCE, HAITI Susan E. Hough, Alan Yong, Jean Robert Altidor,Dieuseul Anglade, Doug Given, and Saint-Louis Mildor Presented By: Shuvendu Biswas 0417042248 Md. Aminul Islam 0417042249
  • 2.
    INTRODUCTION Geological map ofPort-au-Prince region
  • 3.
     Is situatedwithin the Cul de Sac depression, a large rift valley  Is underlain by young Quaternary sediments  Is characterized by lower impedance than the adjacent central mountainous core Factors Behind the Damage :  Proximity of the earthquake to Port-au-Prince  High vulnerability of many structures  High population density  Amplified shaking by local Topological feathers
  • 4.
     VS30 valuesat 36 sites by the multi-channel analysis of surface wave (MASW) method  NEHRP site class C  NEHRP class D along the coast, 0.5–2 km wide zone
  • 5.
    Degree of Amplification Sediment-induced amplification Topographical Featureinduced amplification Base Depth & near surface layer impedance EX. Ridge, valley, River, etc. Softness and Thickness of the layer
  • 6.
     Damage mapsderived from remote-sensing imagery % of building damage > 40% 10-40% 0-10%
  • 7.
    OBJECTIVE 1. Compare theobserved amplitude, predominant periods, variability, polarization of amplification and predicted topographic amplification by a steep, narrow ridge 2. Expand the preliminary results, analyze additional events and consider the variability of site response at the sites on the ridge 3. Develop a site characterization map for the rest of the city based on a supervised classification approach of terrain units together with available
  • 8.
    OBSERVED AMPLIFICATION Weak motionamplification factors can be calculated from aftershocks recorded by nine portable K2 recorders equipped with 2 g force-balance accelerometers and, at two stations, velocity transducers HCEA = Hard-rock Reference site HCEA = Hotel Montana, Ground, HBME = At valley site HVGZ = At valley site HVCV = At Ridge site HHMT = At Ridge site
  • 9.
    OBSERVED AMPLIFICATION Weak motionamplification factors can be calculated from aftershocks recorded by nine portable K2 recorders equipped with 2 g force-balance accelerometers and, at two stations, velocity transducers HCEA = Hard-rock Reference site HCEA = Hotel Montana, Ground, HBME = At valley site HVGZ = At valley site HVCV = At Ridge site HHMT = At Ridge site
  • 10.
    M D TimeML Stations 03 21 02:44:28 3.7 HVPR,HBME, HHMT, HCEA,HVGZ,USEM,HPKH 03 28 07:16:17 4.2 HBME,HHMT,HCEA.HVCV,HVGZ,USEM,HPKH 04 10 21:37:14 4.0 HVPR,HBME,HVCV,HVGZ,USEM,HPKH 04 11 16:32:24 3.9 HBME,HVCV,HVGZ,USEM,HPKH 05 03 05:38:48 4.0 HVPR,HCEA,HVCV,HVGZ,USEM,HPKH,HPLZ 05 03 19:21:24 4.4 HVPR,HBME,HCEA,HVCV,HVGZ,USEM,HPKH,HPLZ 05 07 21:30:04 3.6 HHMT,HCEA 05 20 06:34:09 4.4 HHMT, HPLZ, HCEA 06 22 16:06:55 3.3 HBME, HHMT, HCEA, HVCV, HPLZ 09 21 04:33:04 4.4 HBME, HHMT, HCEA, HVCV, HPKH List of Stations recording 11 (M3.3 – 4.5) events recorded between 21 March, 2010 and 21 September, 2010.
  • 11.
    Site Response Seismic Wave Travelthrough different soils (Mechanical and Hydraulic quality) Altered seismic Wave Intensity Frequency Duration ‘Site response Analysis’ is used for this transition evaluation Change Site response Application • Response spectra development for surface structure • Estimating • Stress • Strain • Settlement • Liquefaction hazard Site Response affected by • Soil density • Plasticity index • Stiffness • Soil damping ratio
  • 12.
    Site Response Site responseanalyses assume vertically propagating shear waves in a horizontally layered soil– rock system and simply ignore the effect of site response to vertical earthquake motion, although actual ground motions are comprised of both horizontal and vertical components
  • 13.
    Site Response  Siteresponse measured by calculating spectral rations at HBME, HVGZ, HVCV, and HHMT stations using smoothed spectra with a 12-sec window bracketing the S wave(both component)  Spectral Rations are characterized by high variability; aleatory and epistemic uncertainty. Valley stations(HBME & HVGZ) • Similar Spectral Rations • Ground Motion at stations systematically amplified w.r.t. HCEA. • Amplification not dramatic, 0.5 ~10 Hz. Ridge stations(HVCV & HHMT ) • Different spectral Rations • HHMT amplification 6~8 Hz • NS component > EW component • HVCV amplification dramatic, 0.5~20 Hz Ref. station’s ground motion uncertainty influenced the site response of local station
  • 14.
    Site Response PGA ismeasured by instruments, accelerographs. Moderate Earthquakes damage can assess from PGA value; but for severe earthquakes PGV used. PGA amplification factor (Relative to HCEA station) chart
  • 15.
    → NS componentgovern → Strong polarization of the highest amplitude ground motions in the direction perpendicular to the ridge axis. → For low values of amplification, strong polarization is not observed → Spectral response at HVCV consistent → Site response varied > source property Particle motion at HHMT station 3.7 ML Earthquake 3.3 ML Earthquake
  • 16.
    Topographic Amplification Topography isthe study of the shape and features of the surface of the Earth. Example of topographical features are Hill, Ridge, valley, rift, etc. HHMT and HVCV located near Ridge, which has a effect on the earthquake amplification. According to Sanchez-Sesma, 1985, For a wedge with internal angle ʋπ and width x, a maximum amplification factor of approximately 2/ʋ is predicted for frequencies kx/π ~ 2. Where, x = Ridge width, k = Wave number. In our case, interior wedge angle = 135° x = 400m Average shear wave velocity for hill = 2 km/s the correspondent amplification = 2.7 and frequency = 7.5 Hz For average shear wave velocity = 1 km/s the frequency = 3.5 Hz
  • 17.
    Topographic Amplification • Thepredominant frequency of amplification depends on the incidence angle. • Estimate a VS30 value of 626 m/s at HHMT. • Topographic amplification depends on 1. The incident angle 2. Potentially other characteristics of incoming waves. A limited number of events well recorded across the array, so it is not possible to investigate systematically the response at HHMT or HVCV as a function of source location, mechanism, etc.
  • 18.
    Topographic Amplification 3.3 ML3.7ML 4.4 ML 4.4 ML Sec  Spectrograms computed for the NS component at station HHMT Hz High variability of amplification o site is located edge of a steep edge ridge. o incident angle and/or source mechanism vary significantly.
  • 19.
    Topographic Amplification Spectrograms computedfor the NS component at HVCV 4.4 ML 4.4 ML 3.3 ML Consistent spectral response at HVCV  site is located on a small hill along the narrow ridge.
  • 20.
    FIRST-ORDER SITE CHARACTERIZATION DigitalElevation Model derived from remote-sensing imagery  Site Characterization map Advance Spaceborne Thermal Emission and Reflection Radiometer (ASTER) instrument Explore the small-scale topographic features and amplification Produce gDEM(Global digital elevation model) (Elevation -15m to 3116m) • Built by Japan’s METI (Ministry of Economy, Trade and Industry) and launched onboard NASA’s Terra spacecraft in December 1999. • The spatial resolution is 15 m in the horizontal plane. • One nadir-looking ASTER VNIR (visible near-infrared) scene consists of 4,100 samples by 4,200 lines, corresponding to about 60-km-by-60 km ground area coverage. • Automated processing of the entire 1.5-million-scene ASTER archive • Cloud masking to remove cloudy pixels, stacking all cloud-screened DEMs, removing residual bad values and outliers, averaging selected data to create final pixel values, and then correcting residual anomalies before partitioning the data into 1-by-1 tiles.
  • 21.
    FIRST-ORDER SITE CHARACTERIZATION 1ststep: Translate data values into monitor and graphics displays 2nd step: Apply color map to the display values • In stretch use a histogram of the dataset (0 to 255) • Sets a floor at 2% and a ceiling 98% • Data values below and above these values are assigned display values of 0 and 255 • Because this is a linear stretch, the remaining 254 display values are distributed evenly across the data range. • The first step yields a picture with 0 (black) to 255 (white). • For more effectively visualize the feature, color is assigned to each of the display values • This called "color table.” • The color table used here is EOS-B, which is a blue (display value 0) to dark red (display value 255) gradual rainbow with 25 darker bars evenly spaced in the range.
  • 22.
    FIRST-ORDER SITE CHARACTERIZATION 3rdstep: Classify terrain using Vs30, which was determined by MASW method) • Small-scale topographic features was filtered first. • use object-oriented analysis to identify feature. • the boundary between mountains (NEHRP class B) • alluvial fan terrains (NEHRP class C) • between the alluvial fan terrain and basin nearshore terrain (NEHRP class D)
  • 23.
    FIRST-ORDER SITE CHARACTERIZATION •First-order site characterization map for the Port-au-Prince region determined from topographic analysis. • Open circles indicate VS30 results (MASW); • triangles are recording sites. This map captures only the variability in near-surface geotechnical properties controlled by sediment-induced amplification of ground motions. So, observed damage distribution add to the extend site response results to understand the topographic feature effect.
  • 24.
    Collapsed area Observed damagedistribution Intensity MMI V-VI in severity shaking Intensity MMI VI in severity shaking (Type C)  Damage was largely due to high structural vulnerability; even catastrophic damage cannot be taken as an indication of high intensities.  Southern metropolitan Port-au-Prince region, affluent dweller, damage was generally less severe than in the rest of the city.
  • 25.
    High-quality satellite dataallows for rapid damage assessments from remote-sensing imagery. > 40% 10-40% 0-10% % of building damage HHMT, high damage, located foothill of strip ridge Damage distribution
  • 26.
    Damage distribution Topographic profilescutting across the ridge at the locations of HHMT and HVCV • HVCV, the band of high damage extends over a pair of sub-parallel ridges. • HHMT damage is low in the hills above the ridge, increasing significantly at the base of the ridge. • Damage appears to drop to the north of HHMT, but there were few structures on the steep hillside immediately north of the hotel. • The hotel complex itself included two multi-story structures built against the hillside; one building survived the earthquake, the other collapsed catastrophically.
  • 27.
    Topographic contours ofridges inferred to correspond to significant amplification of ground motion. The base of the eastern ridge can be cleanly delineated by the indicated contour line. Damage Distribution
  • 28.
    CONCLUSIONS  Available groundmotion and damage data together with terrain analysis were used to develop a first- order site characterization map for Port-au-Prince, Haiti. This map is based on a small fraction of the data that is available for a well-instrumented, well- studied region  Most significant observed site-related weak-motion amplification effects were associated with topographic amplification along steep foothill ridges rather than sediment-induced amplification due to low impedance near-surface layers.
  • 29.
     All ofour site response estimates are derived from weak- motion data. the damage distribution provides a confirmation that amplification is significant for strong as well as weak ground motion.  Effective microzonation for the city of Port-au-Prince will need to incorporate both topographic and sediment- induced amplification effects. CONCLUSIONS
  • 30.