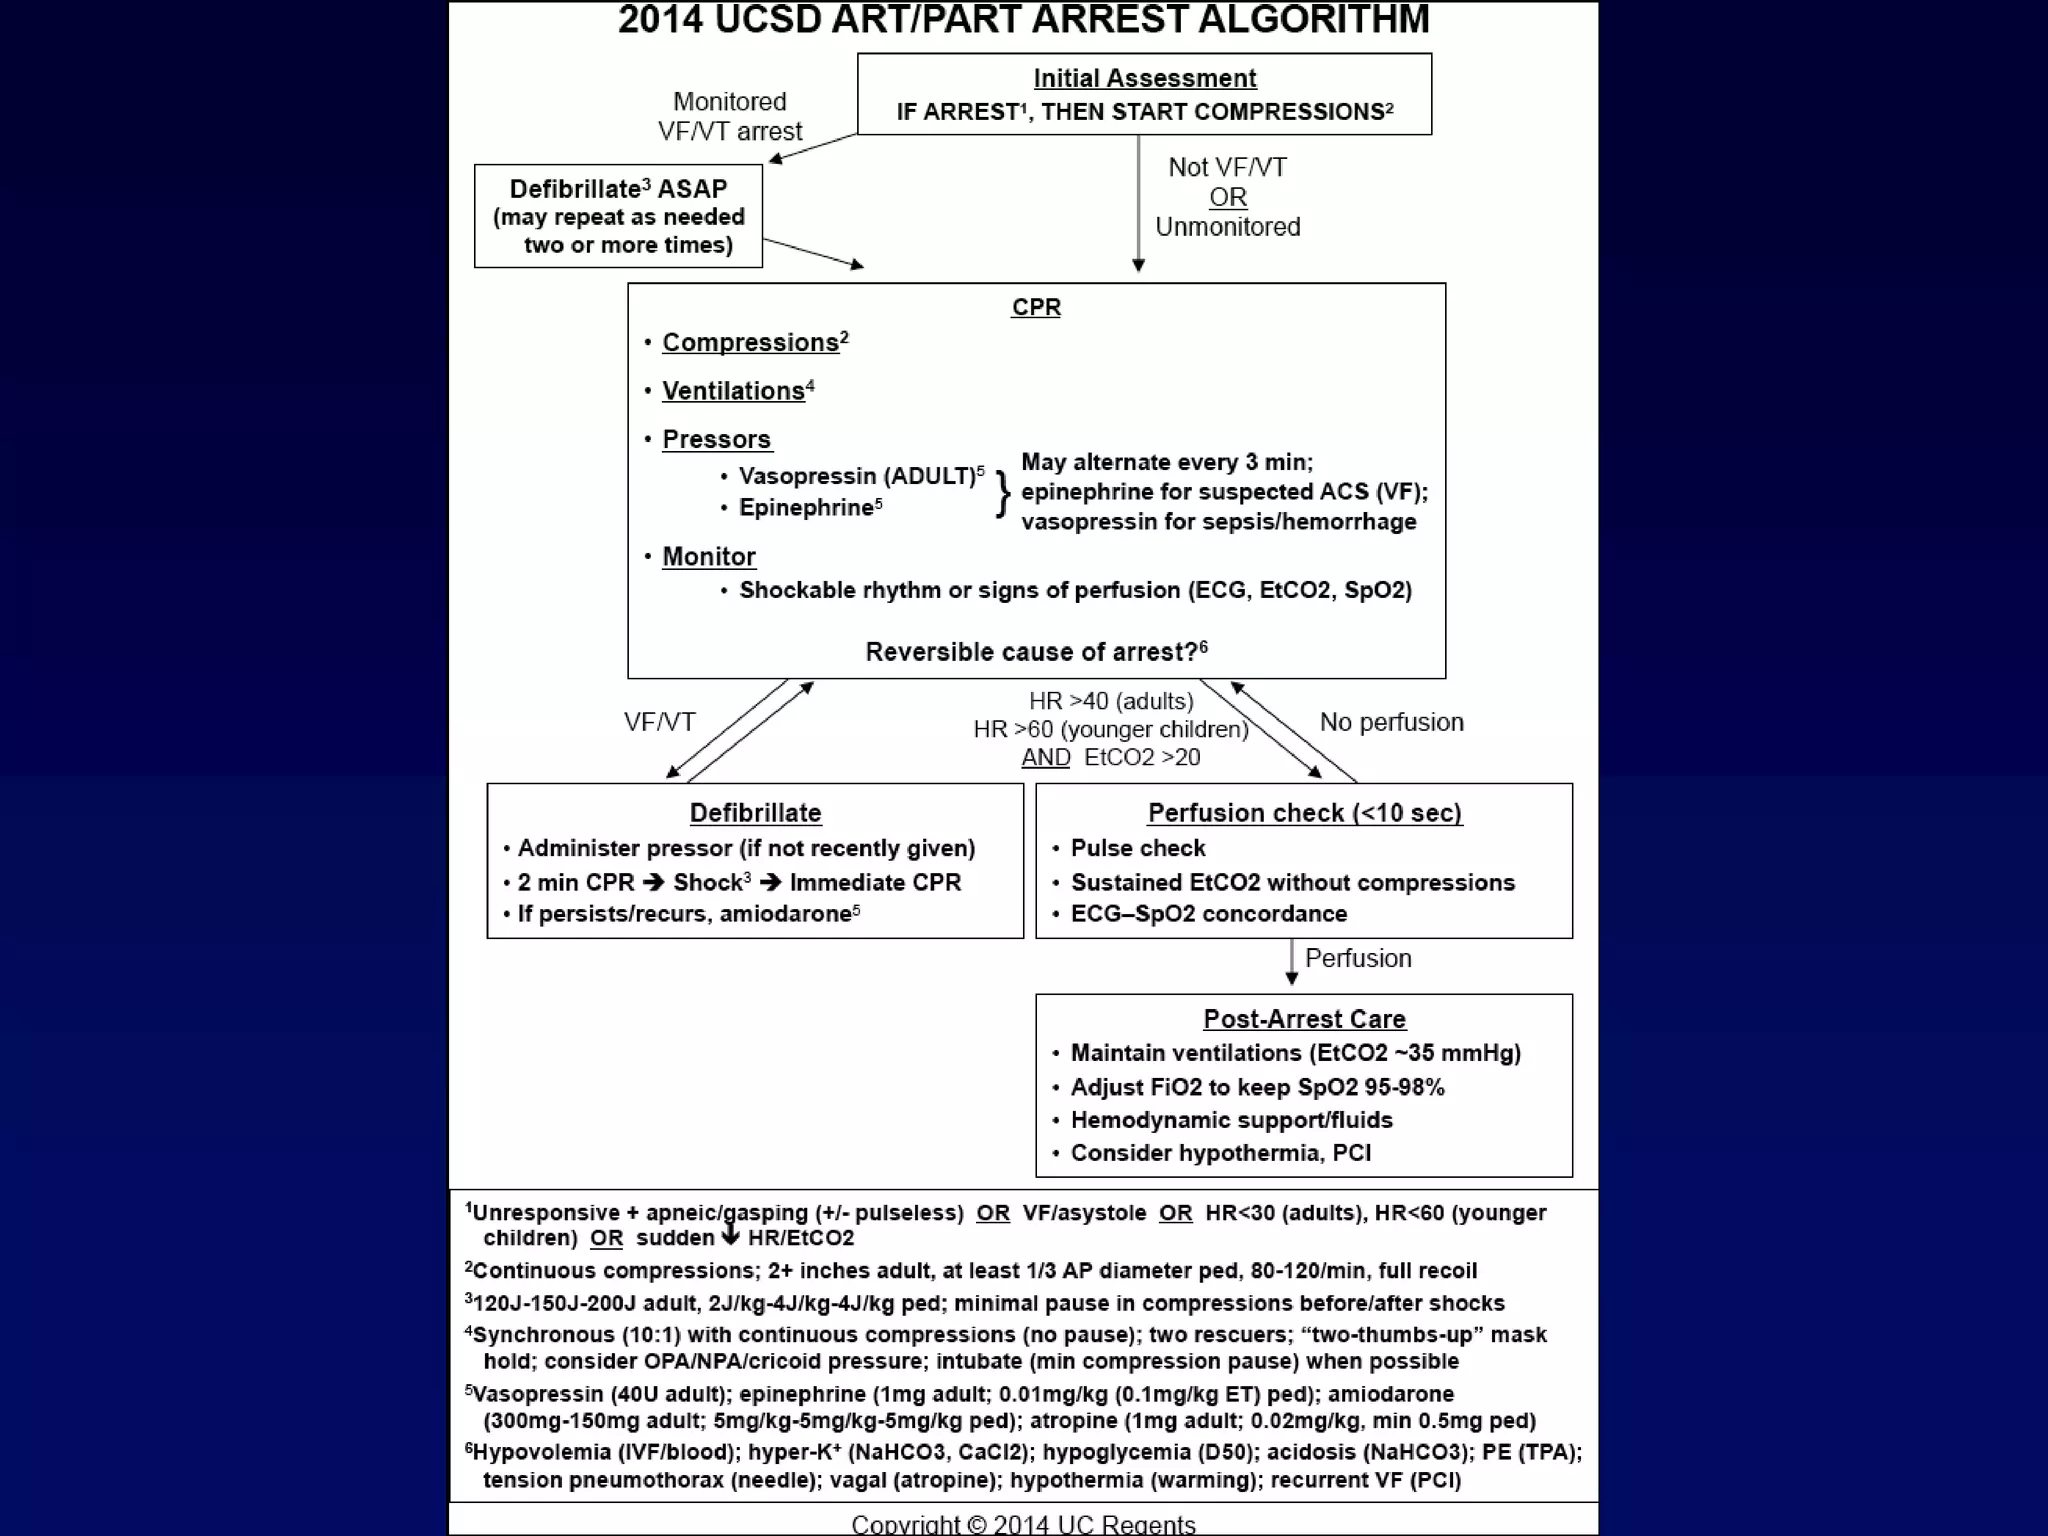
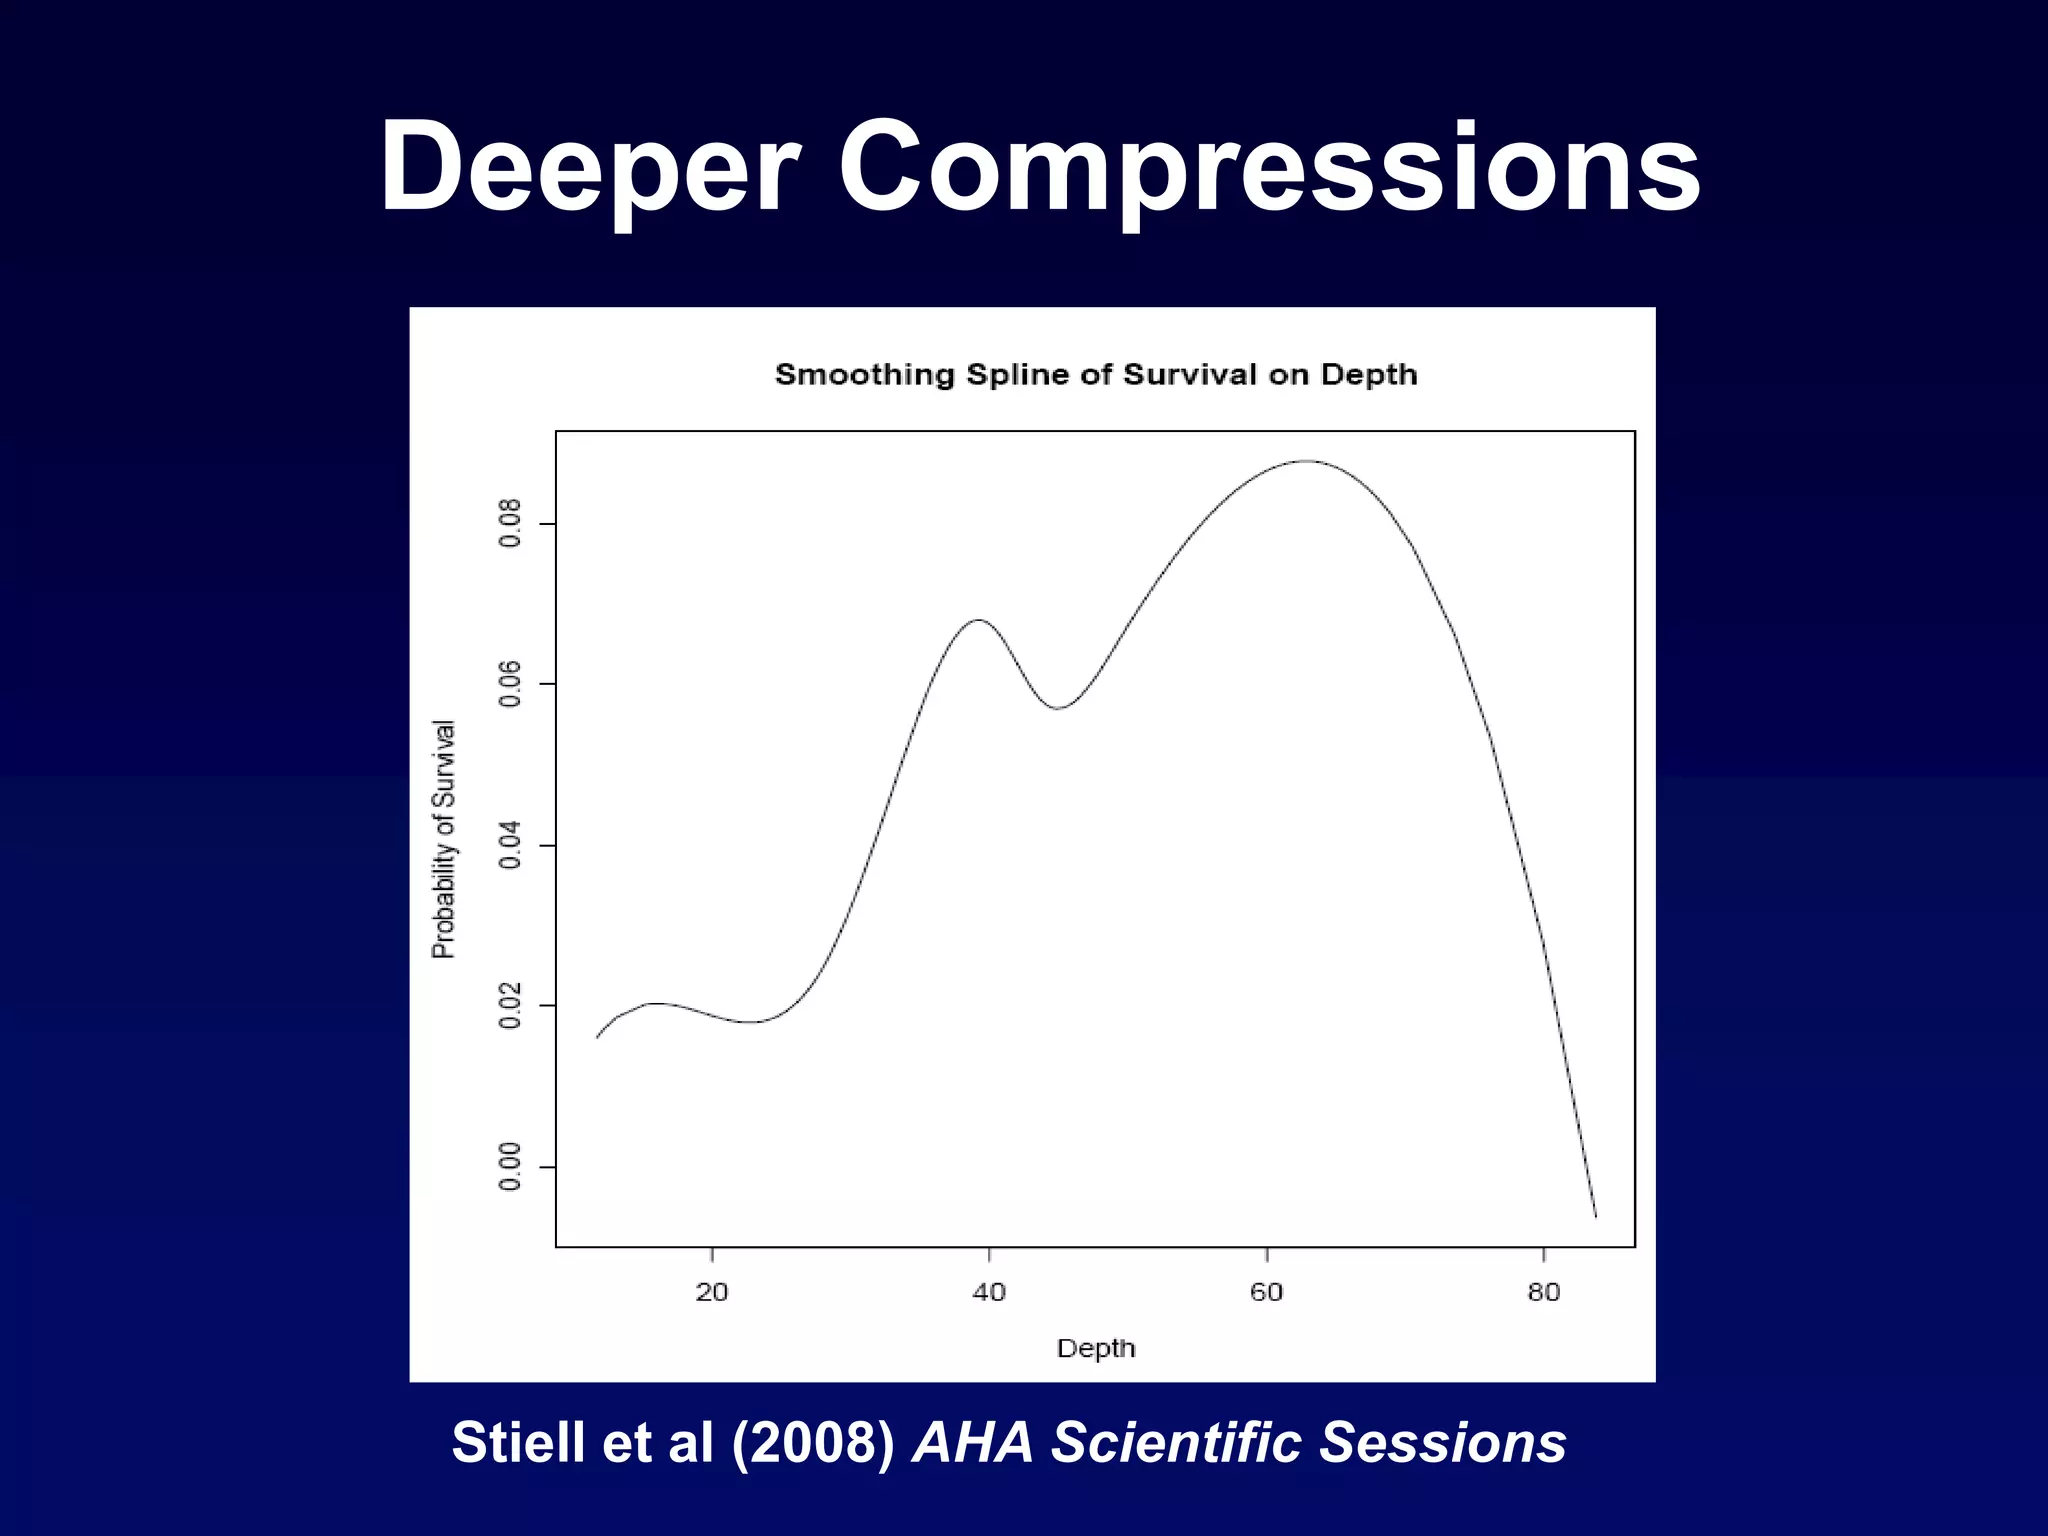
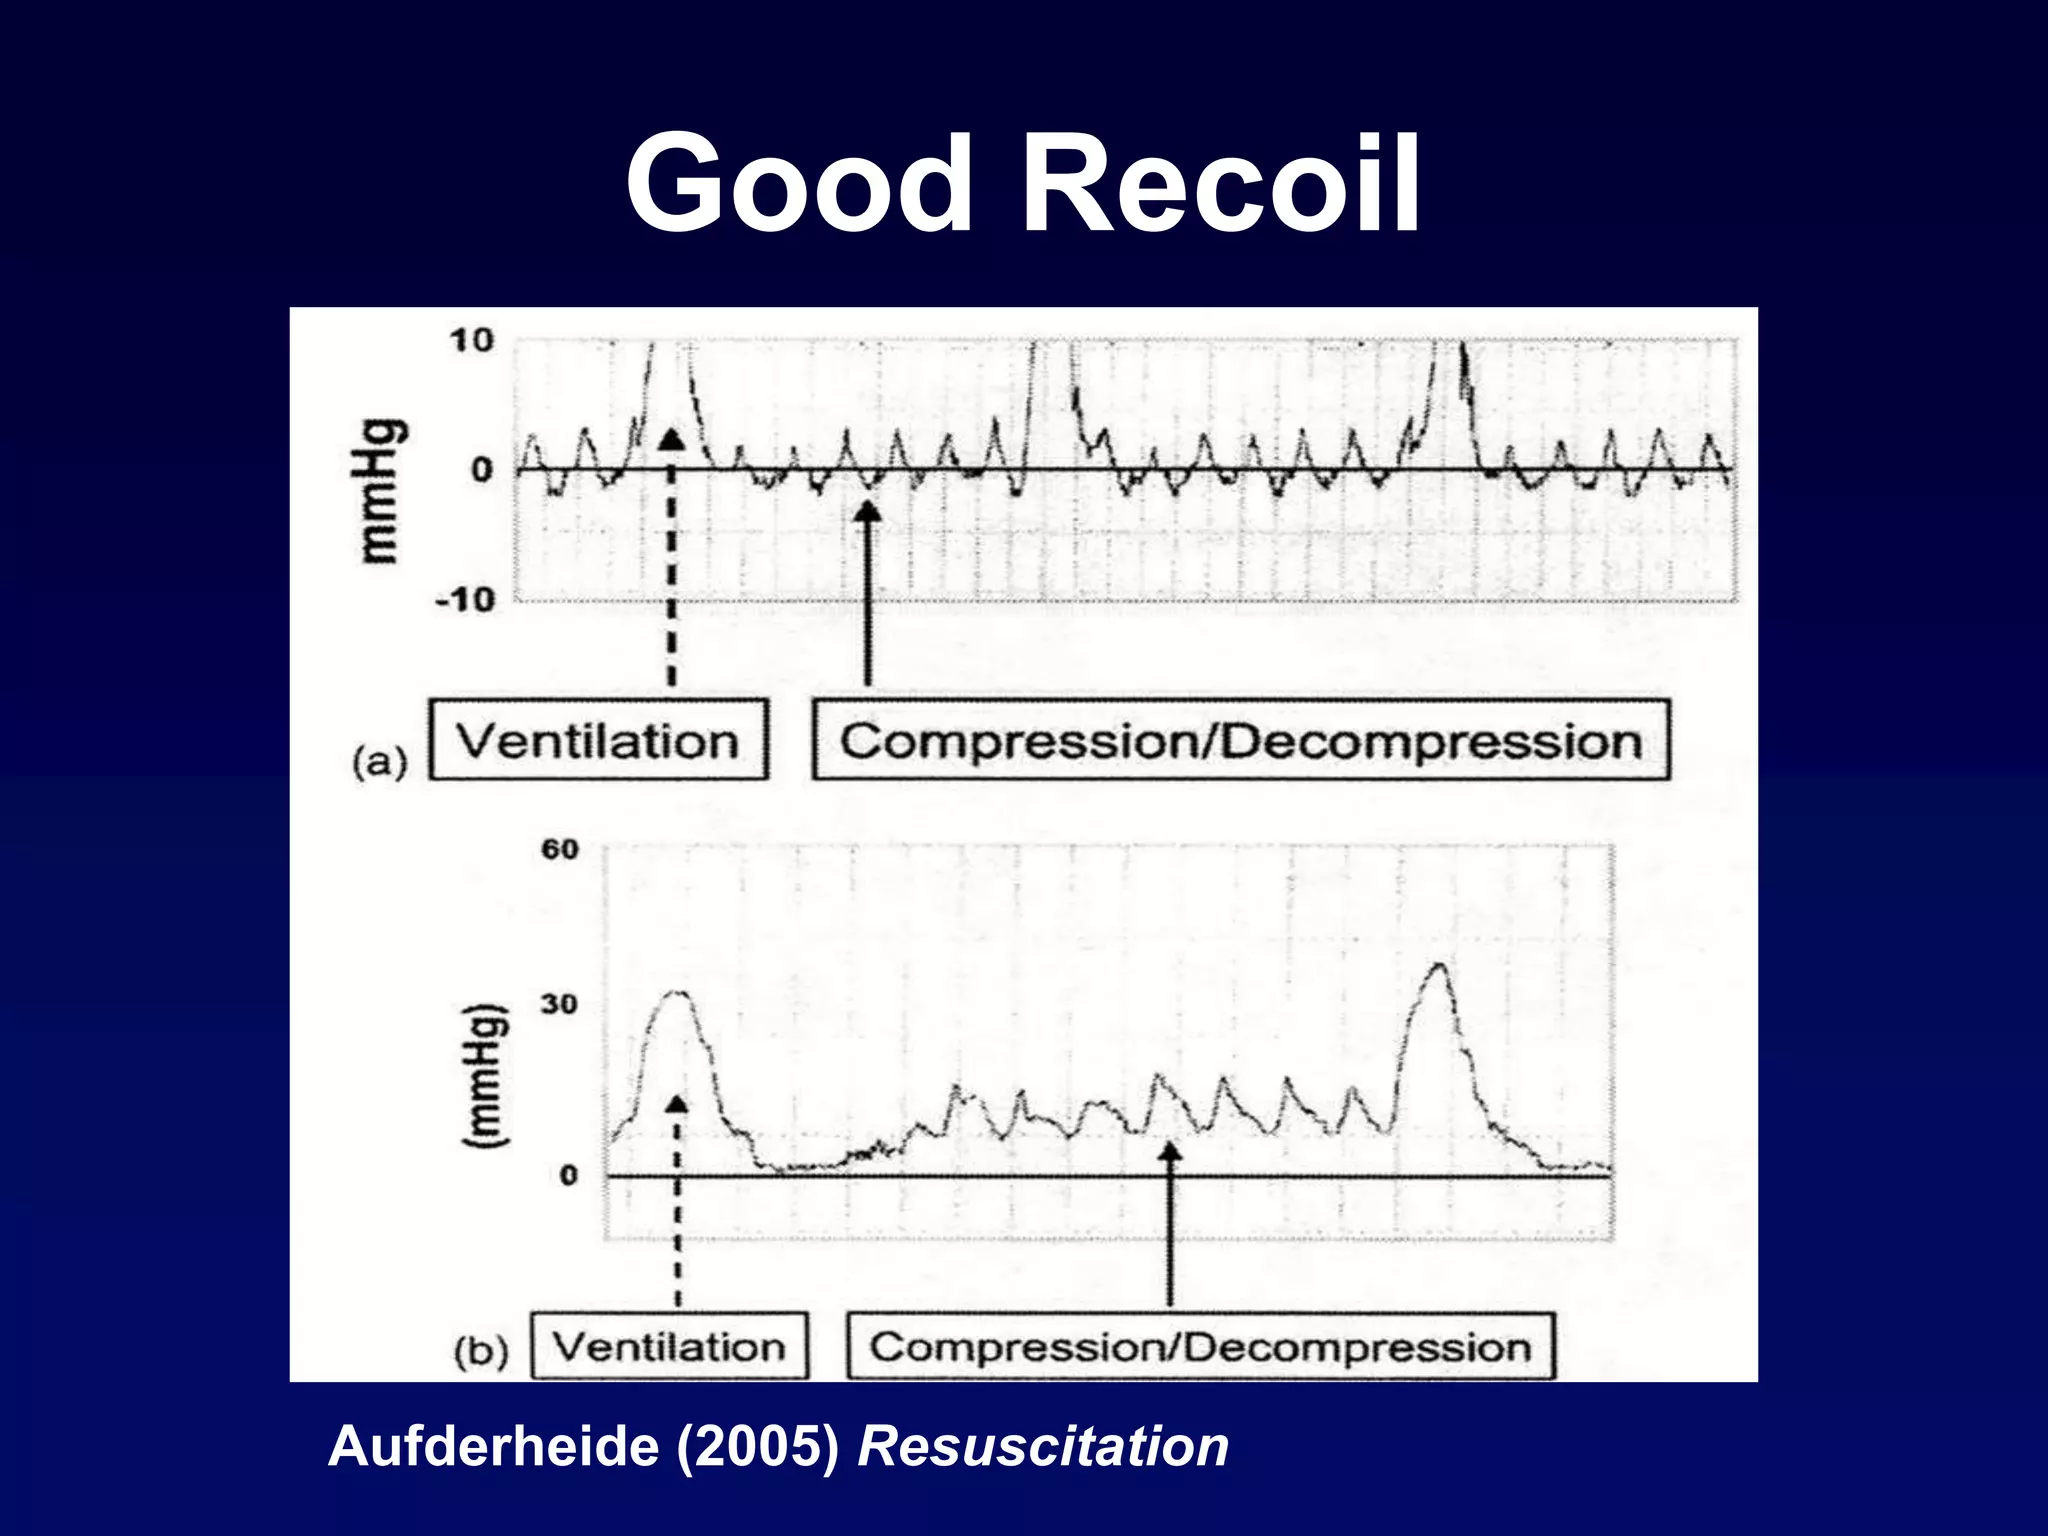
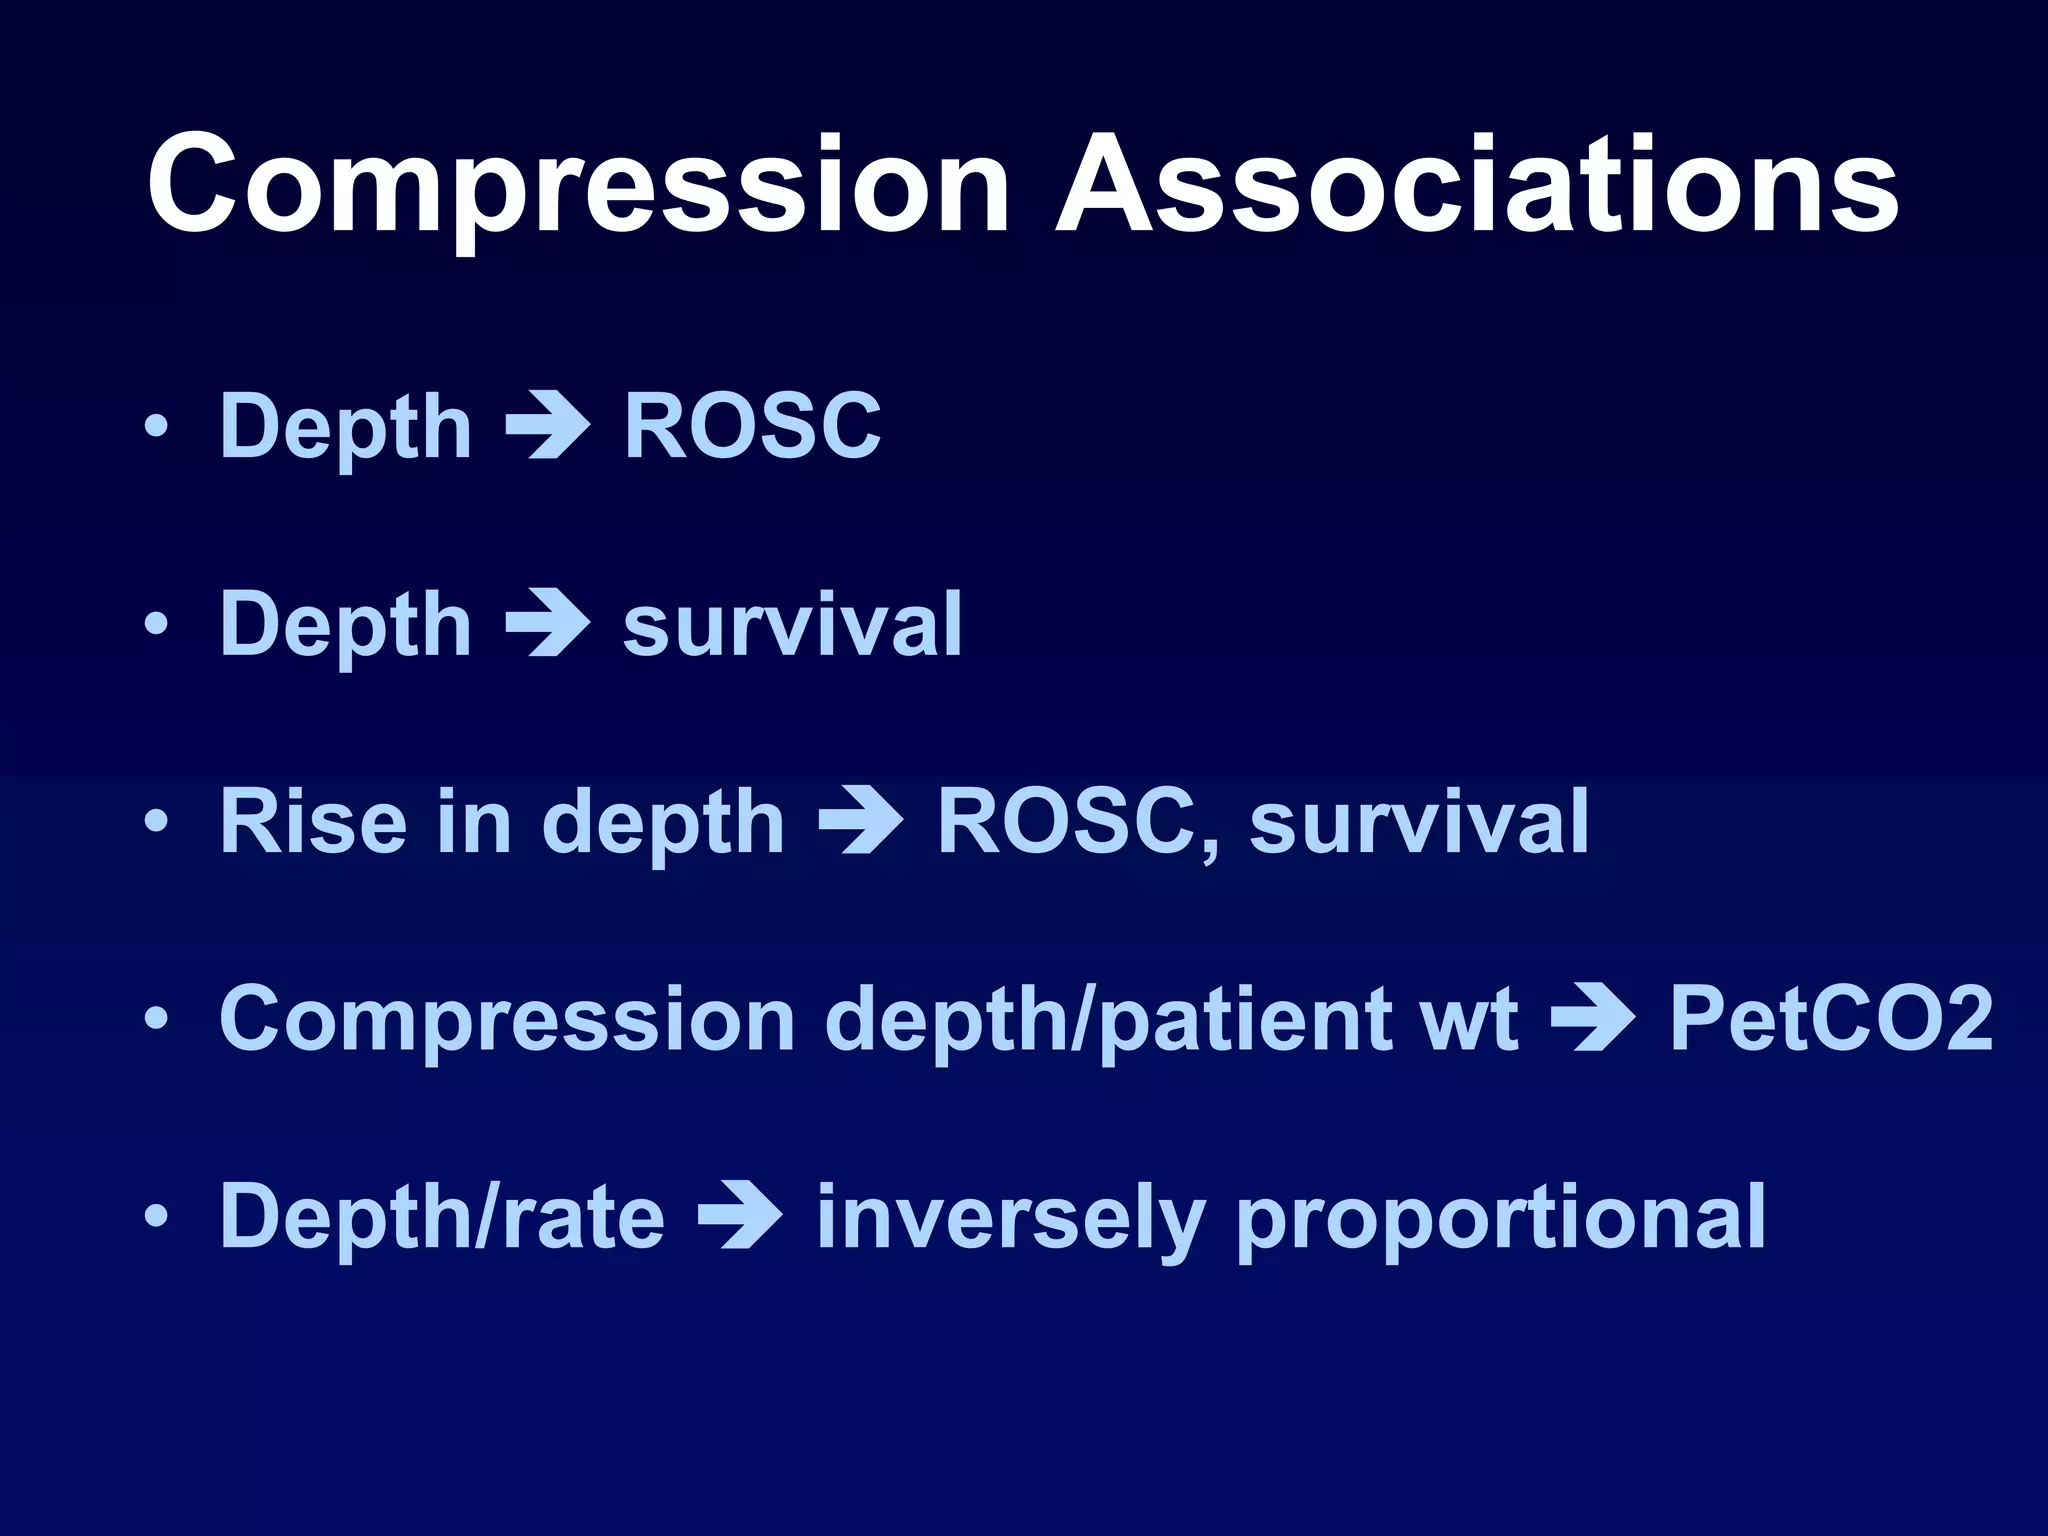
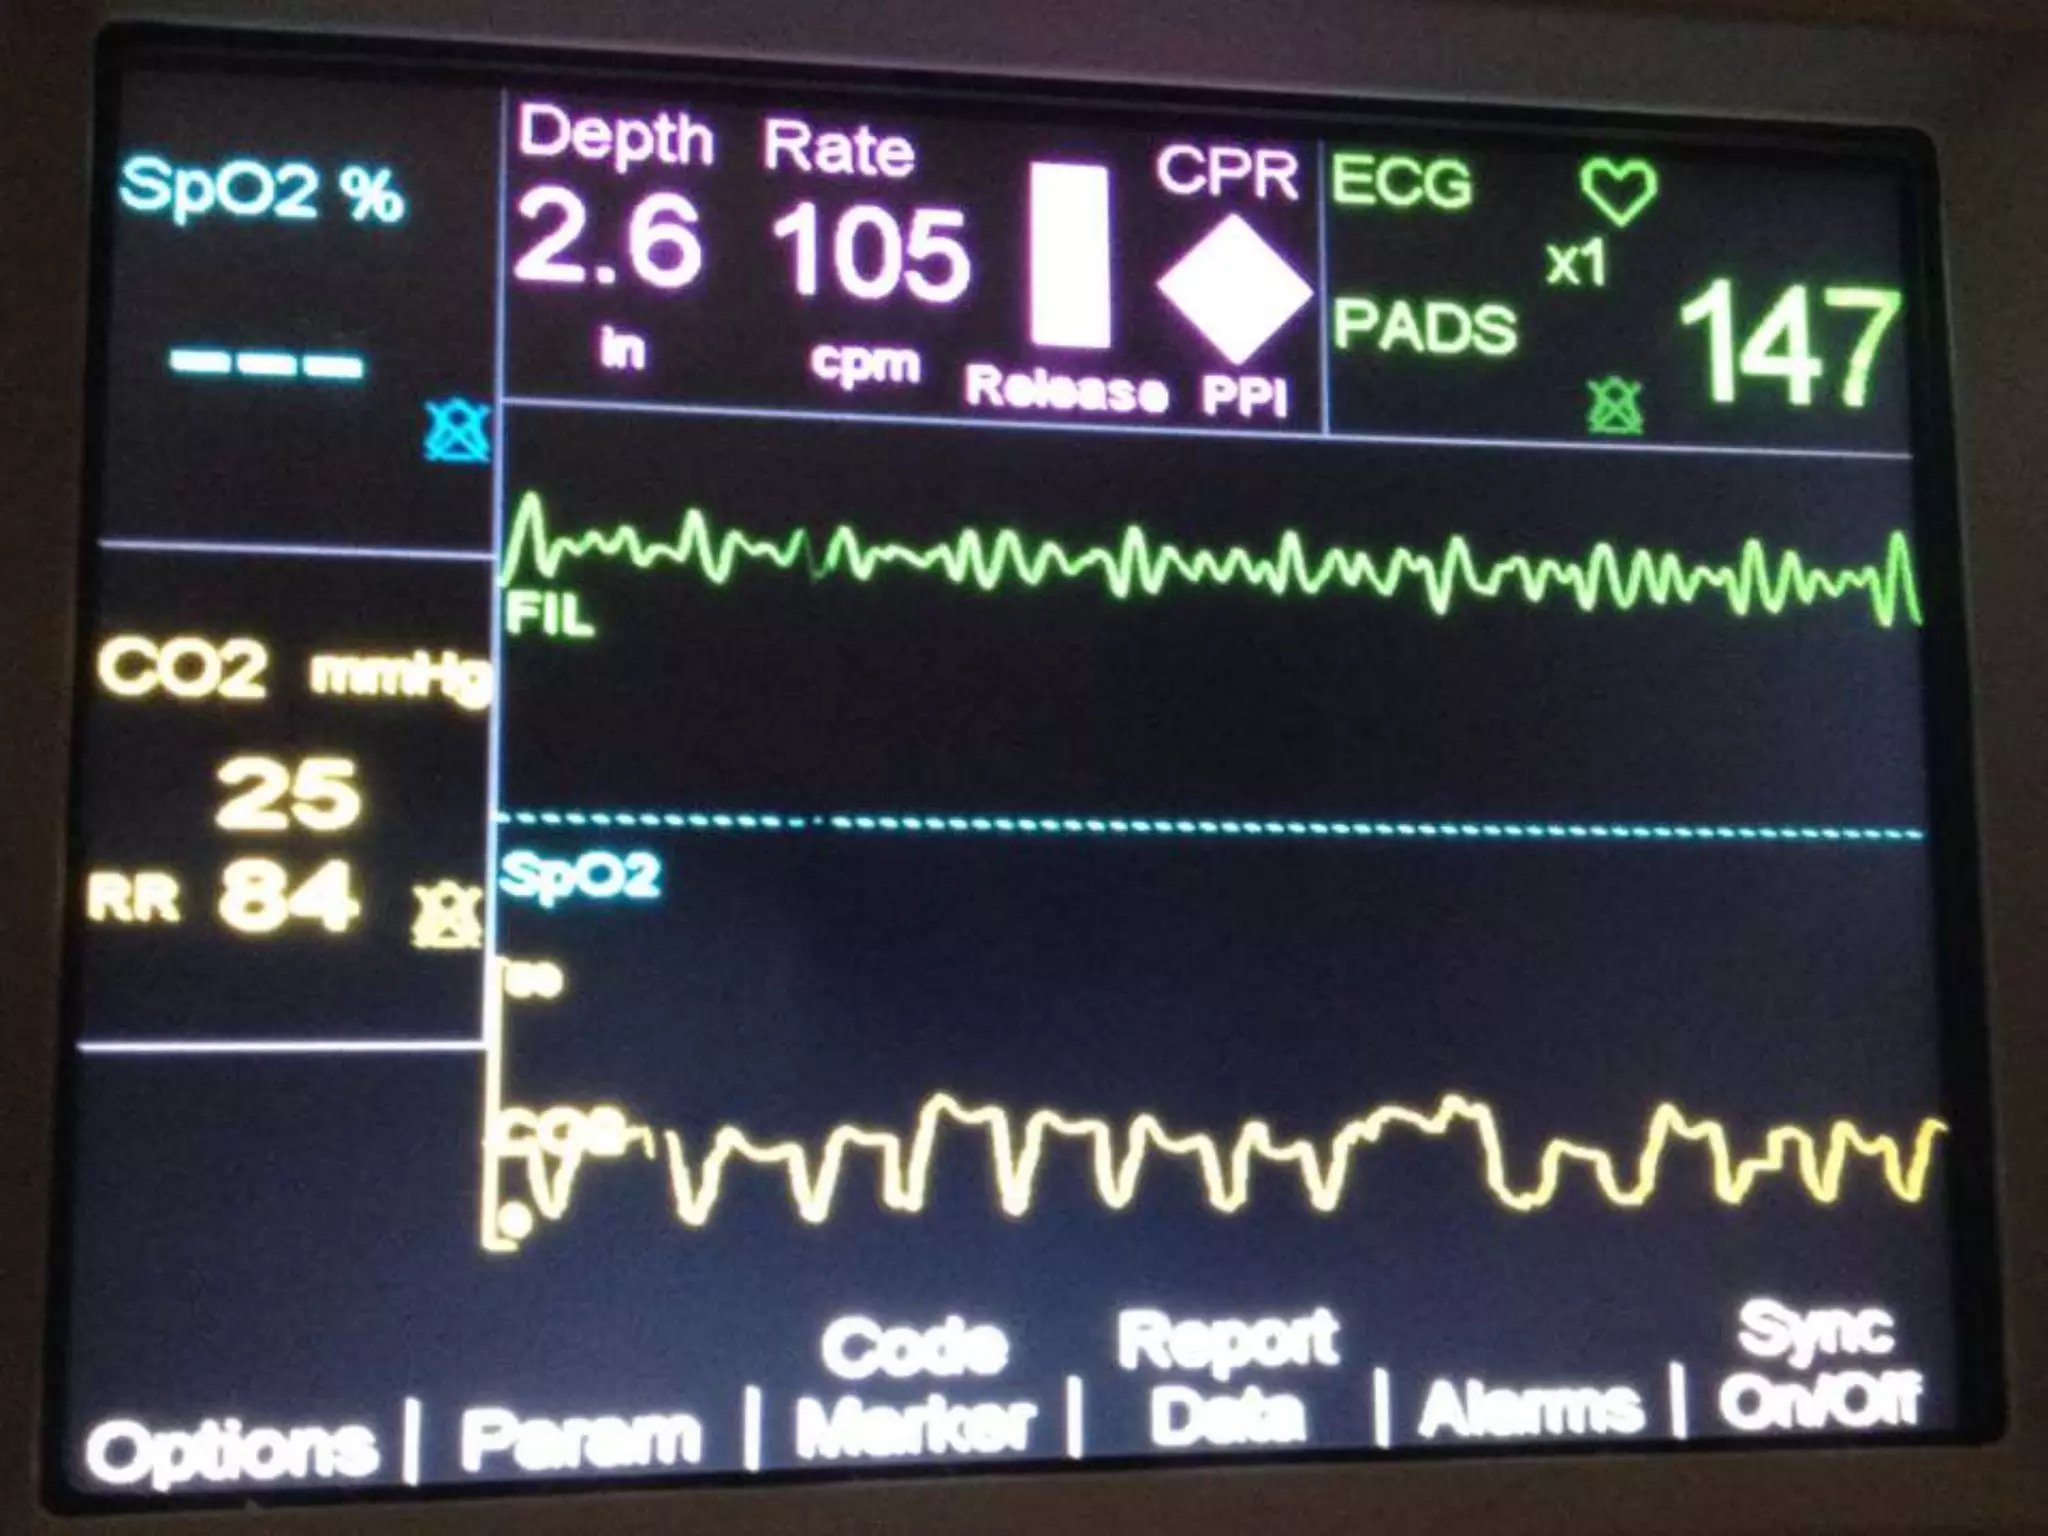
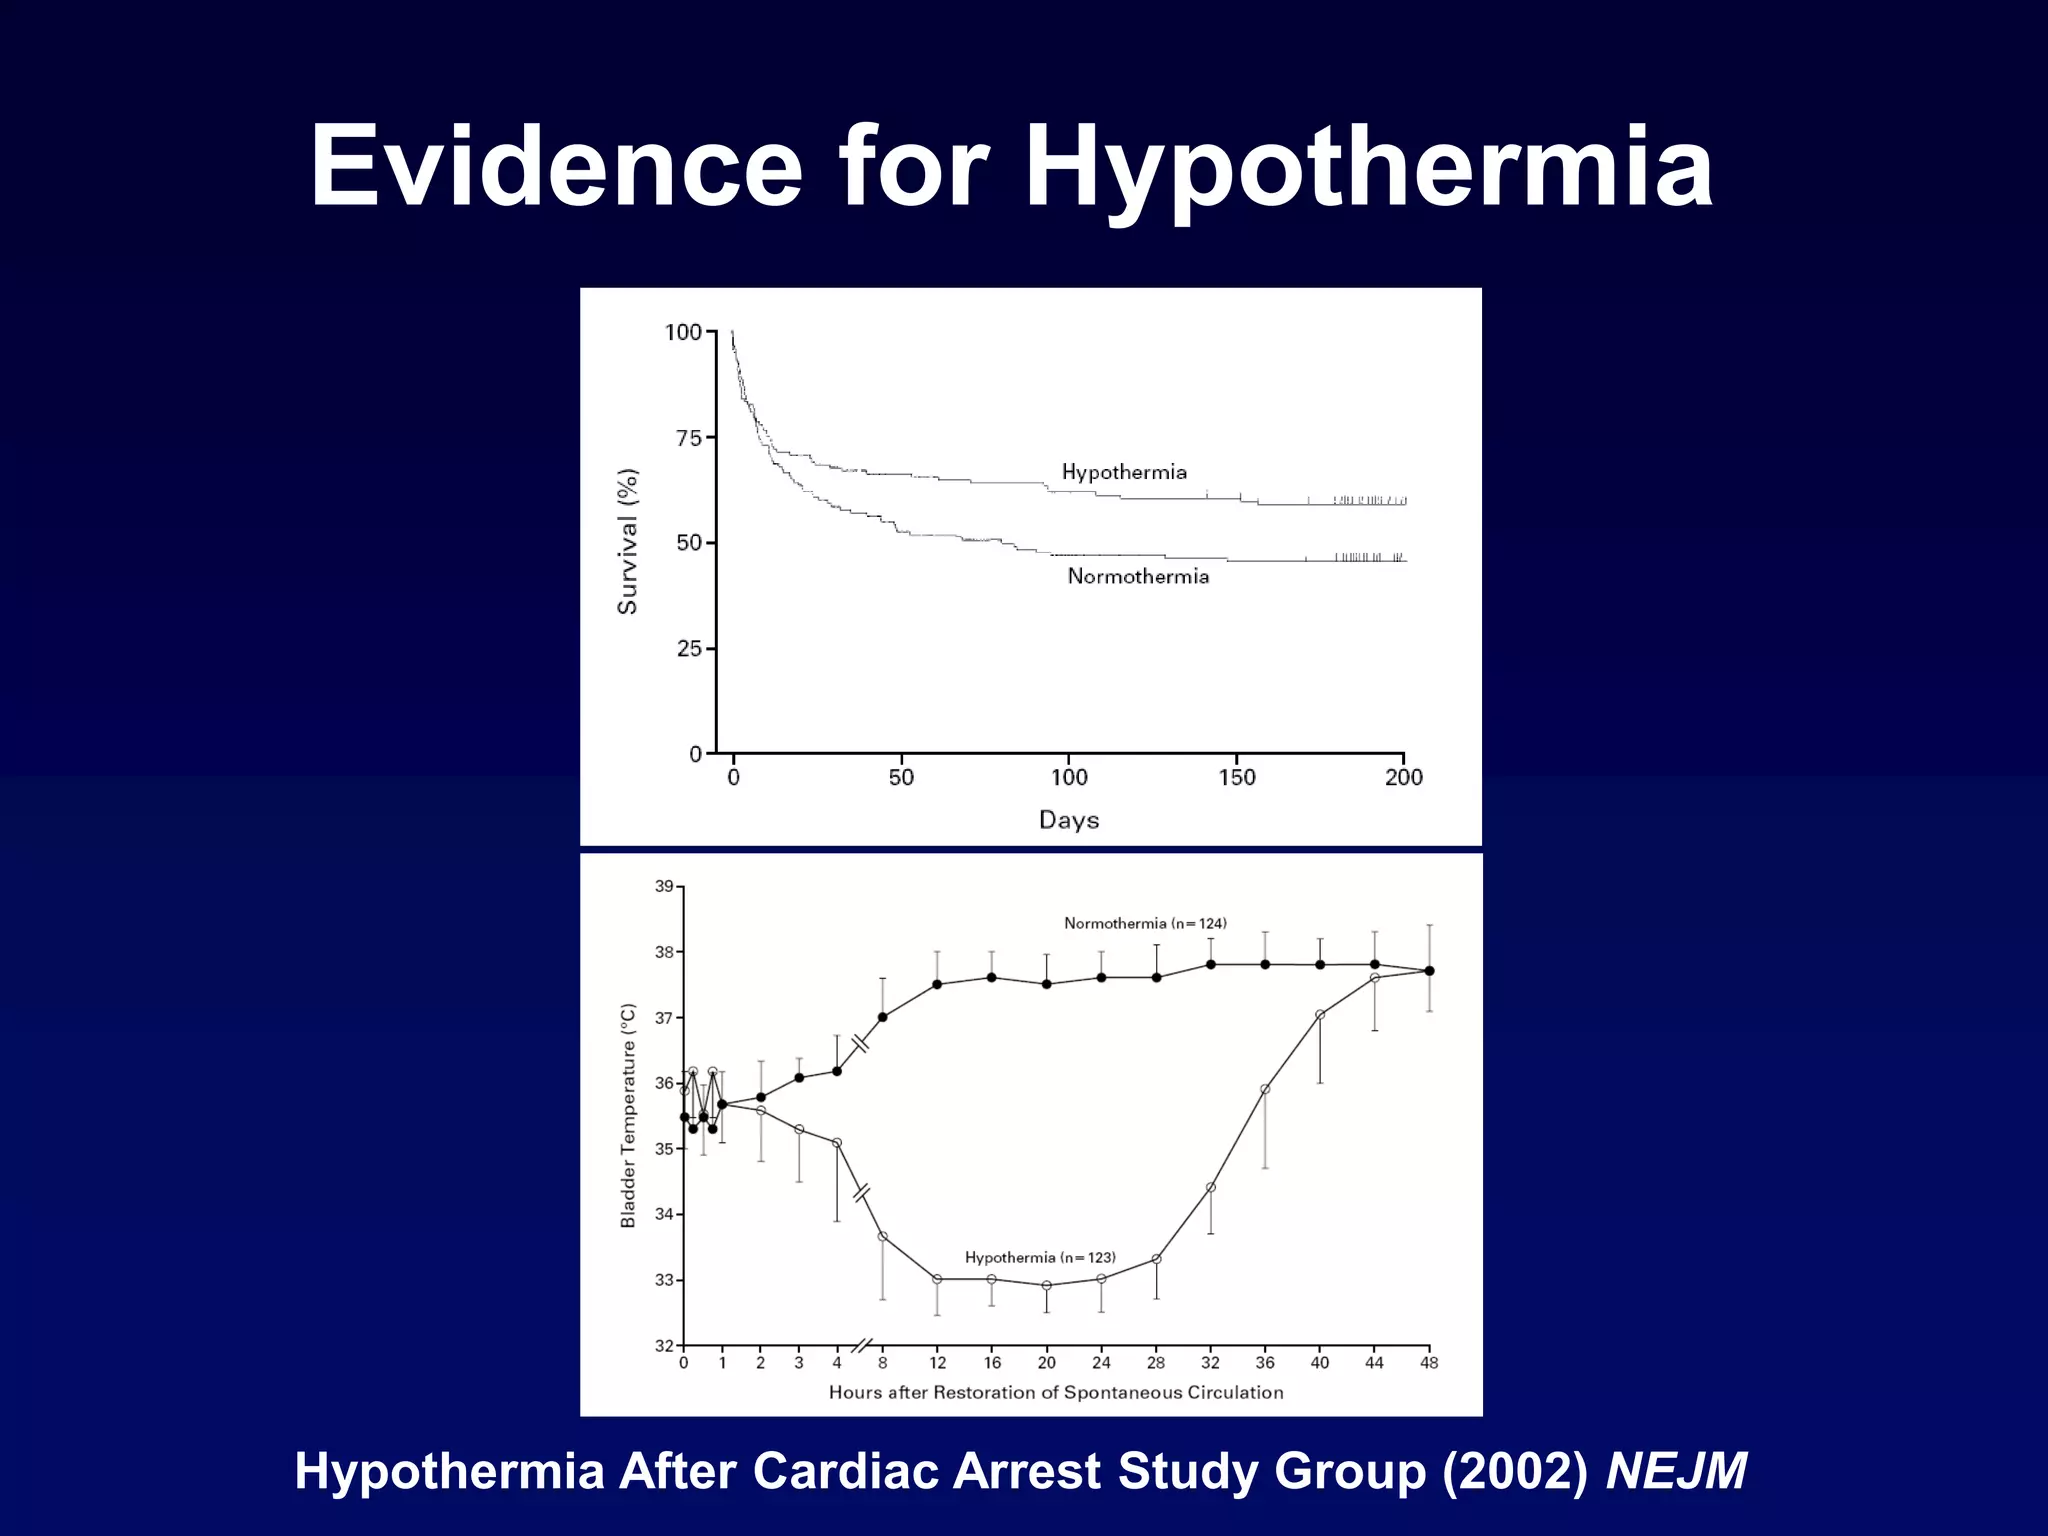
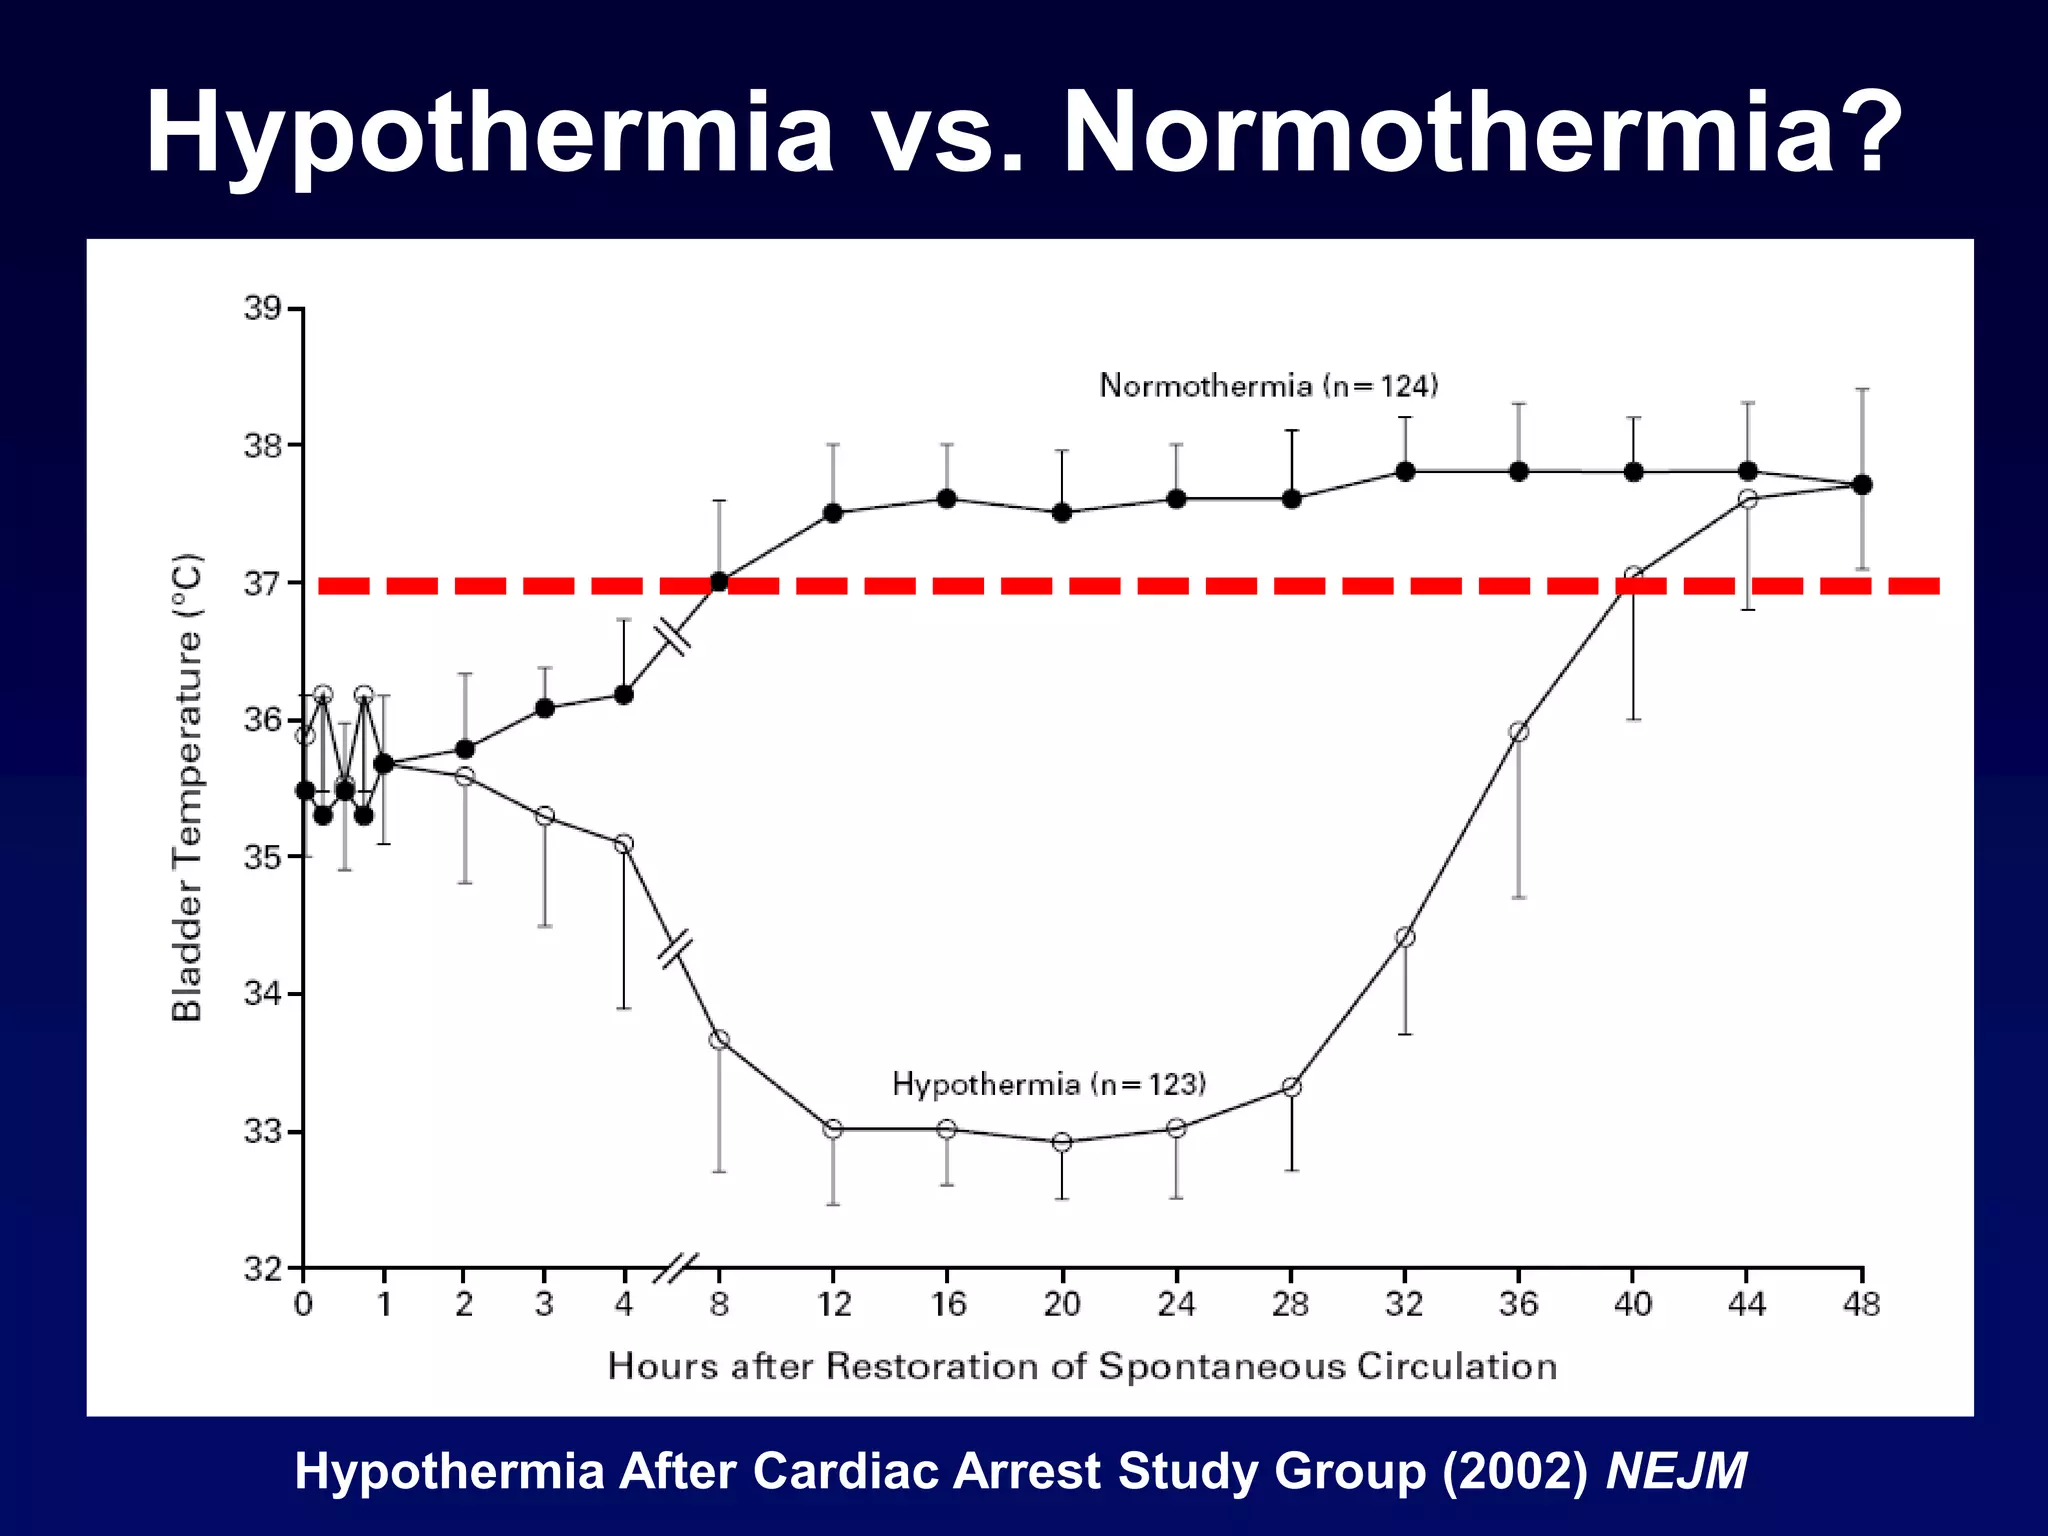
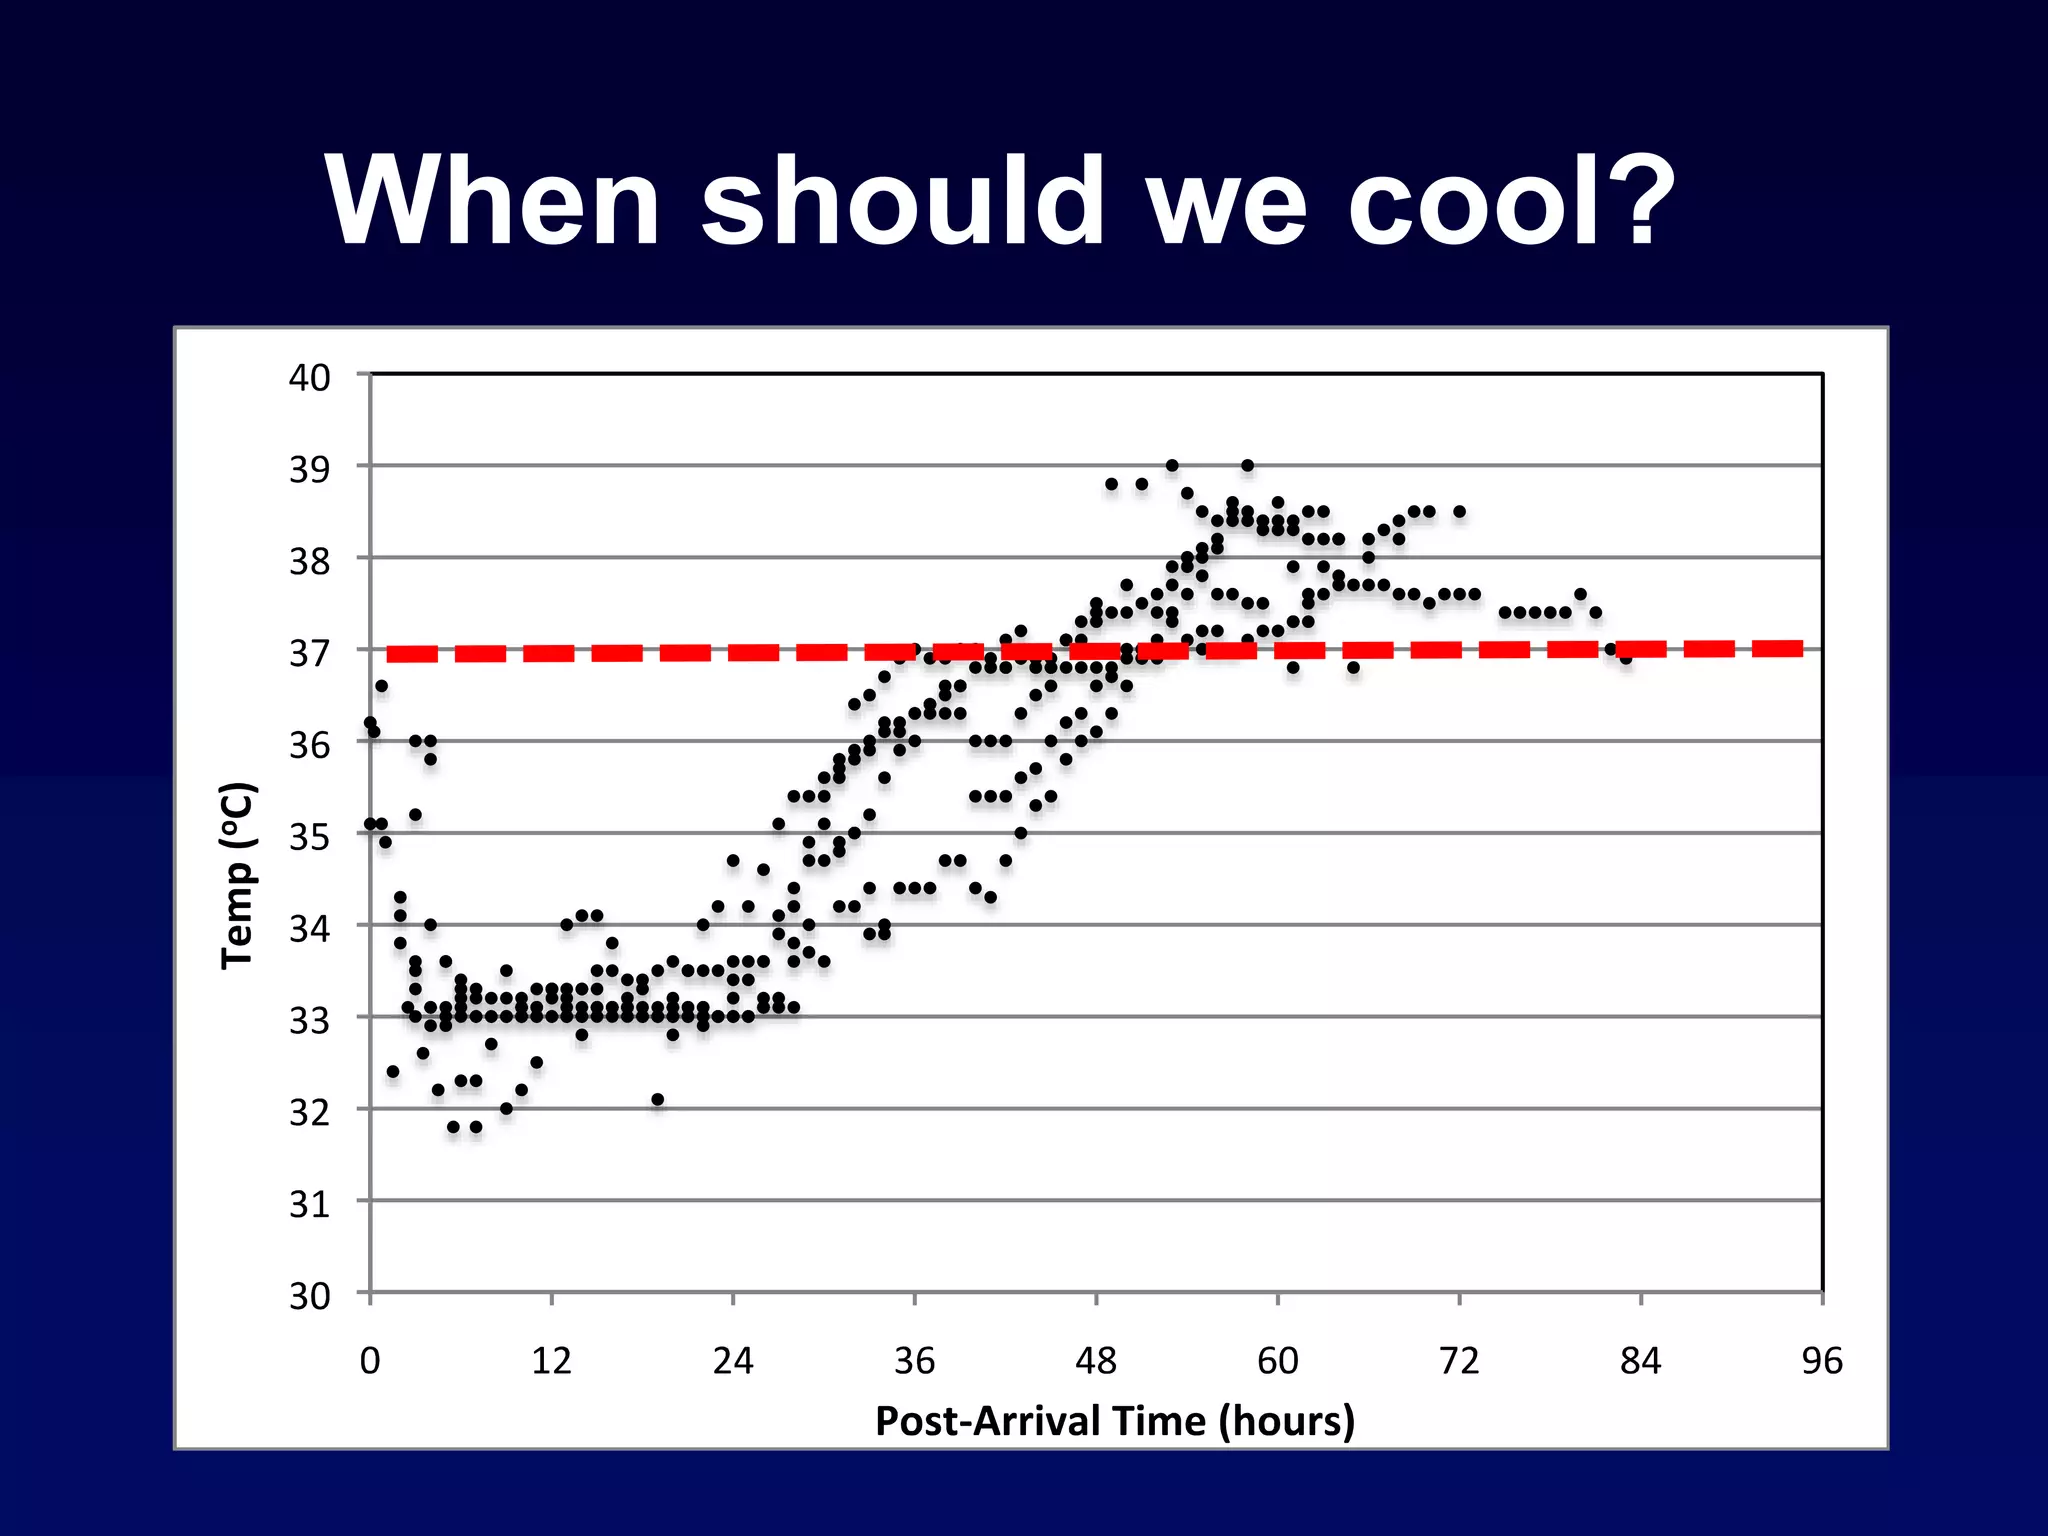
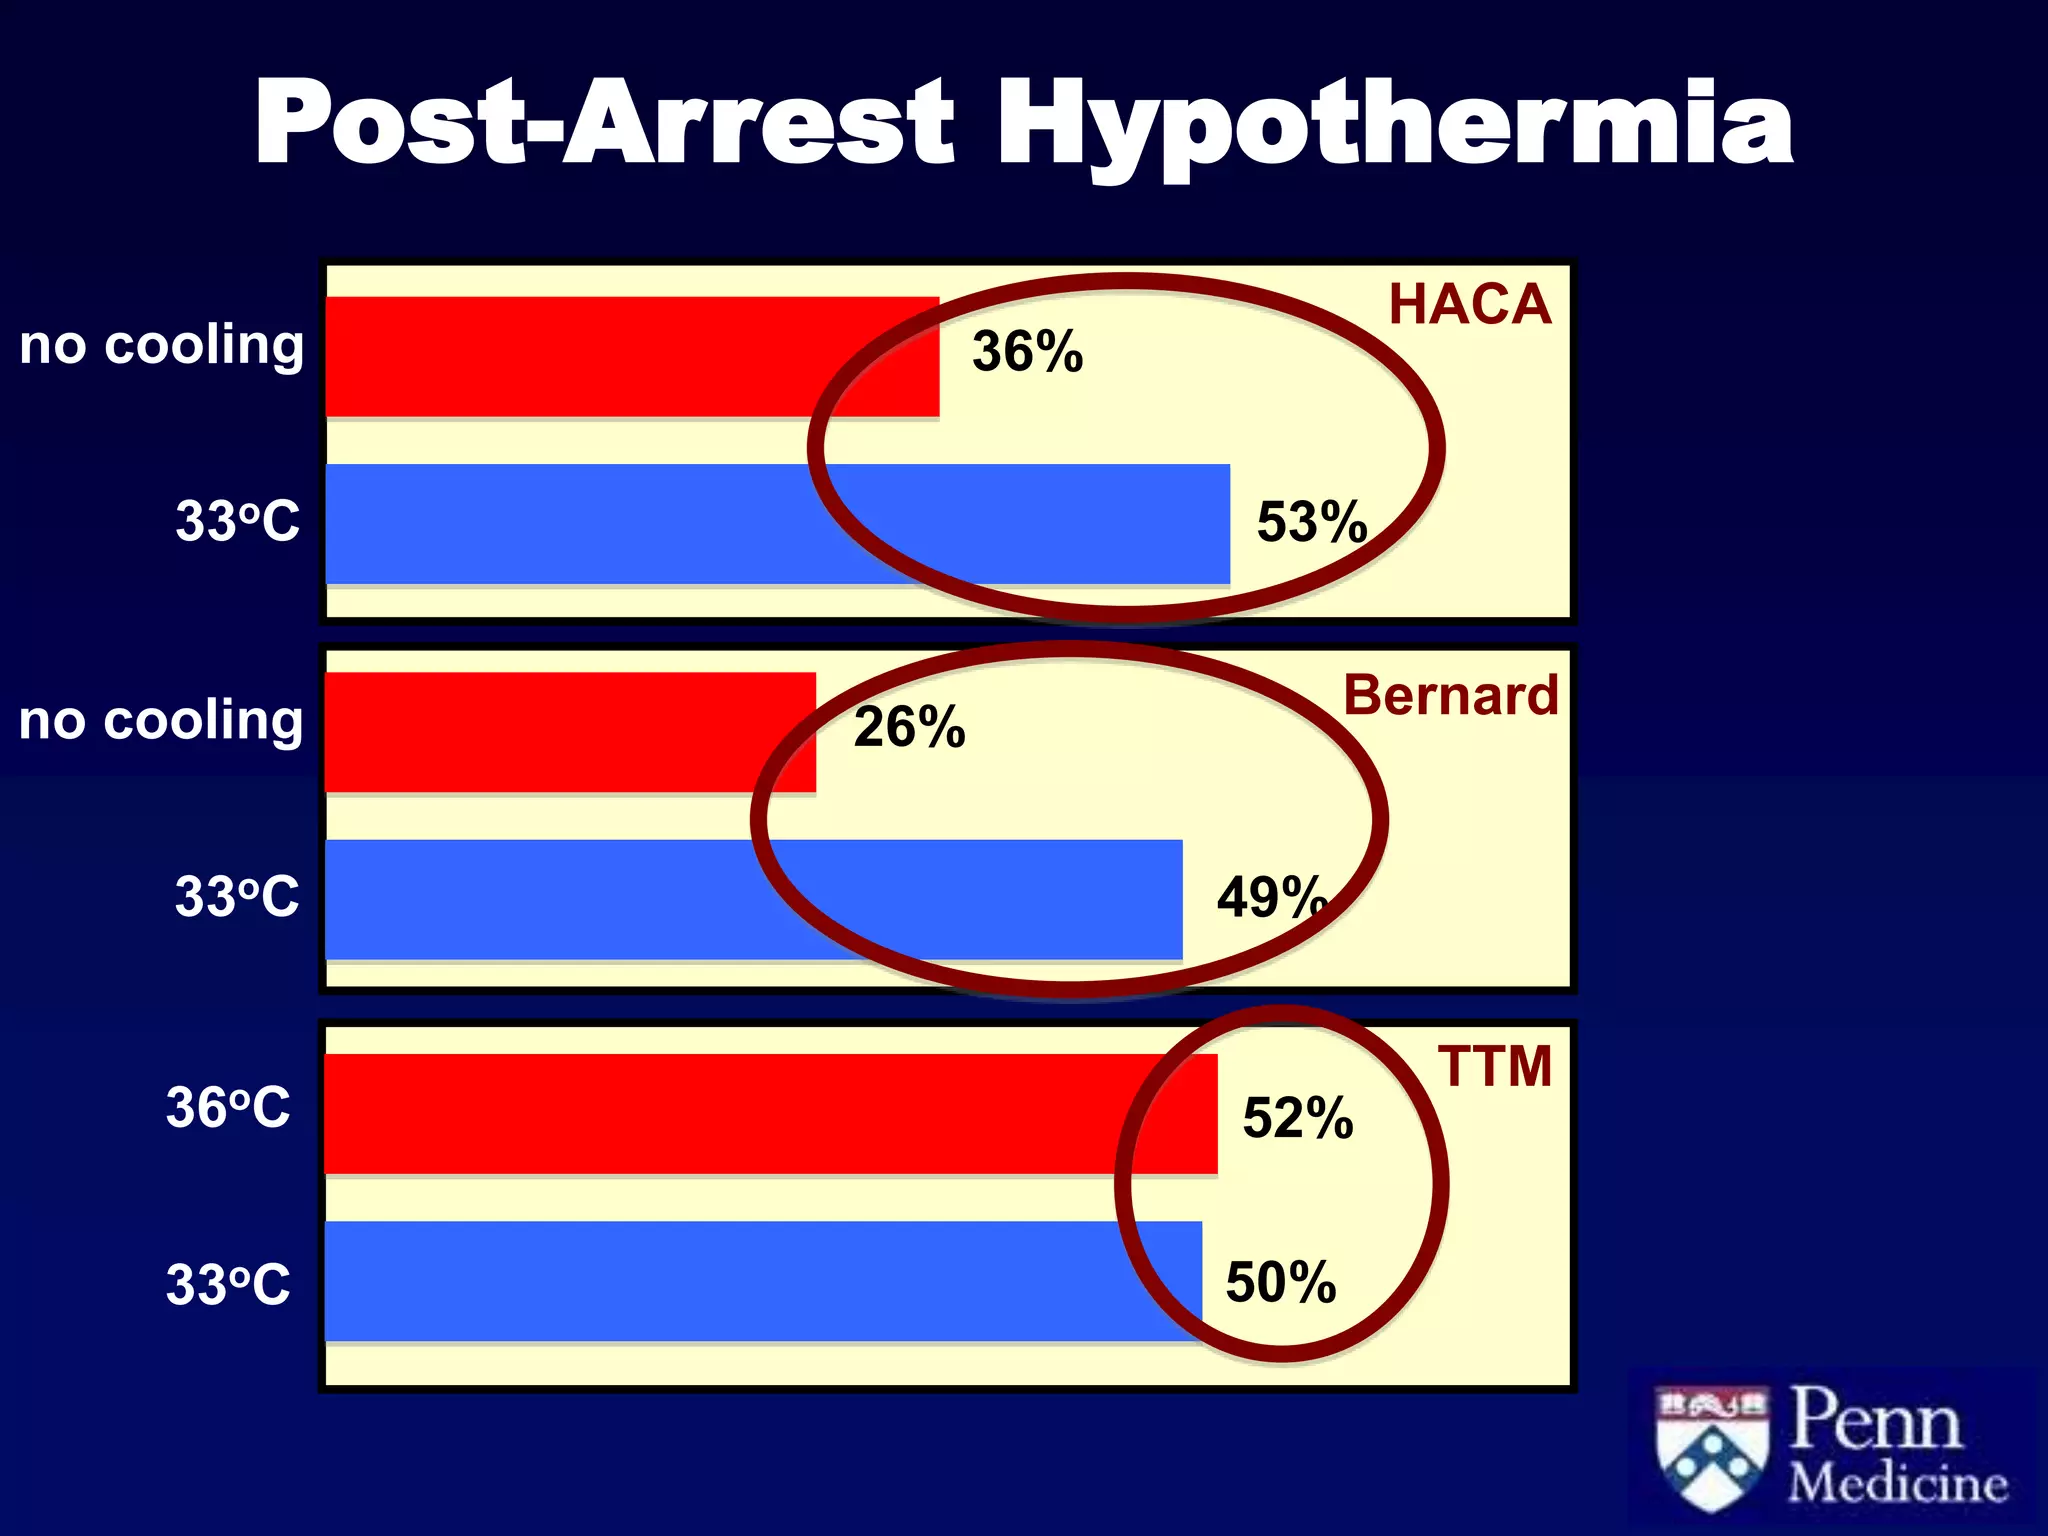
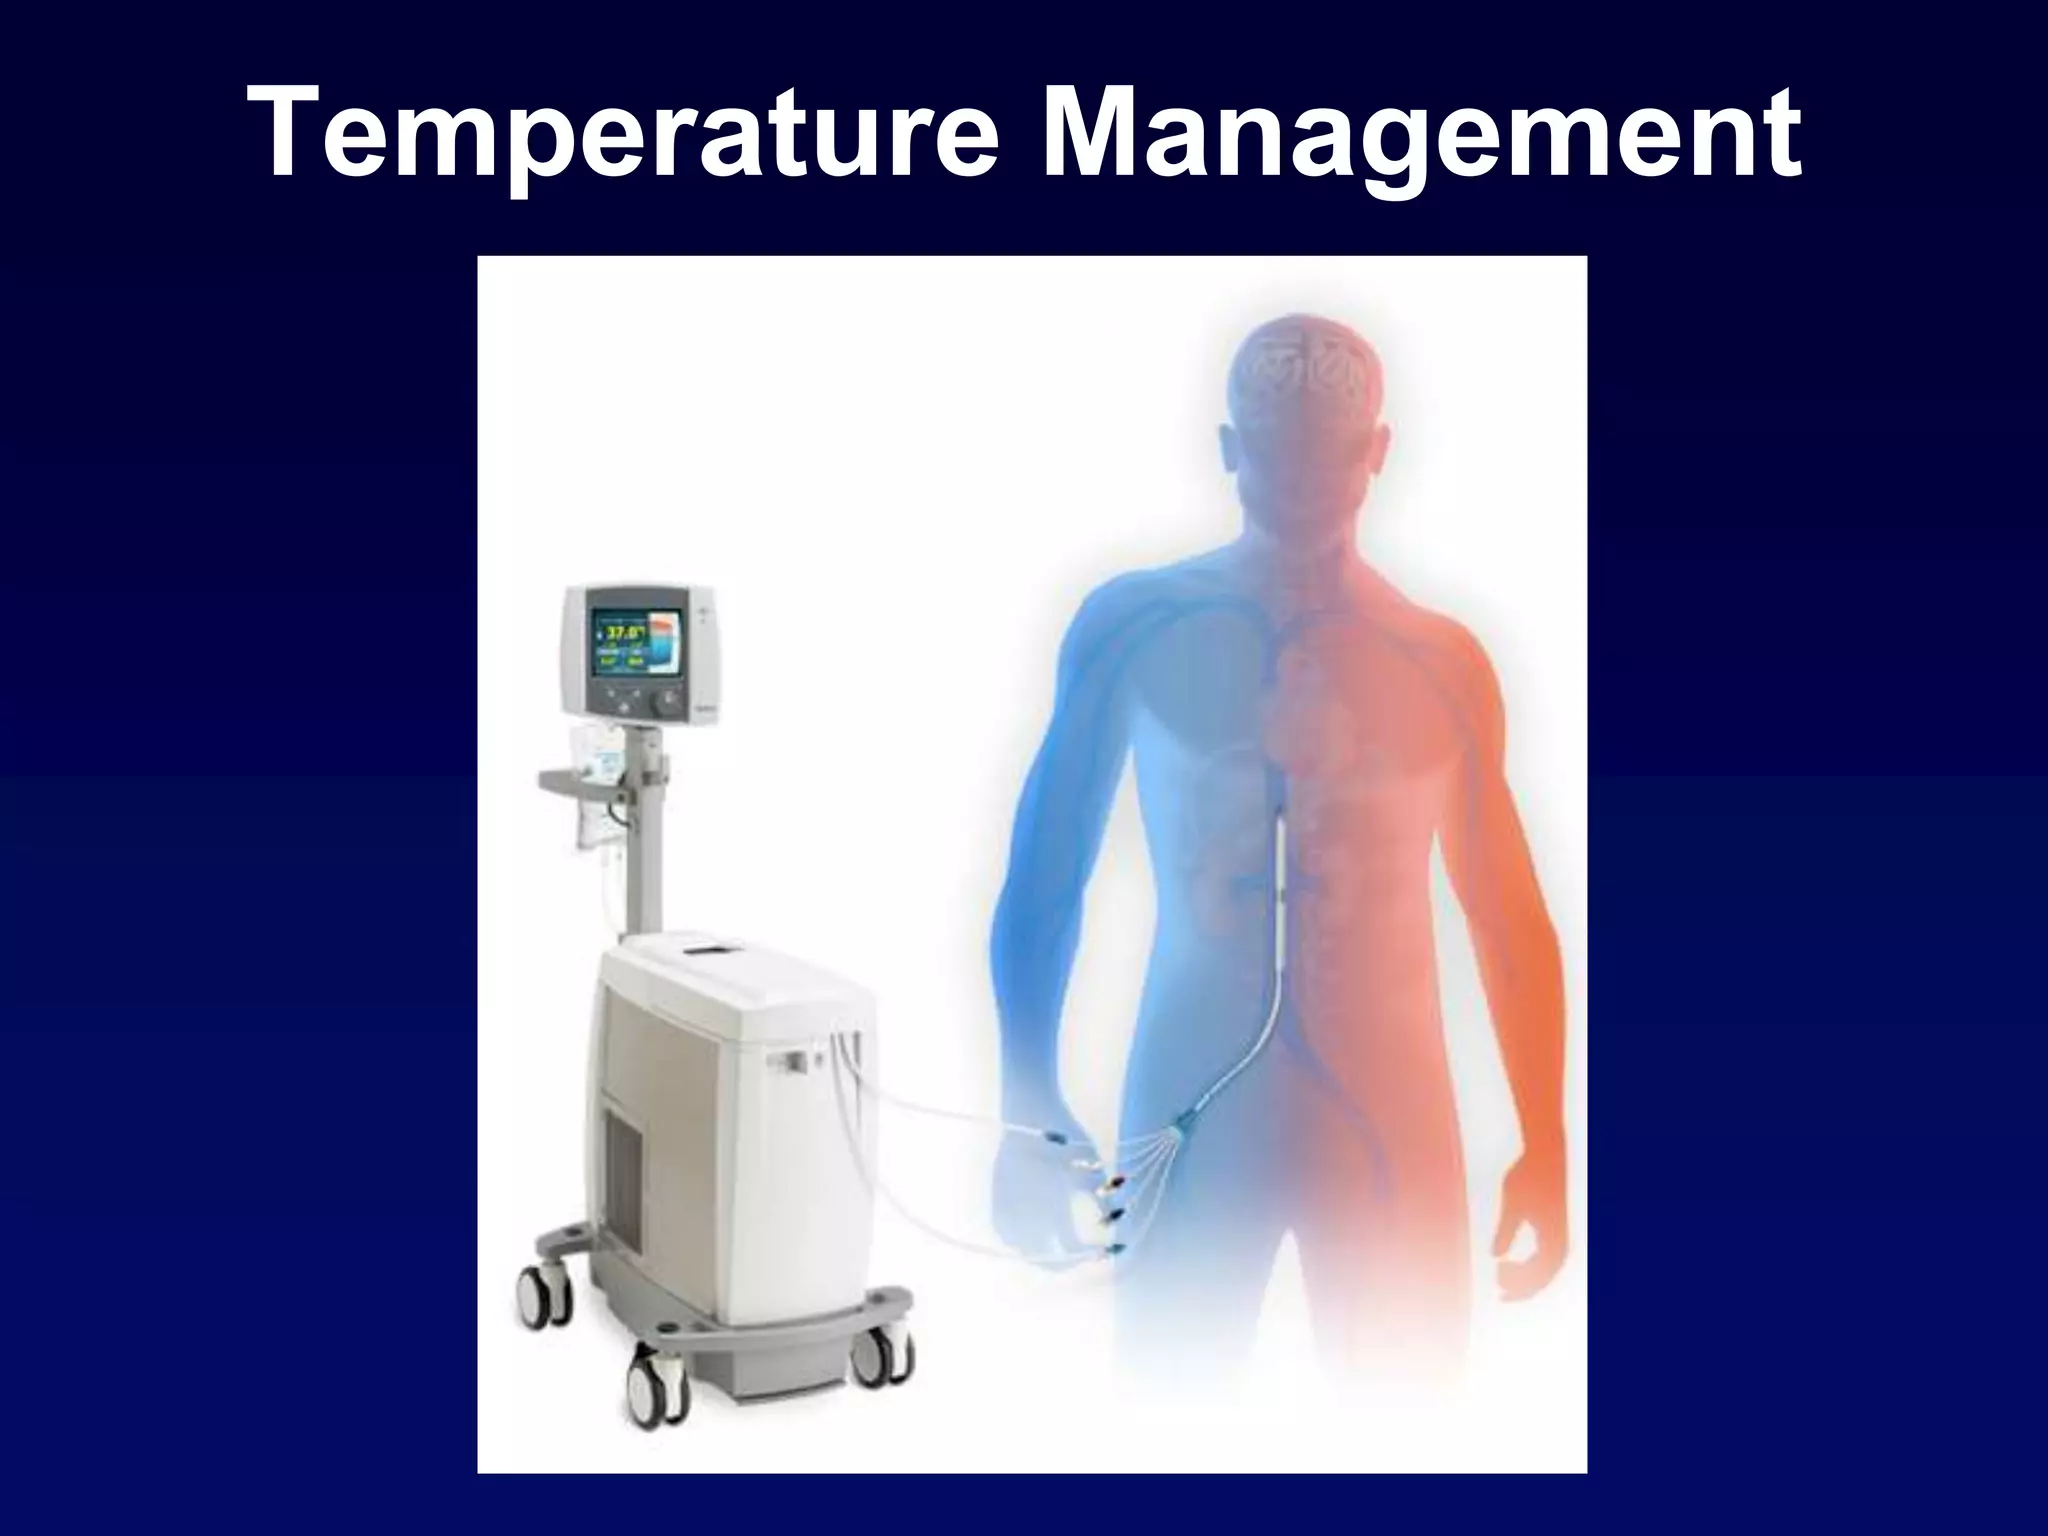
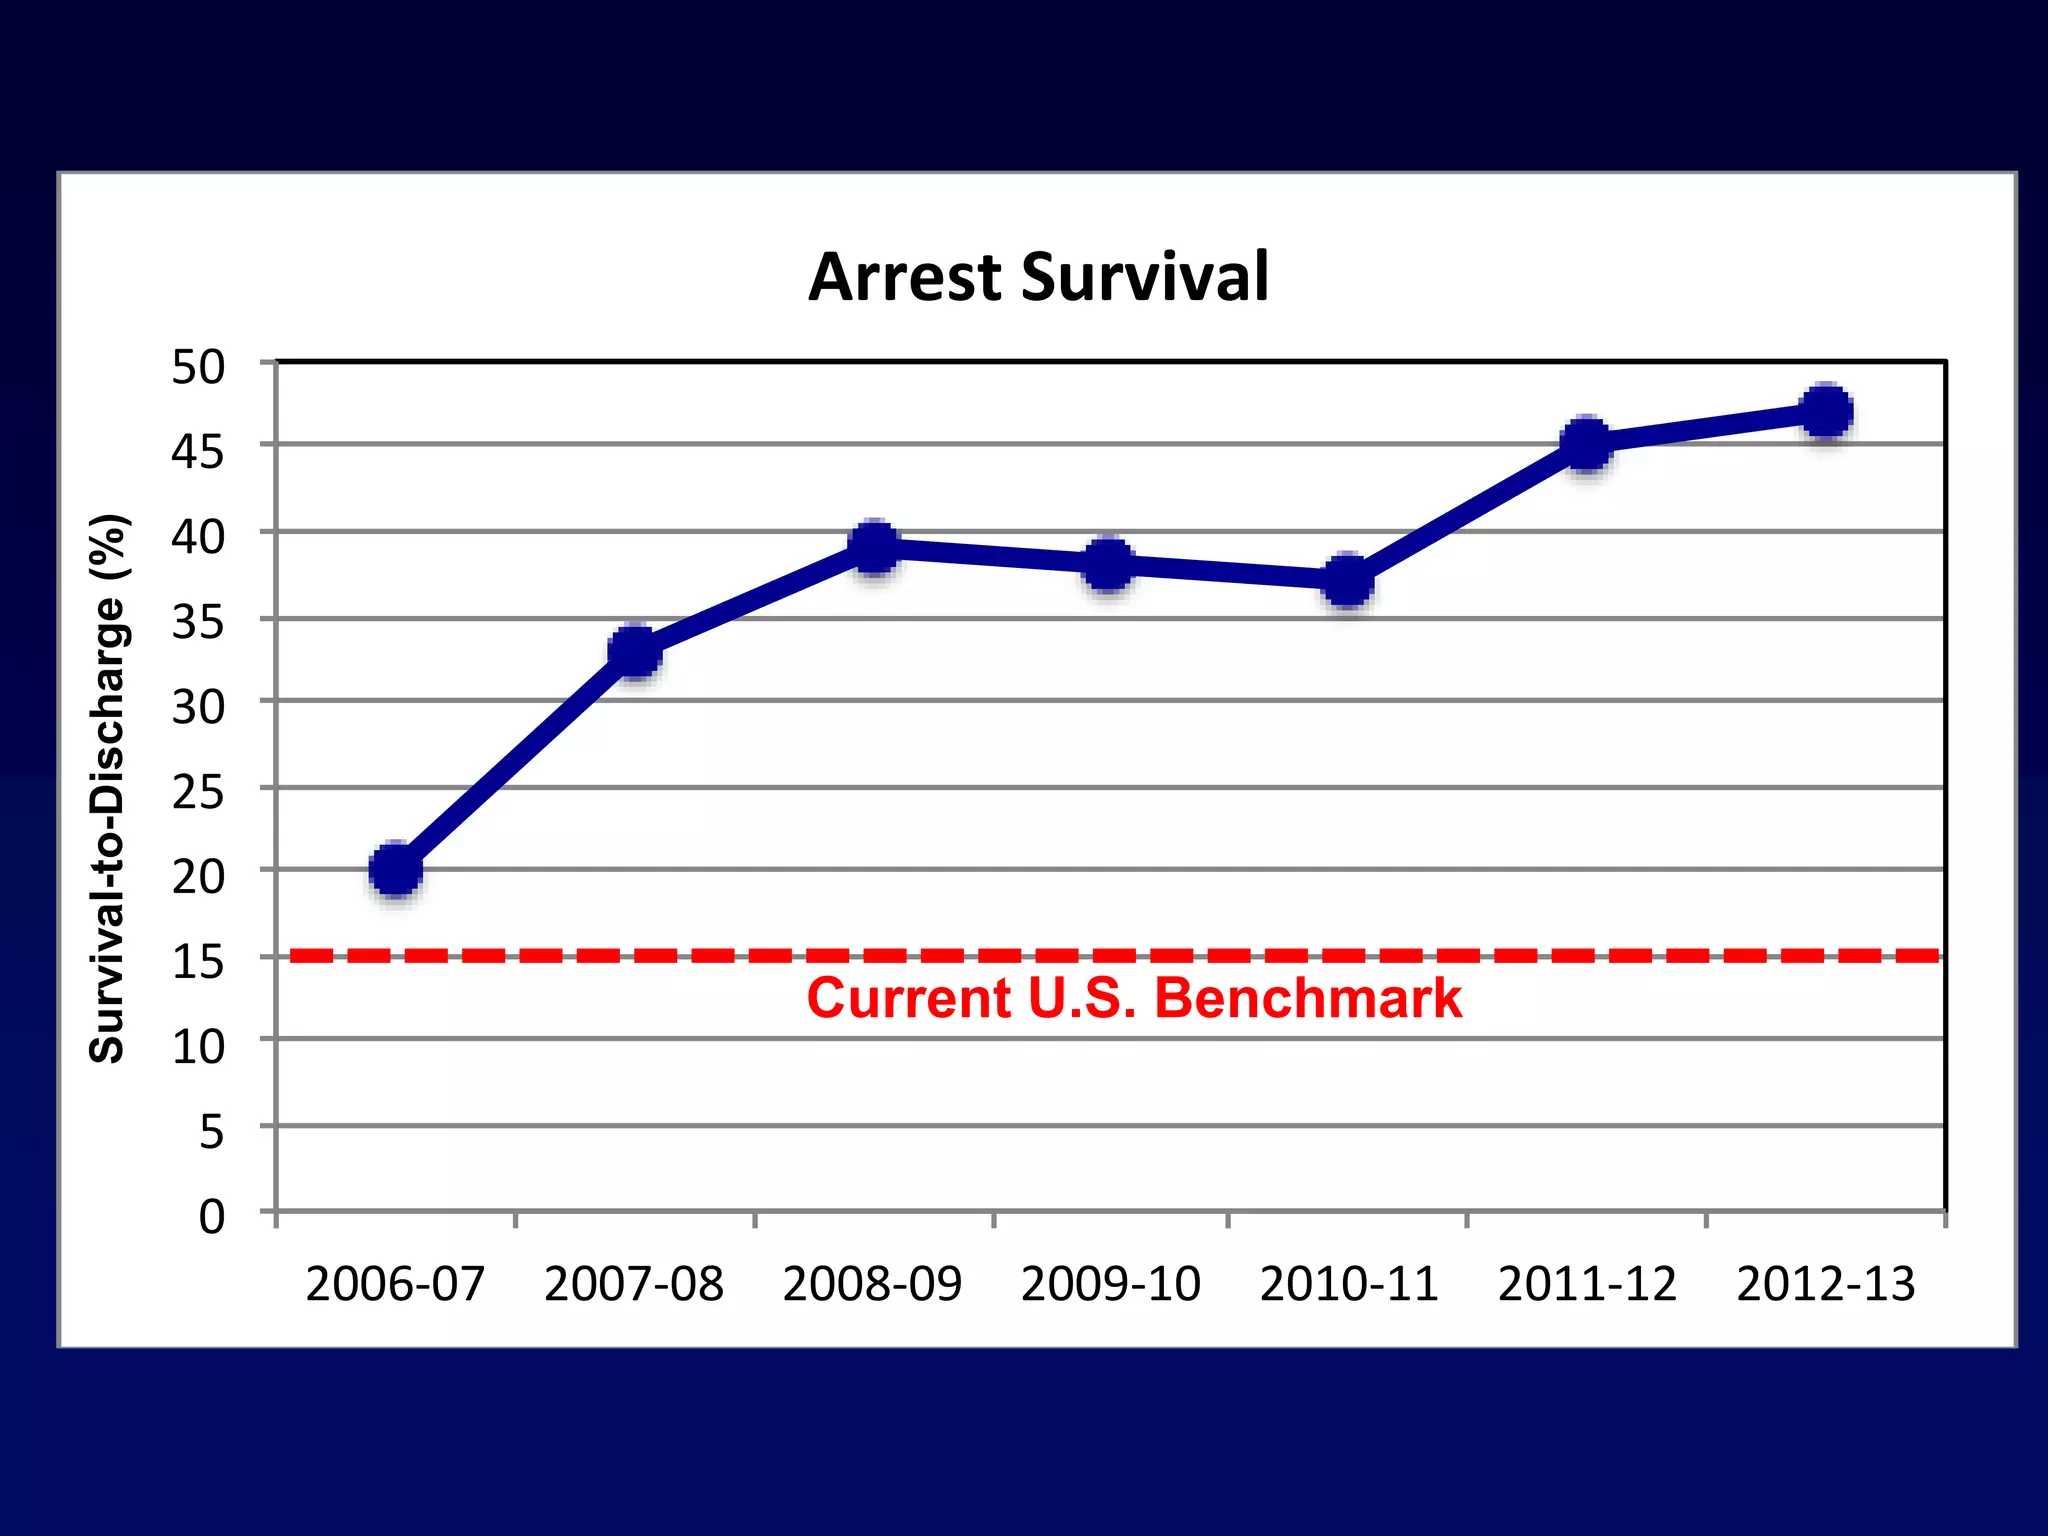
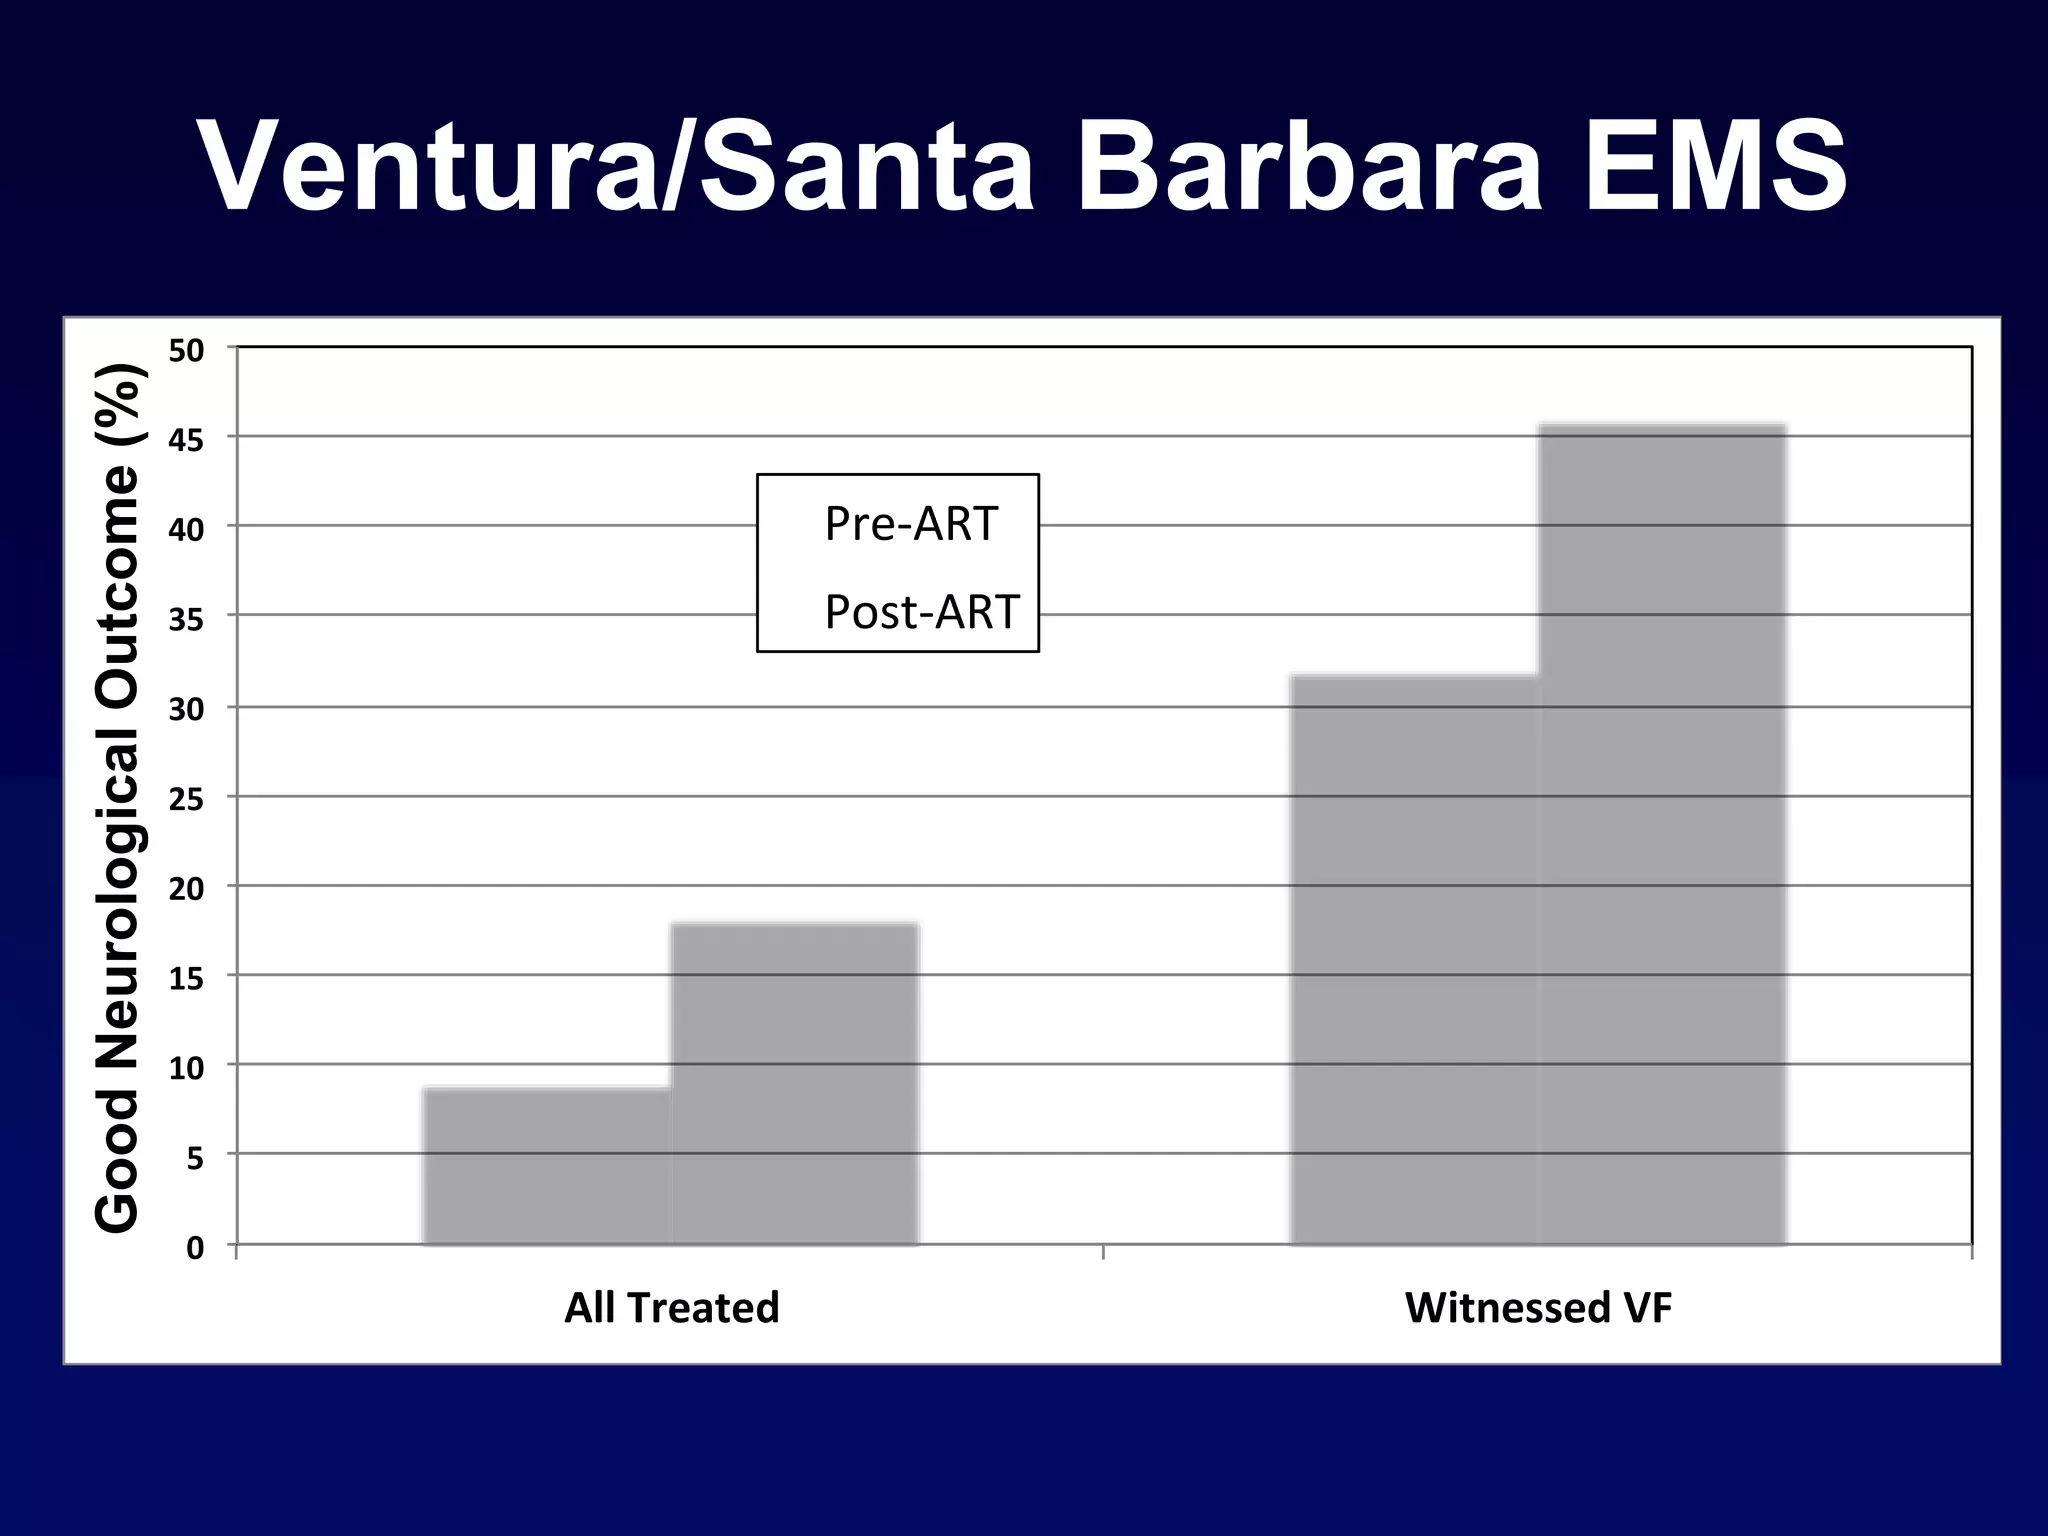
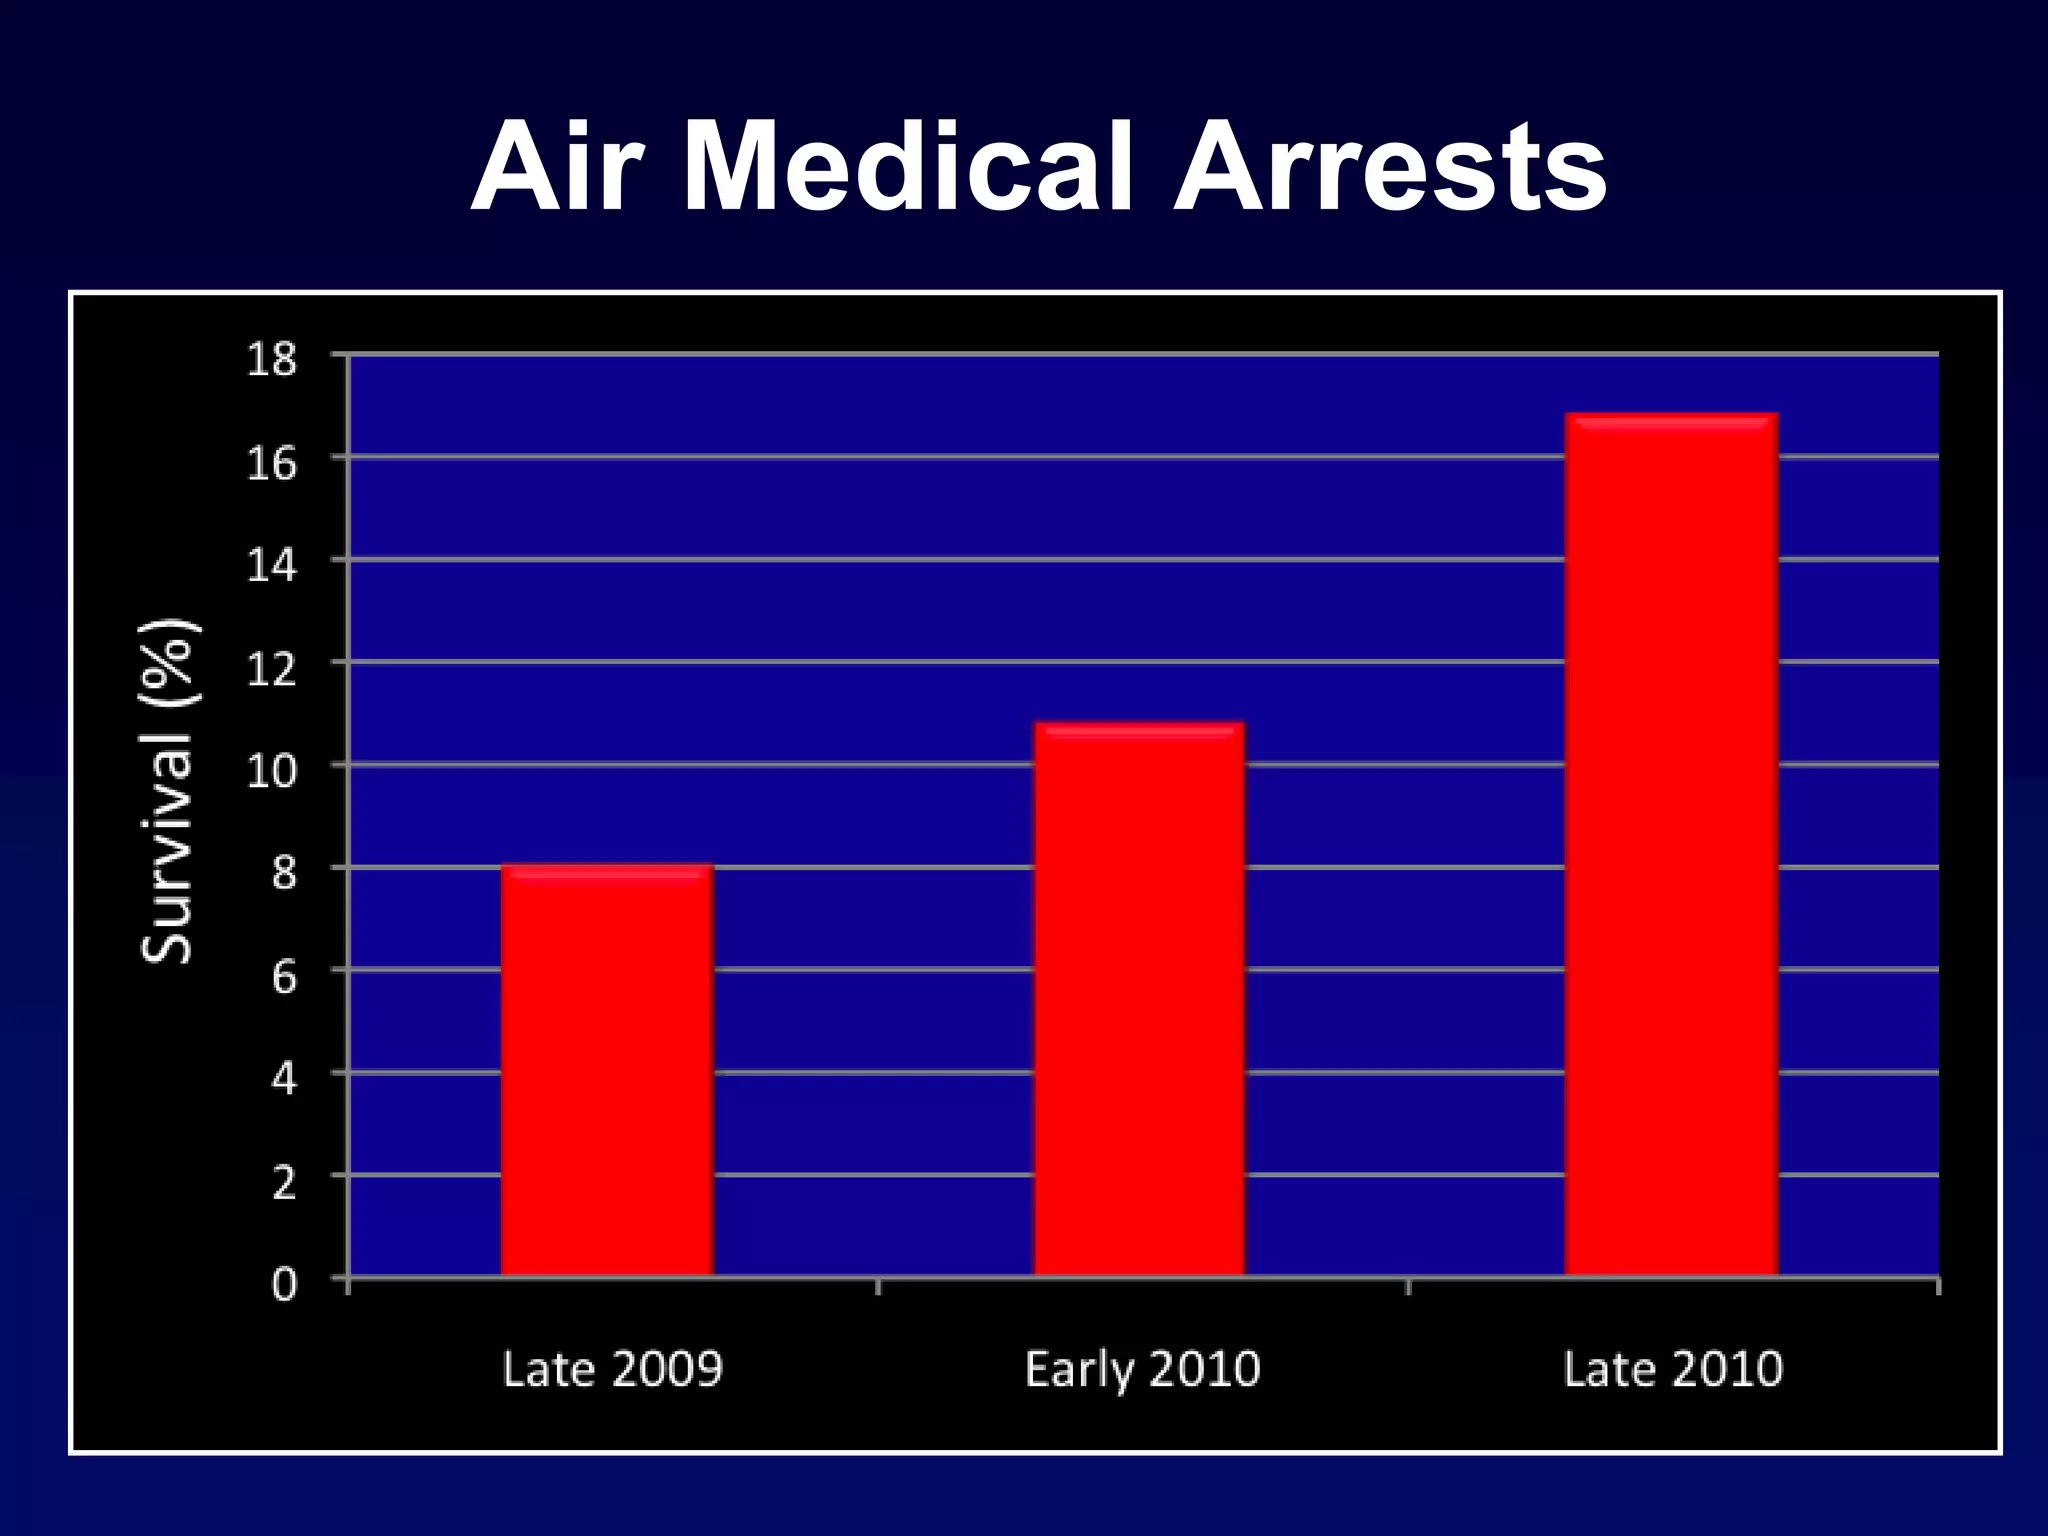
Daniel Davis, MD
UCSD Emergency Medicine
Integrating Technology
into Resuscitation
Technology
Opportunities
• Change treatment algorithms
• Real-time feedback
• Performance improvement
• Research
• Training
CQI
ADVANCED RESUSCITATION TRAINING
Training Technology
Best
Practices Scientific
Evidence
Arrest Resuscitation
The Primary Directive
Chest compressions should be performed
from the moment of arrest until return of
spontaneous circulation is assured.
Kern (2002) Circulation
Prime the Pump!
Christenson (2009) Circulation
Stay on the chest!
1
2.13 2.26
2.88
3.3
0
1
2
3
4
5
0-20 21-40 41-60 61-80 81-100
Chest Compression Fraction
AdjustedOR
* Adjusted for: age, gender, bystander CPR,
public location, response time, compression rate
Codus Interruptus
• Initiating compressions
• Rhythm analysis
• Shock sequence
• Pulse check
• Intubation
• Vascular access
Rhythm Analysis
Shock Sequence
Stiell et al (2008) AHA Scientific Sessions
Deeper Compressions
Aufderheide (2005) Resuscitation
Good Recoil
Compression Associations
• Depth  ROSC
• Depth  survival
• Rise in depth  ROSC, survival
• Compression depth/patient wt  PetCO2
• Depth/rate  inversely proportional
Perfusion Checks
0
20
40
60
80
100
120
140
0 10 20 30 40 50
Time
HeartRate(BPM)&PetCO2(mmHg)
Electrical
(HR)
Mechanical
(PetCO2)
PetCO2 Monitoring
PetCO2 Associations
• Initial PetCO2  arrest etiology
• Initial PetCO2  ROSC
• CPR depth/patient weight  PetCO2
• Pre-shock PetCO2  ROSC for VF
• Rise in PetCO2  ROSC
CPR Feedback
VF arrest in CCU
Initial rhythm
Defibrillation
EtCO2 6
Sinus rhythm
No pulse
EtCO2 16
EtCO2 25
Pause compressions
A-line 70/30
Pulse palpated
Post-Resuscitation
Hyperventilation: Three Flavors
Cerebral Perfusion During Shock
0
5
10
15
20
25
30
35
40
45
RR6 RR12 ETCO2
P = .004 v 12
P = .004 v 12
mL/100 gm/min
Capnometry
Intubated Patient
Confirm ET placement using
continuous capnography
SBP <90 mmHg SBP 90 mmHg
SBP  90 mmHg
SpO2 <90%
SBP <90 mmHg
Decrease ventilation rate
EtCO2 >45 mmHg
EtCO2 <35 mmHg
•Increase FiO2
•Check circuit
•Suction ET tube
Lung-Protective Ventilation Mode
• Volume Control (TV = 6 cc/kg)
• Ppeak = 40 cm H2O
• Ventilation rate = 12/min
• PEEP = 5 cm H2O (2 cm H2O for TBI)
Decrease FiO2 to
50%
Resuscitation Ventilation Mode
• Pressure Control (Ppeak = 40 cm H2O)
or Volume Control (TV = 12 cc/kg)
• Ventilation rate = 6/min
• No PEEP
SpO2 >97% SpO2 >97%
SpO2 <90%
Increase ventilation rate •Increase FiO2
•Check circuit
•Suction ET tube
•Increase PEEP
•Increase I time
Decrease FiO2 to
50%
Hypothermia After Cardiac Arrest Study Group (2002) NEJM
Evidence for Hypothermia
Evidence for Hypothermia?
Hypothermia After Cardiac Arrest Study Group (2002) NEJM
Hypothermia vs. Normothermia?
When should we cool?
no cooling
33oC
0 10 20 30 40 50 60
% survival
36%
53%
no cooling
33oC
26%
49%
36oC
33oC
52%
50%
Post-Arrest Hypothermia
HACA
Bernard
TTM
Temperature Management
Outcomes
0
5
10
15
20
25
30
35
40
45
50
2006-07 2007-08 2008-09 2009-10 2010-11 2011-12 2012-13
Arrest Survival
Survival-to-Discharge(%)
Current U.S. Benchmark
Ventura/Santa Barbara EMS
0
5
10
15
20
25
30
35
40
45
50
All Treated Witnessed VF
Pre-ART
Post-ART
GoodNeurologicalOutcome(%)
Air Medical Arrests
SEMS 2014: Dan Davis - Using technology in resus

SEMS 2014: Dan Davis - Using technology in resus