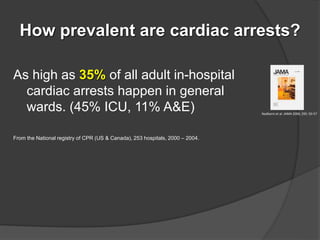
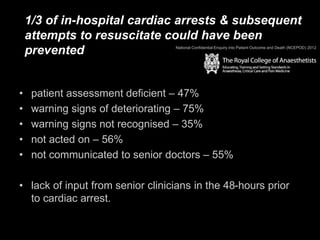
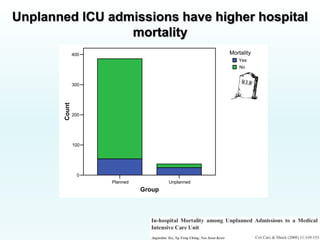
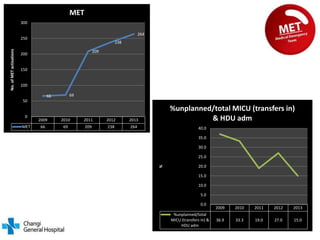
How prevalent are cardiac arrests?
As high as 35% of all adult in-hospital
cardiac arrests happen in general
wards. (45% ICU, 11% A&E)
From the National registry of CPR (US & Canada), 253 hospitals, 2000 – 2004.
Nadkarni et al. JAMA 2006; 295: 50-57
1/3 of in-hospital cardiac arrests & subsequent
attempts to resuscitate could have been
prevented
• patient assessment deficient – 47%
• warning signs of deteriorating – 75%
• warning signs not recognised – 35%
• not acted on – 56%
• not communicated to senior doctors – 55%
• lack of input from senior clinicians in the 48-hours prior
to cardiac arrest.
National Confidential Enquiry into Patient Outcome and Death (NCEPOD) 2012
Unplanned ICU admissions have higher hospital
mortality
Planned Unplanned
Group
0
100
200
300
400
Count
Mortality
Yes
No
2009 2010 2011 2012 2013
%unplanned/total
MICU (transfers in) &
HDU adm
36.9 33.3 19.0 27.0 15.0
0.0
5.0
10.0
15.0
20.0
25.0
30.0
35.0
40.0
%
%unplanned/total MICU (transfers in)
& HDU adm2009 2010 2011 2012 2013
MET 66 69 209 238 264
66 69
209
238
264
0
50
100
150
200
250
300
No.ofMETactivations MET
SEMS 2014: Augustine Tee - Inpatient Medical Emergency Teams

SEMS 2014: Augustine Tee - Inpatient Medical Emergency Teams

  • 2.
    How prevalent arecardiac arrests? As high as 35% of all adult in-hospital cardiac arrests happen in general wards. (45% ICU, 11% A&E) From the National registry of CPR (US & Canada), 253 hospitals, 2000 – 2004. Nadkarni et al. JAMA 2006; 295: 50-57
  • 3.
    1/3 of in-hospitalcardiac arrests & subsequent attempts to resuscitate could have been prevented • patient assessment deficient – 47% • warning signs of deteriorating – 75% • warning signs not recognised – 35% • not acted on – 56% • not communicated to senior doctors – 55% • lack of input from senior clinicians in the 48-hours prior to cardiac arrest. National Confidential Enquiry into Patient Outcome and Death (NCEPOD) 2012
  • 5.
    Unplanned ICU admissionshave higher hospital mortality Planned Unplanned Group 0 100 200 300 400 Count Mortality Yes No
  • 10.
    2009 2010 20112012 2013 %unplanned/total MICU (transfers in) & HDU adm 36.9 33.3 19.0 27.0 15.0 0.0 5.0 10.0 15.0 20.0 25.0 30.0 35.0 40.0 % %unplanned/total MICU (transfers in) & HDU adm2009 2010 2011 2012 2013 MET 66 69 209 238 264 66 69 209 238 264 0 50 100 150 200 250 300 No.ofMETactivations MET

Editor's Notes

  • #2 story Origin of MET Eg of early intervention – STEMI, cva, trauma golden hr, egdt Inpatient code blue Types of failure Types of RRS Structure of RRS Merit study & evidence MEWS? CGH experience Video? The future: nurse-led RRT Closing story