This document provides an overview of sociometry, which is a method for measuring social relationships. Some key points:
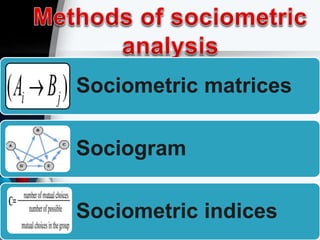
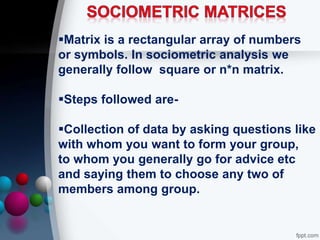
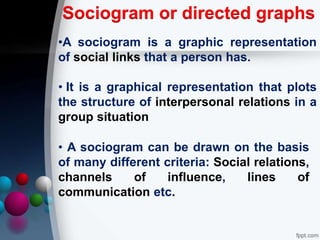
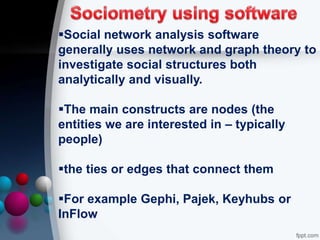
- Sociometry relates to measuring social choices and relationships in groups through tools like sociometric matrices, sociograms, and sociometric indices.
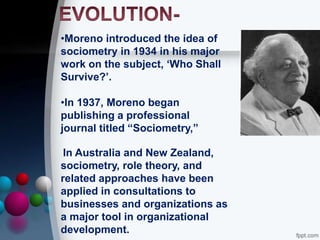
- Jacob Moreno introduced the concept of sociometry in 1934 to describe, discover, and evaluate social status and structure through measuring acceptance and rejection between individuals.
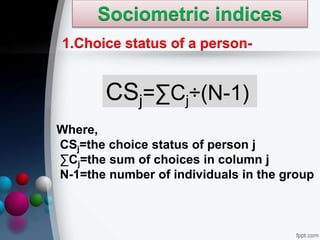
- Sociometric tools can be used to identify stars, isolates, cliques, and measure things like choice status, group cohesion, and leadership patterns within a group.
- Studies have shown sociometric measures can predict performance and behaviors like productivity and leadership. It provides validity for identifying opinion leaders


![Social Network Analysis [1994]](https://cdn.slidesharecdn.com/ss_thumbnails/socialnetworkanalysis1994-160617072245-thumbnail.jpg?width=640&height=640&fit=bounds)


