Download to read offline


Social network analysis examines the connections between individuals, groups, organizations, or other social entities. It focuses on interactions rather than individual behavior. Network analysis can be applied across many disciplines to study how the structure of relationships influences functioning. Early research in fields like sociology, anthropology, and educational psychology helped develop concepts still used today, such as examining homophily and interaction patterns. Key concepts in network analysis include nodes, edges, degree, clustering coefficients, and graph diameter. "Small world" networks are highly clustered with short path lengths, characteristics seen in many real-world networks. Social capital research also examines how network connections impact groups, organizations, and individuals.
Overview of social network analysis, its focus on interactions, and applicability across various disciplines.
History of social network analysis including key figures like Durkheim, Simmel, and Moreno, with early empirical studies in psychology.
Early studies highlighting the influence of environment on social behavior, exemplified by Newcomb's findings at Bennington College.
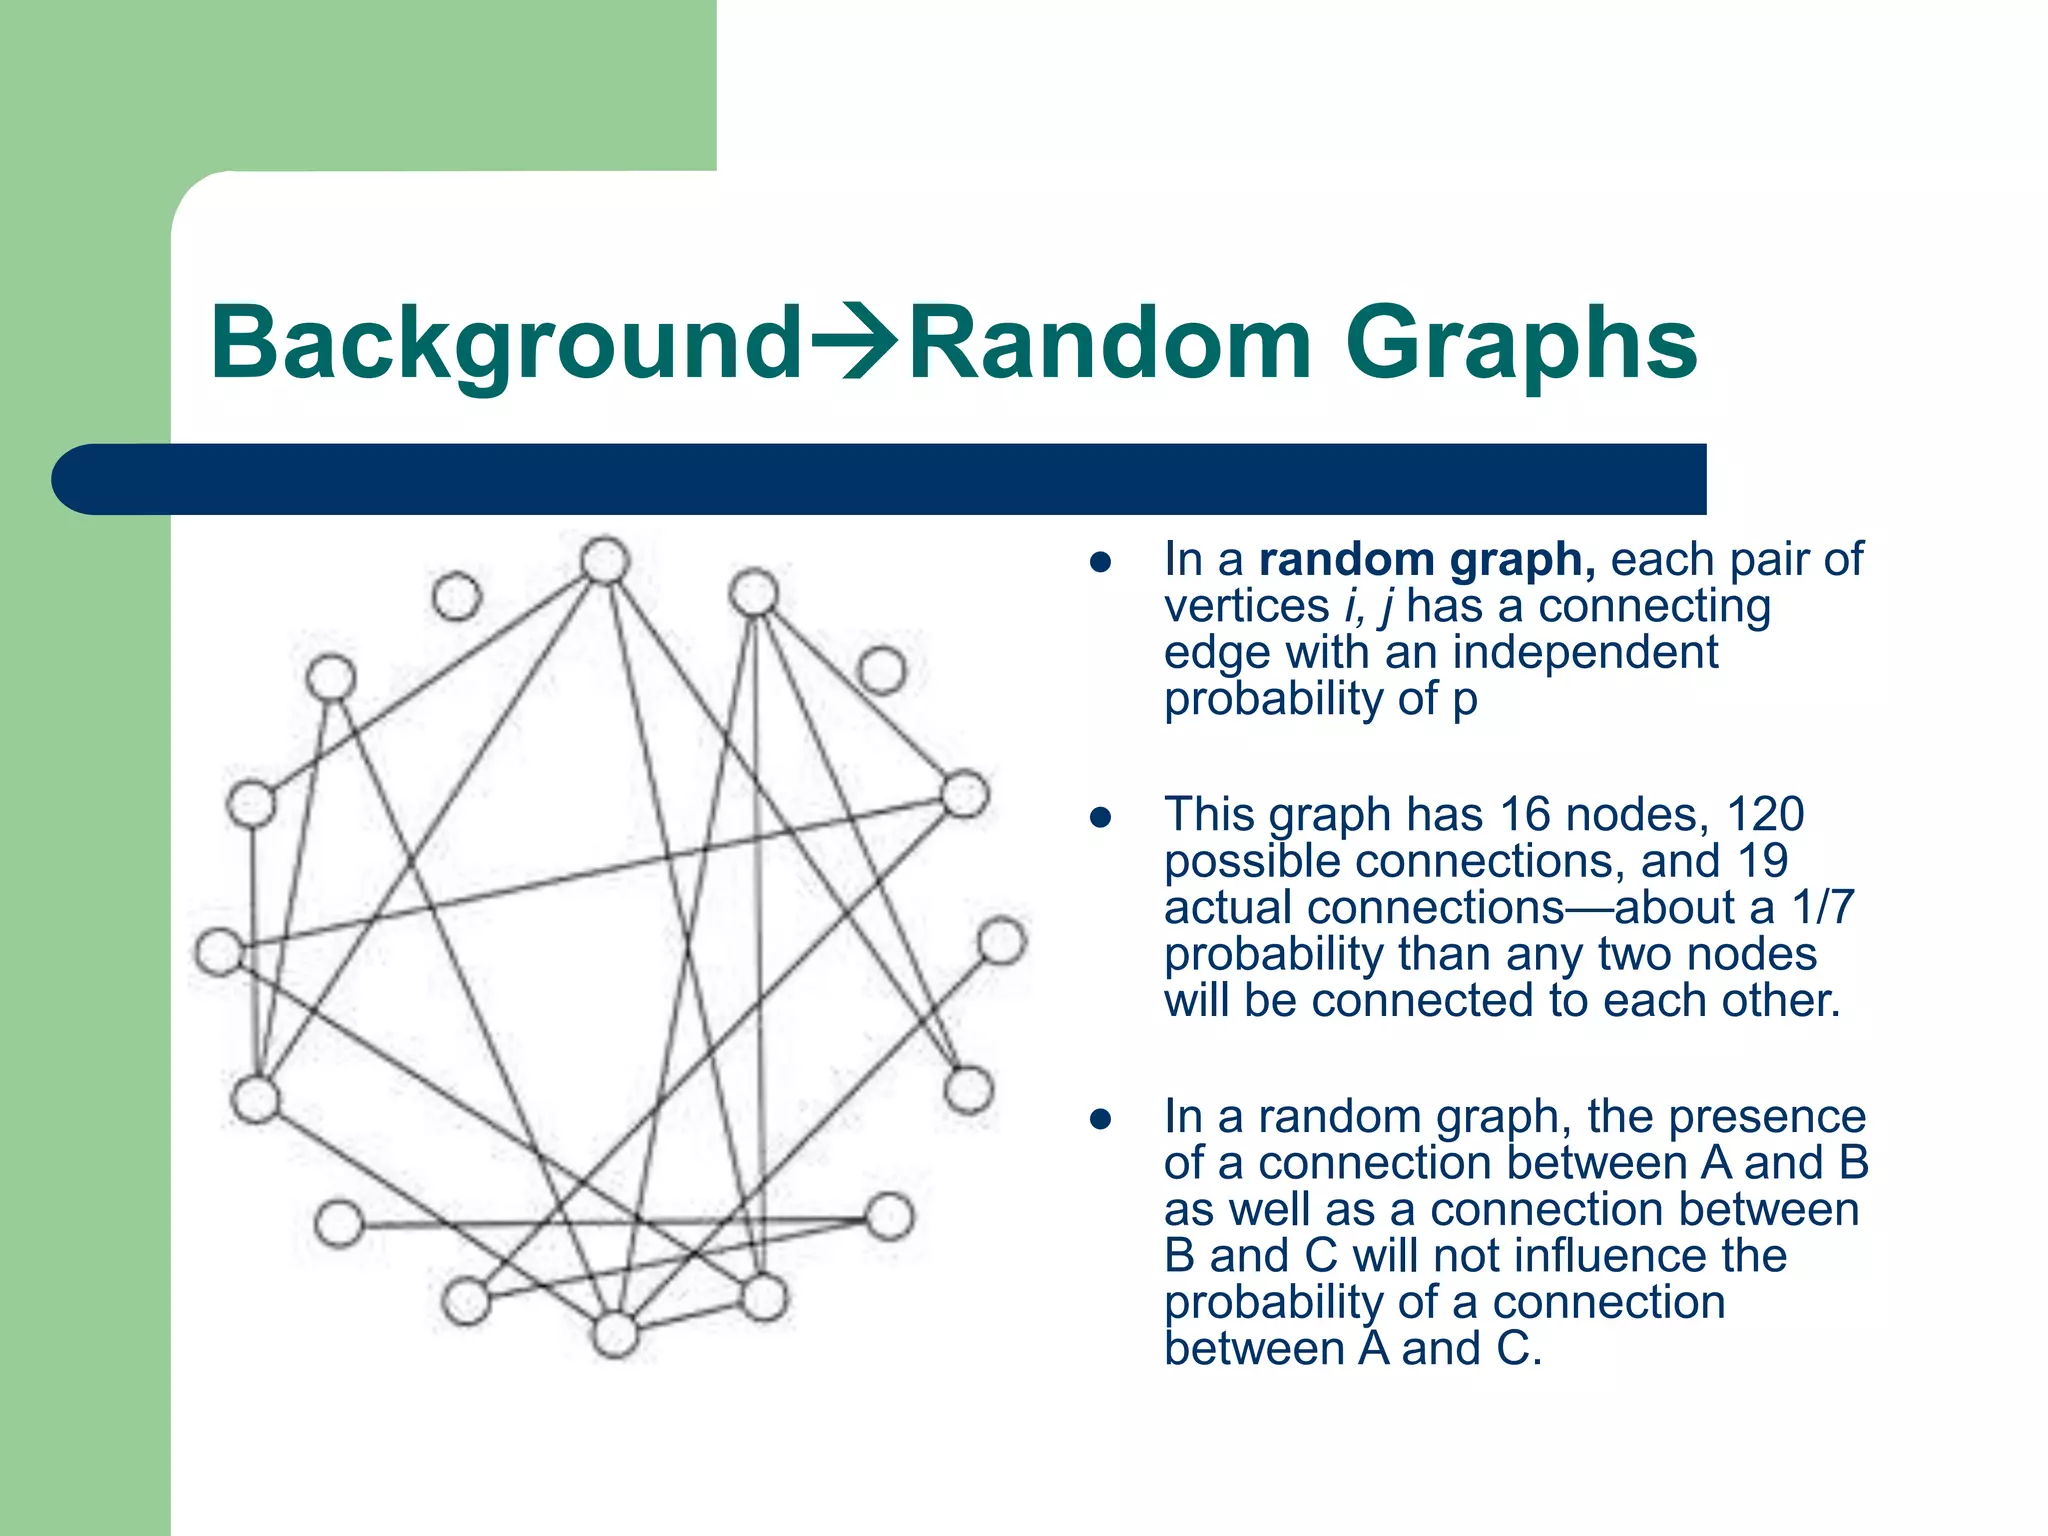
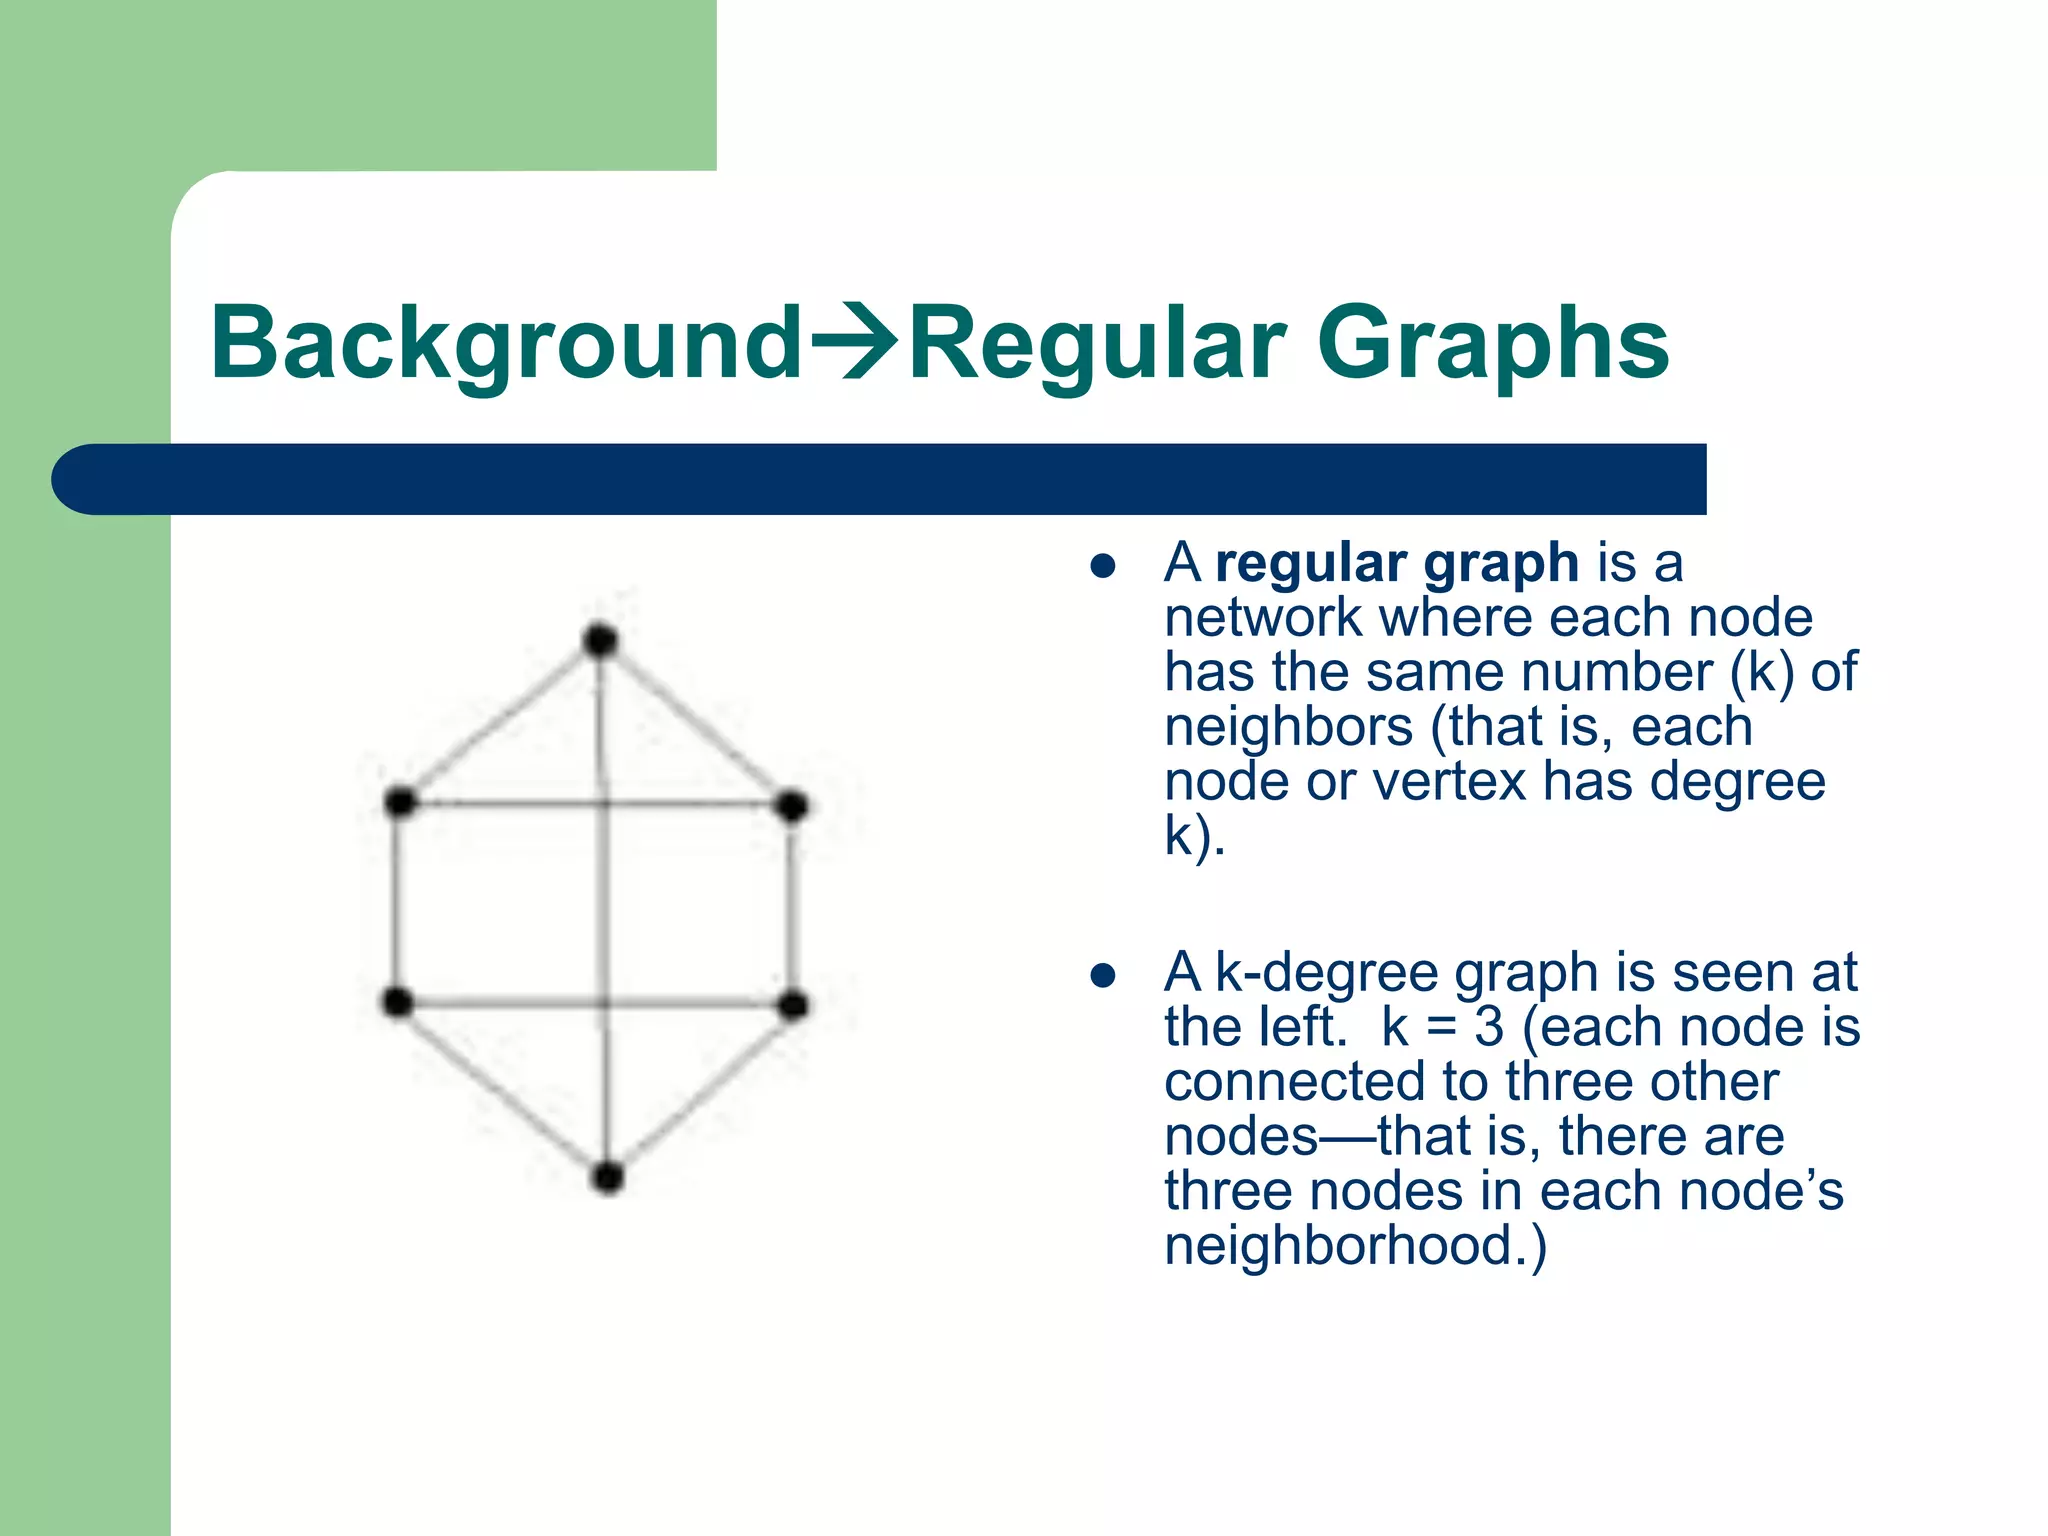
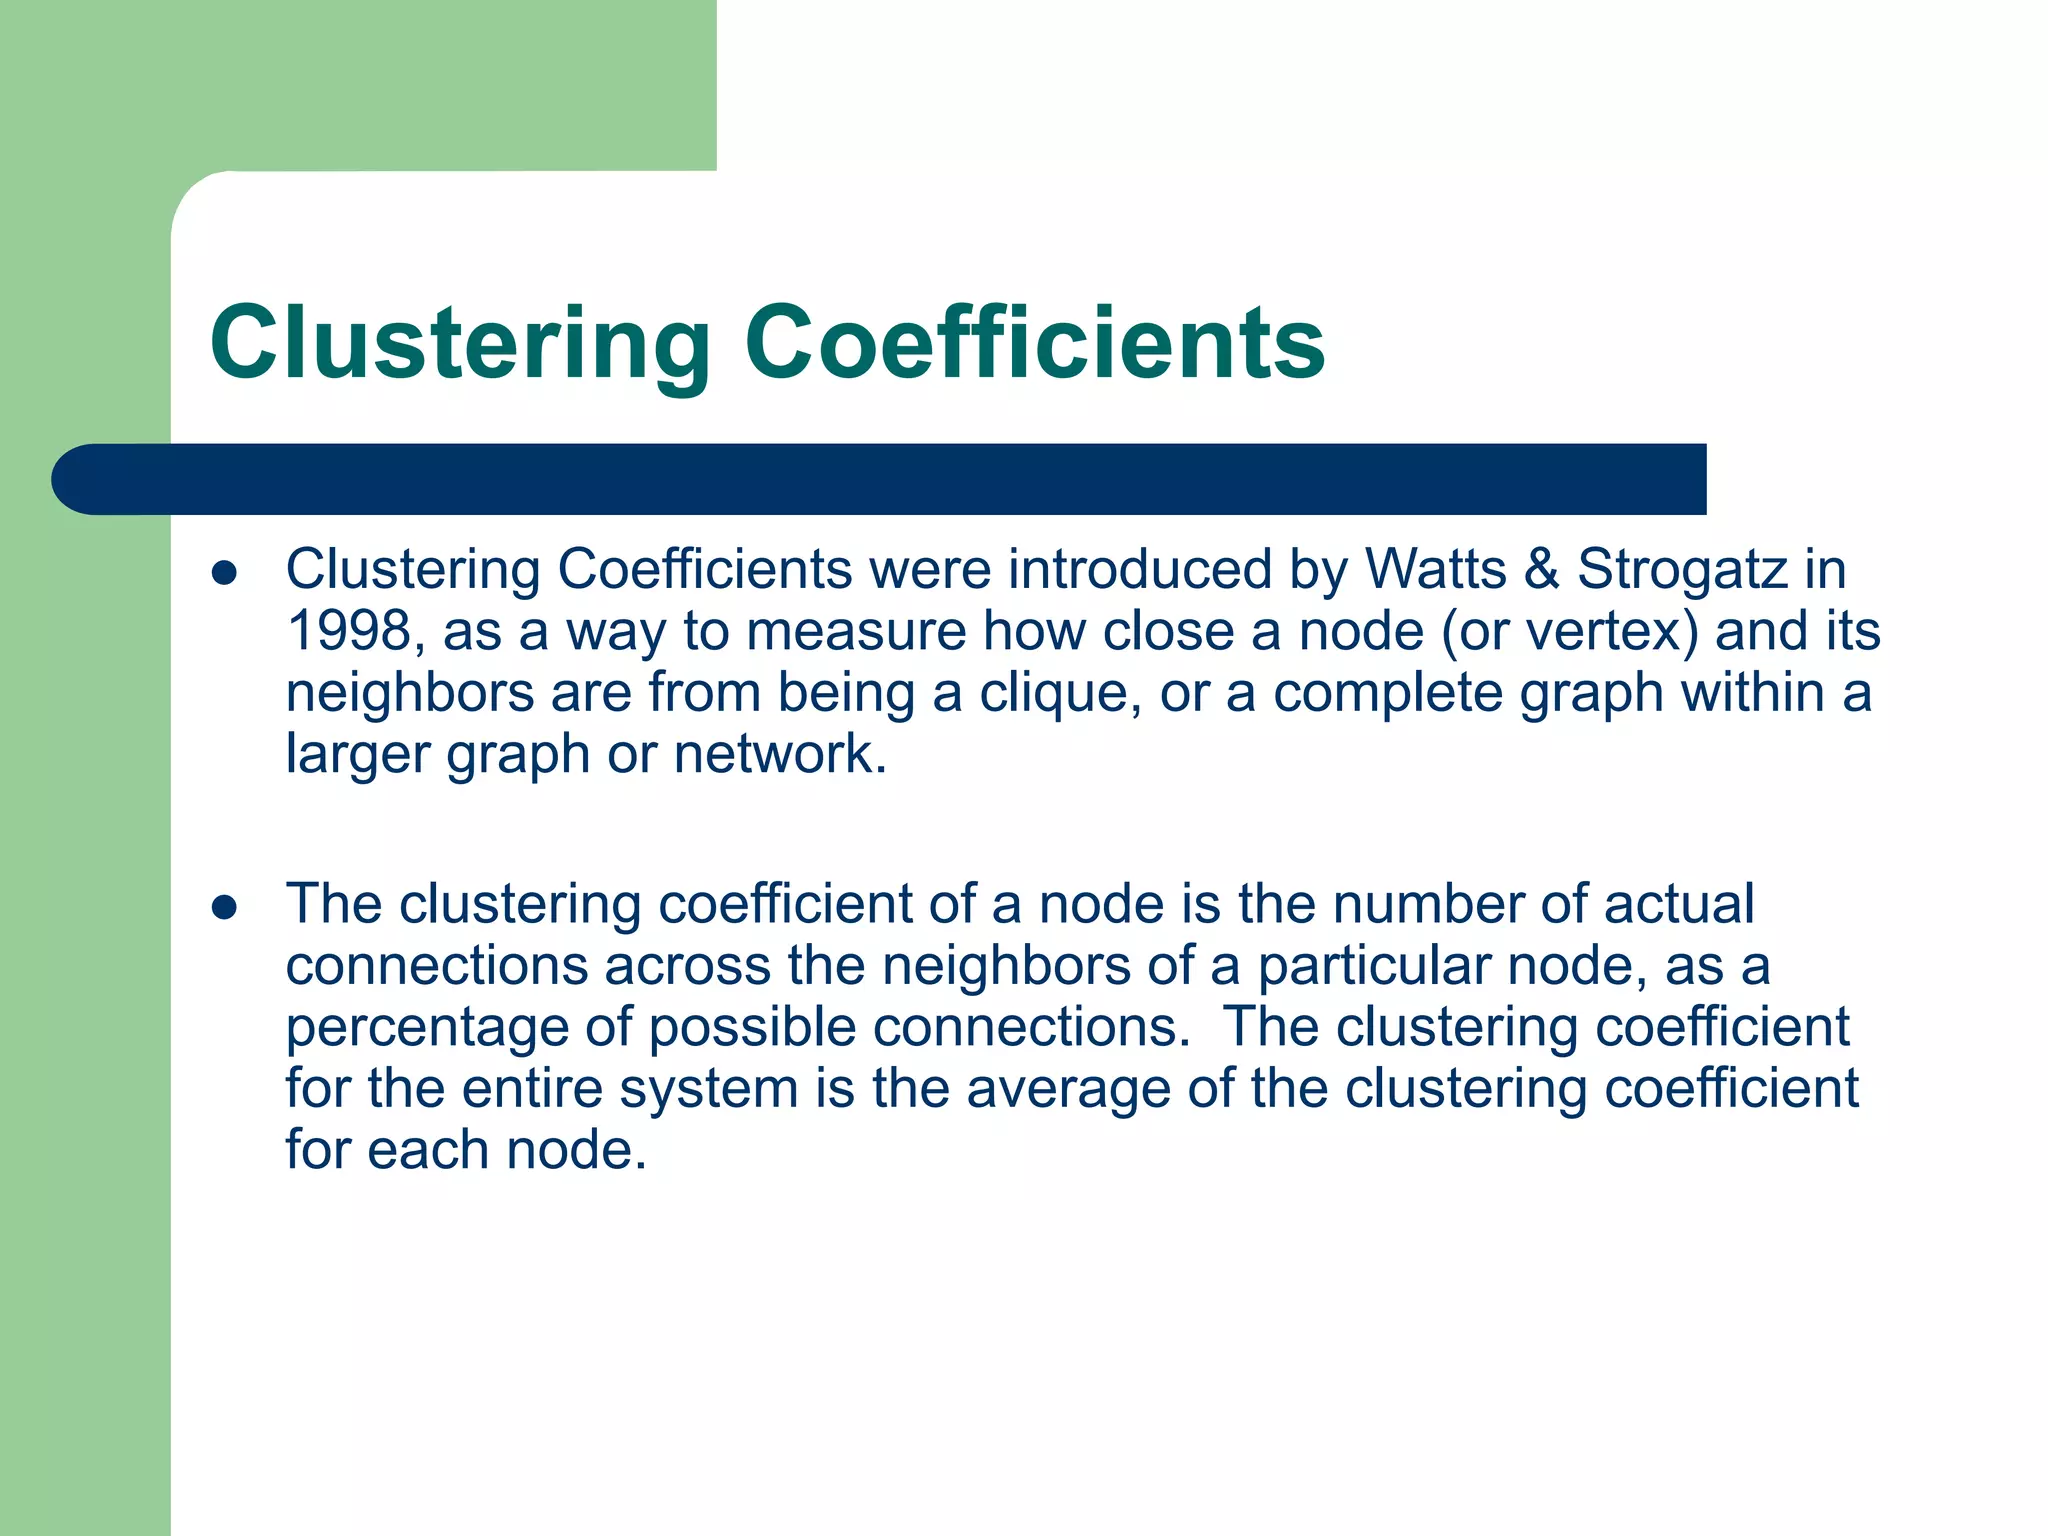
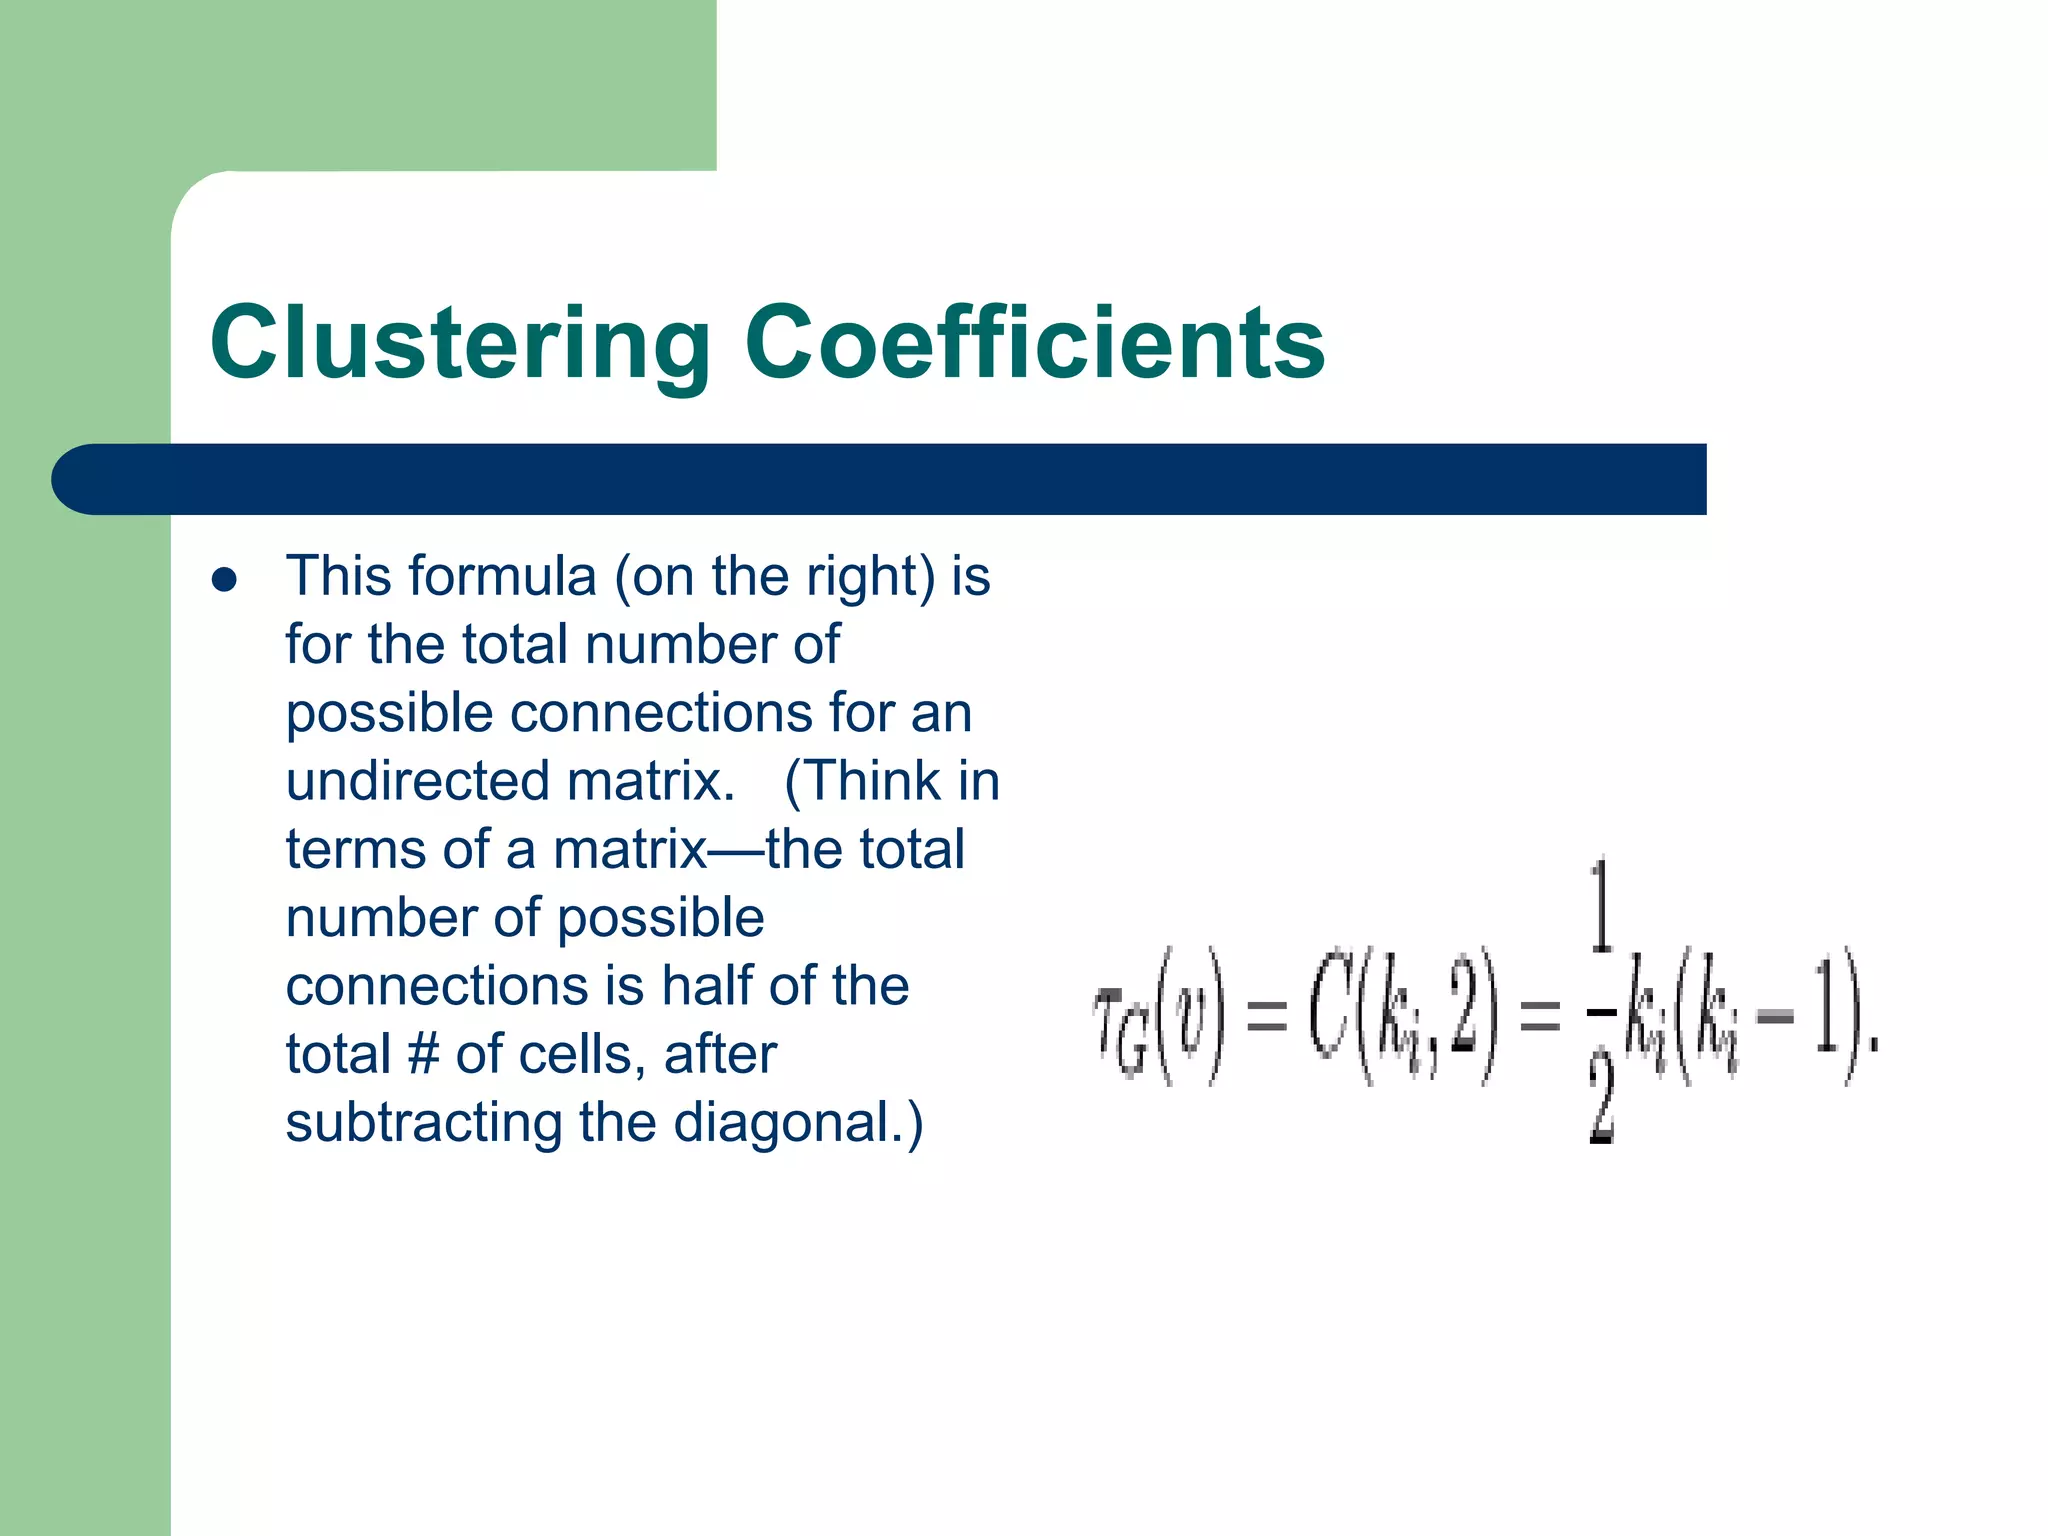
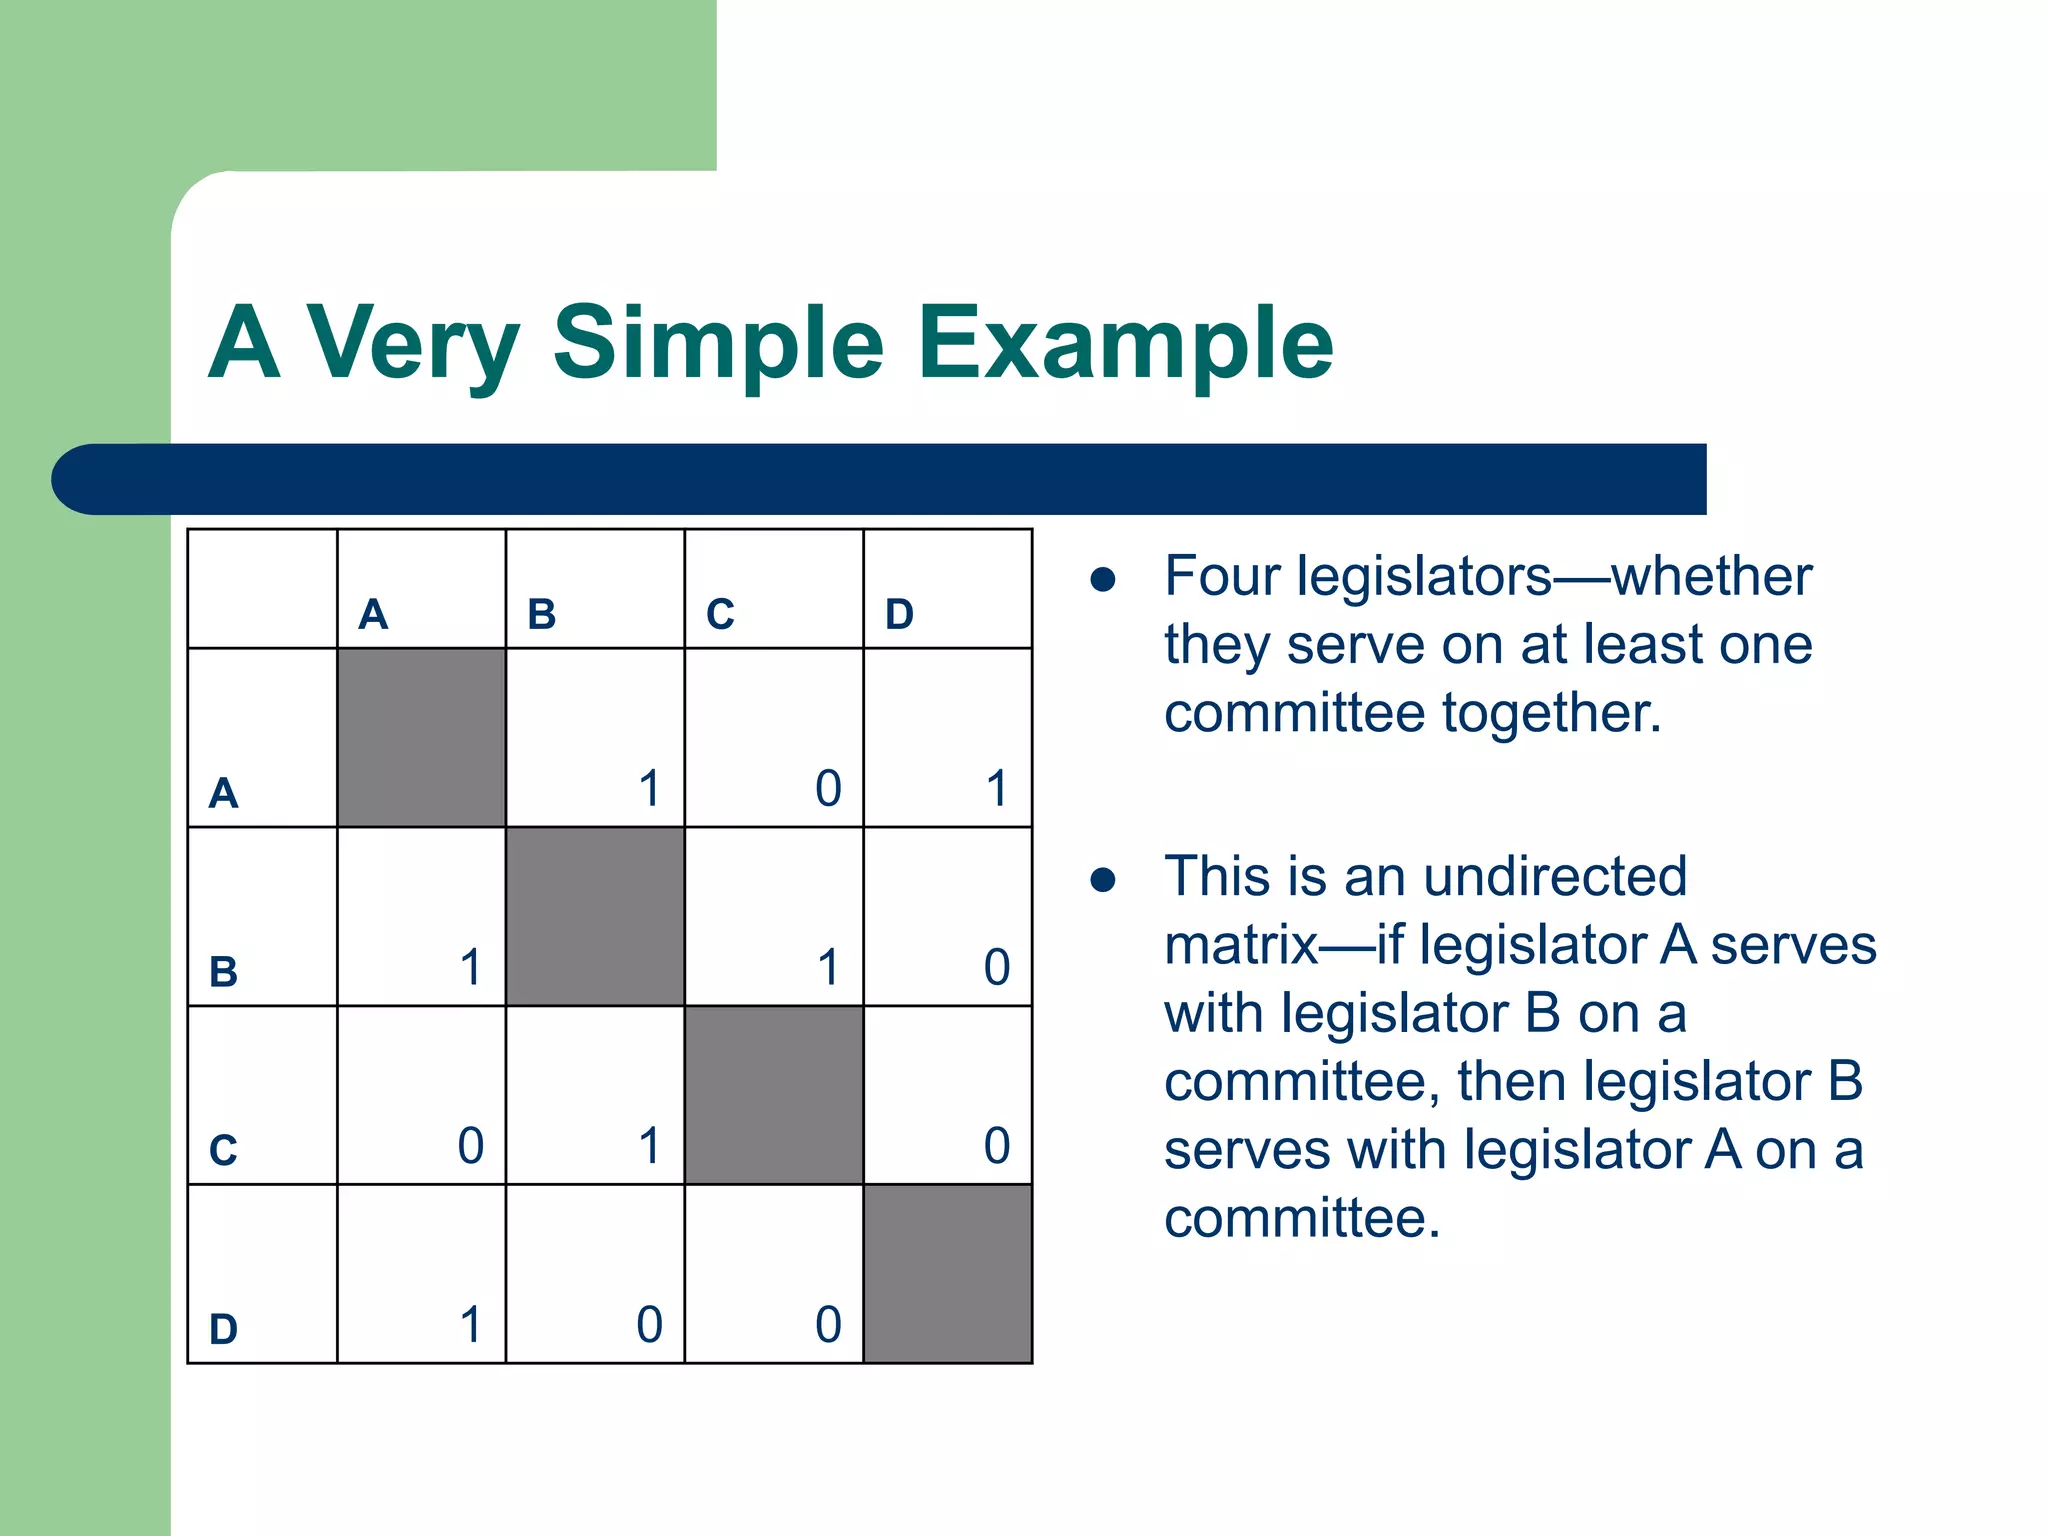
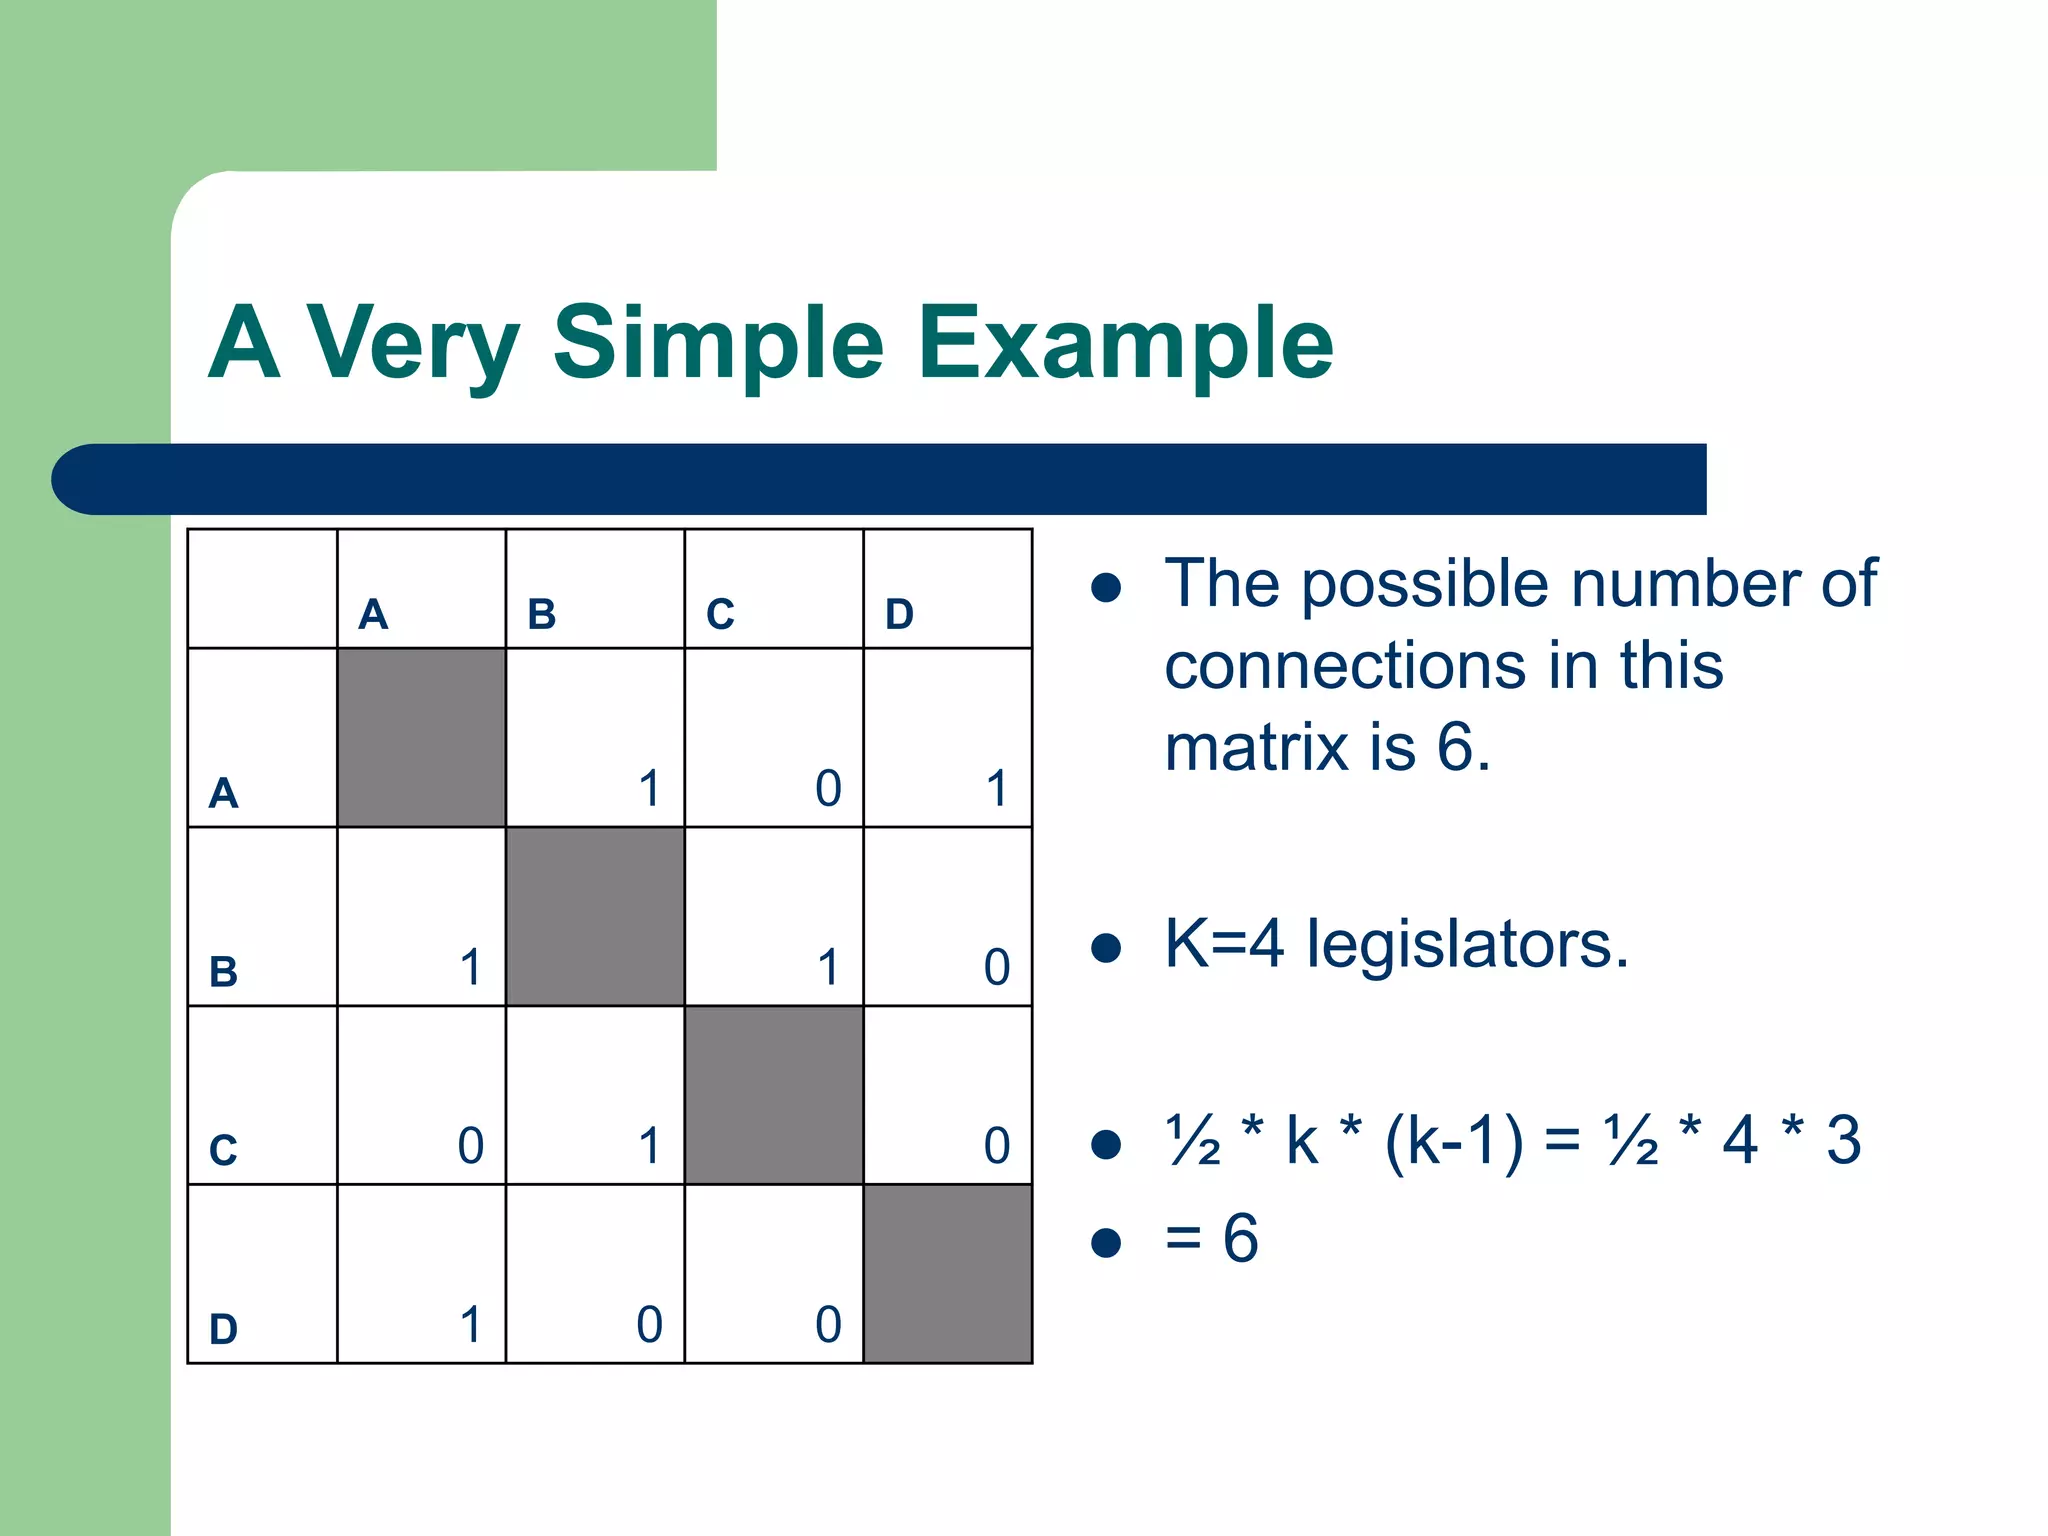
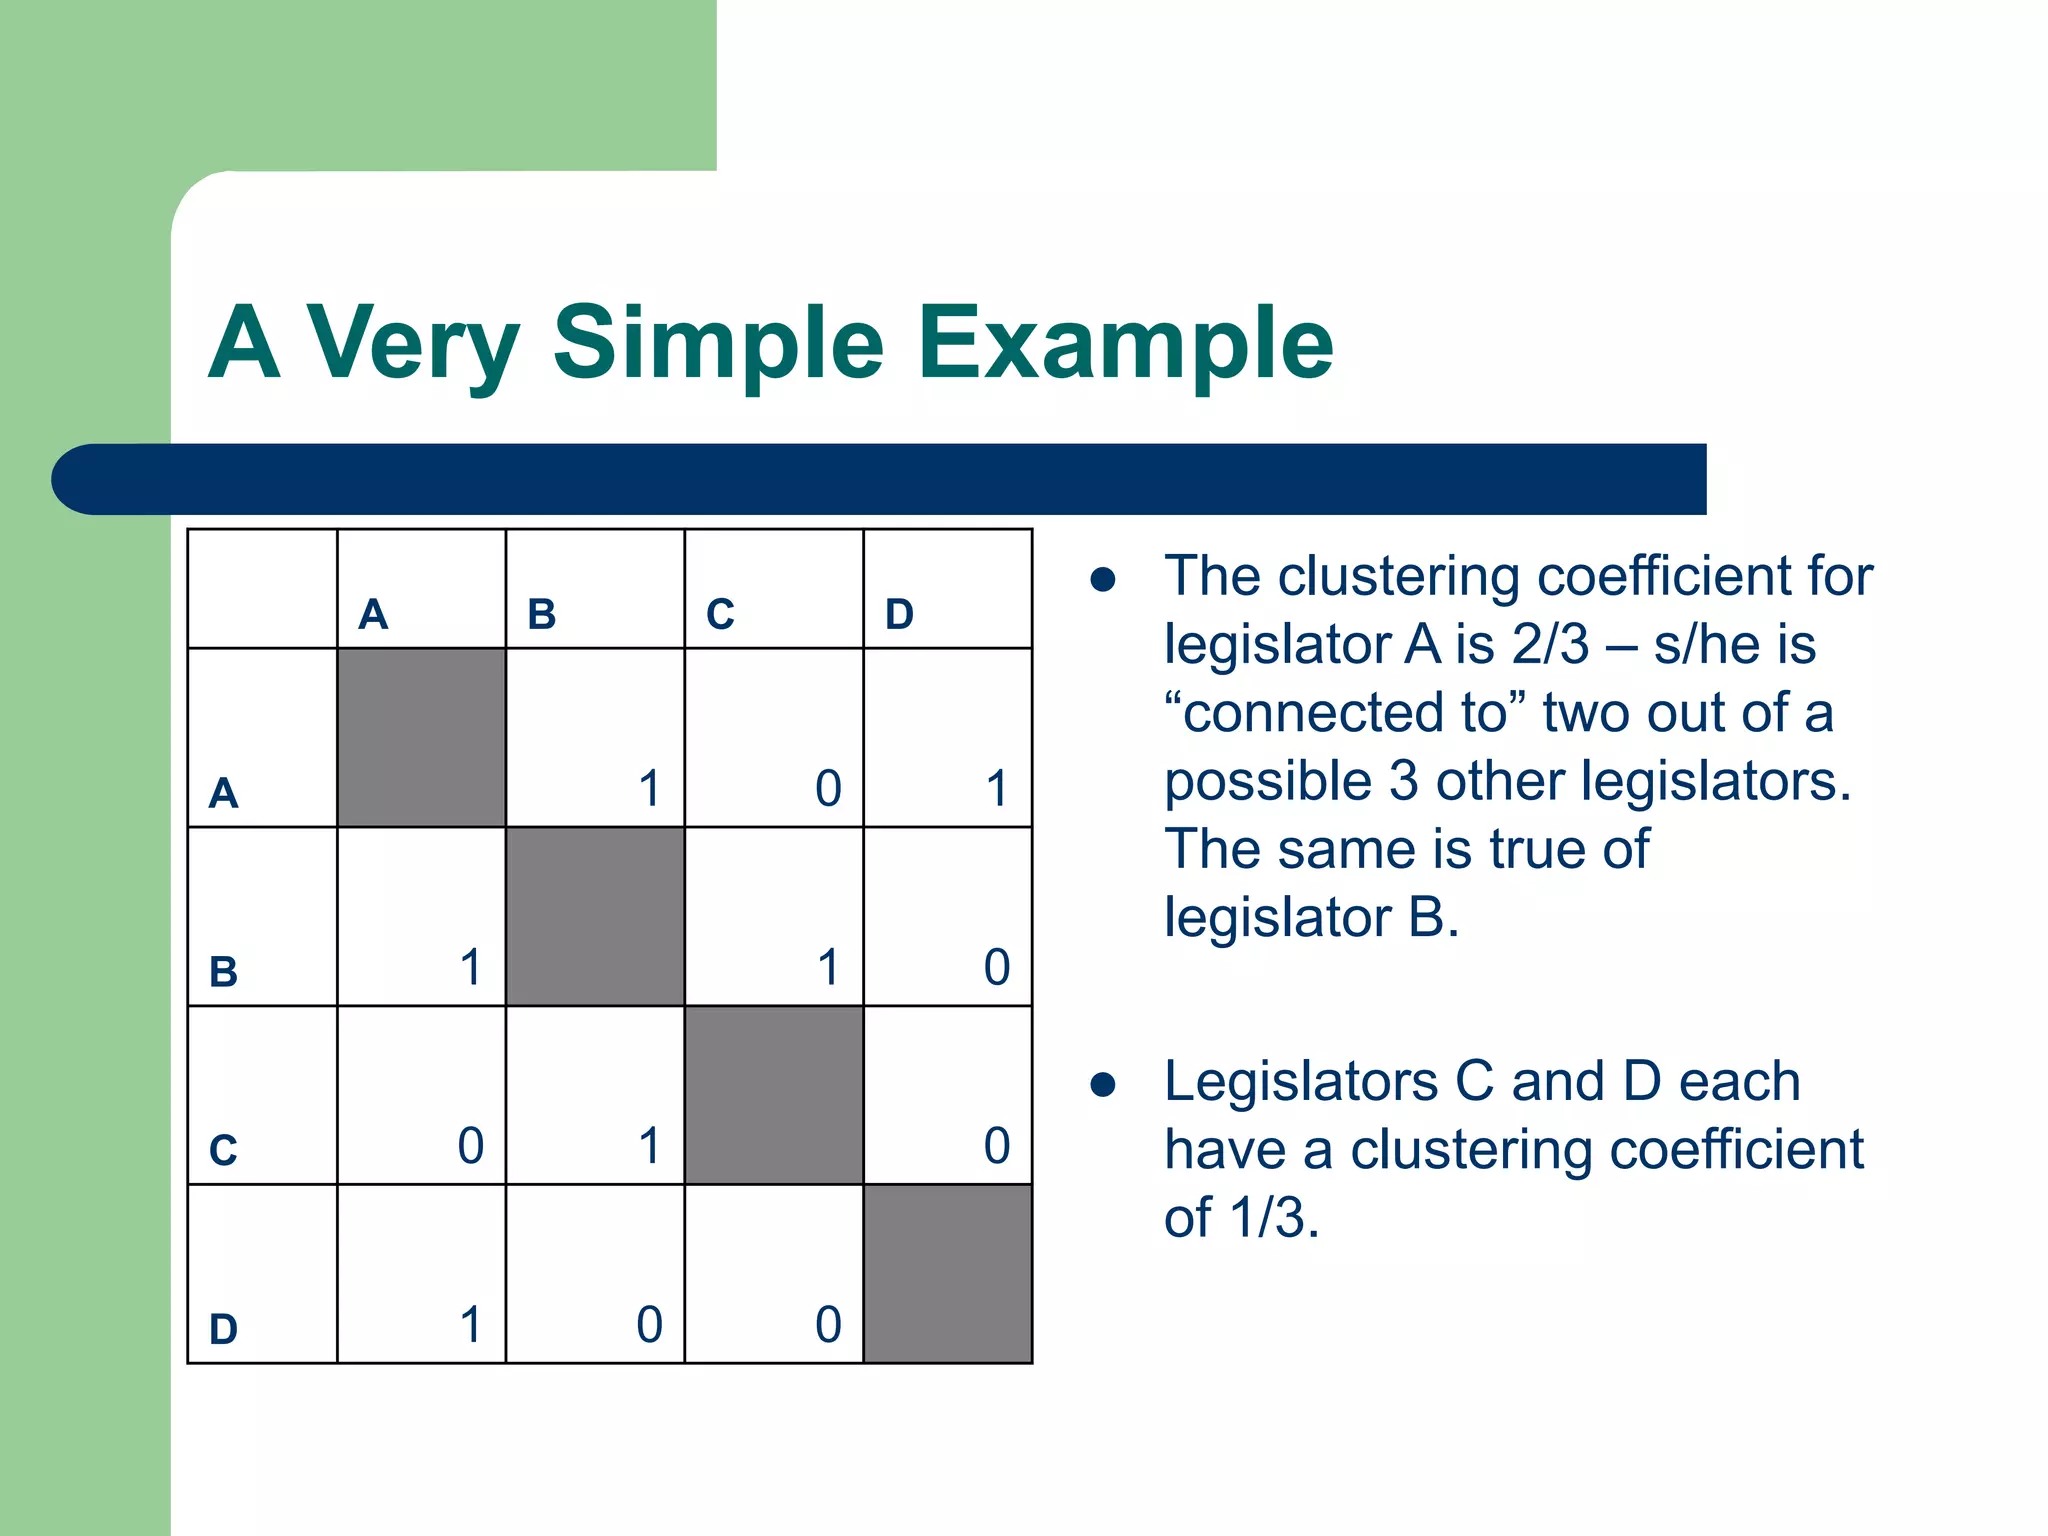
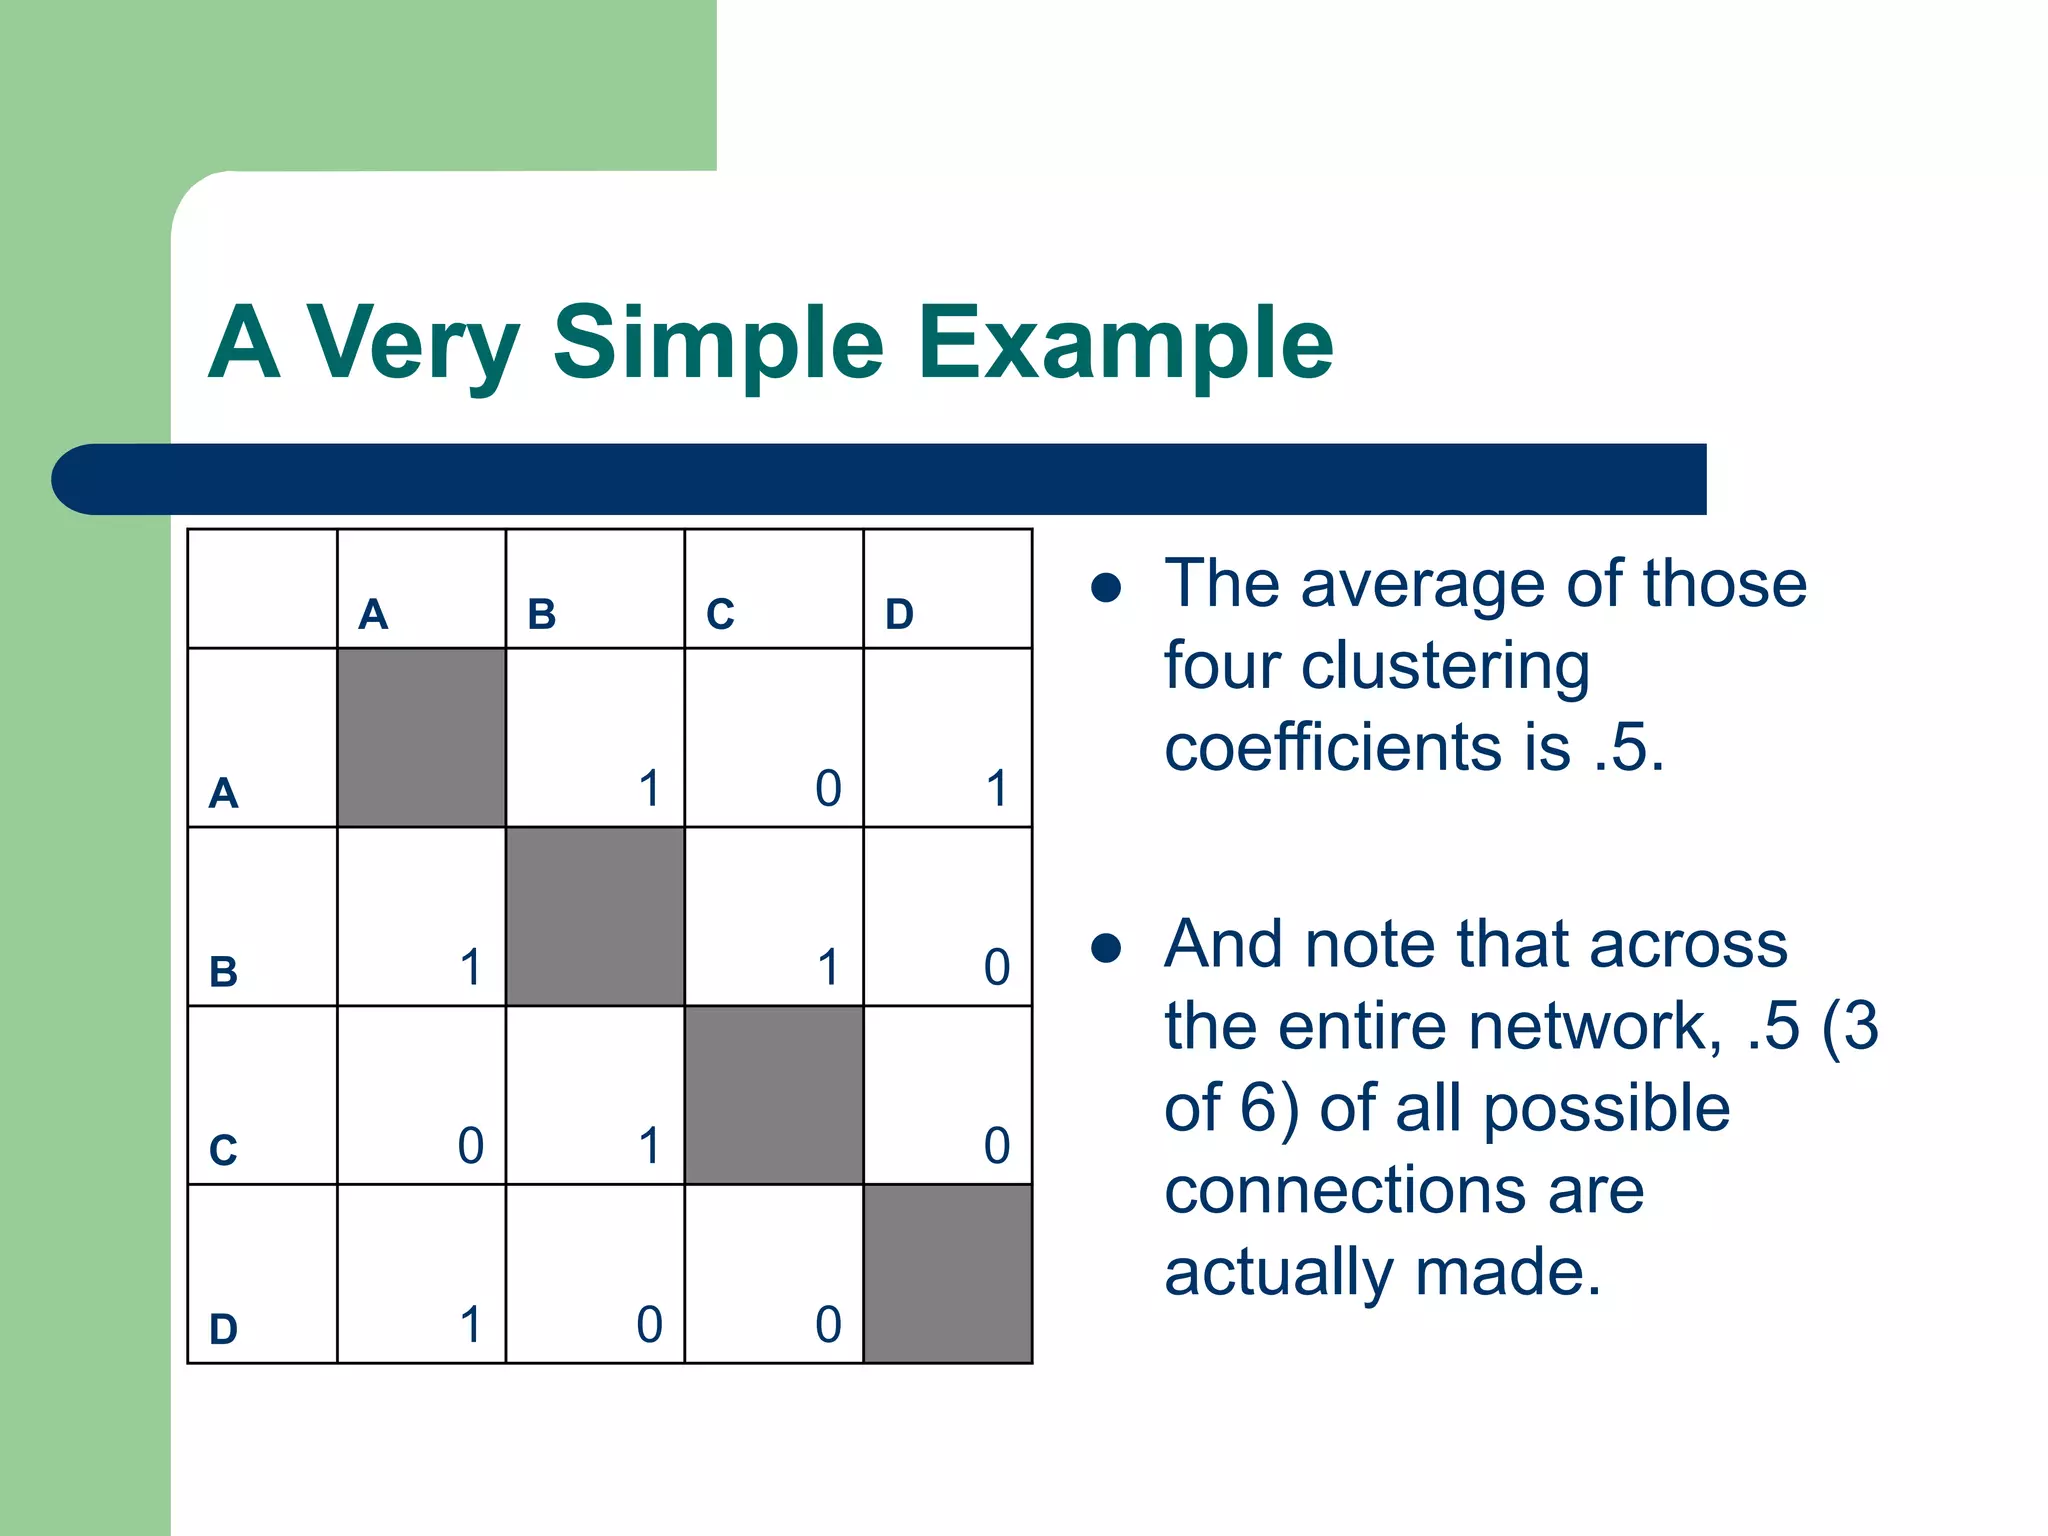
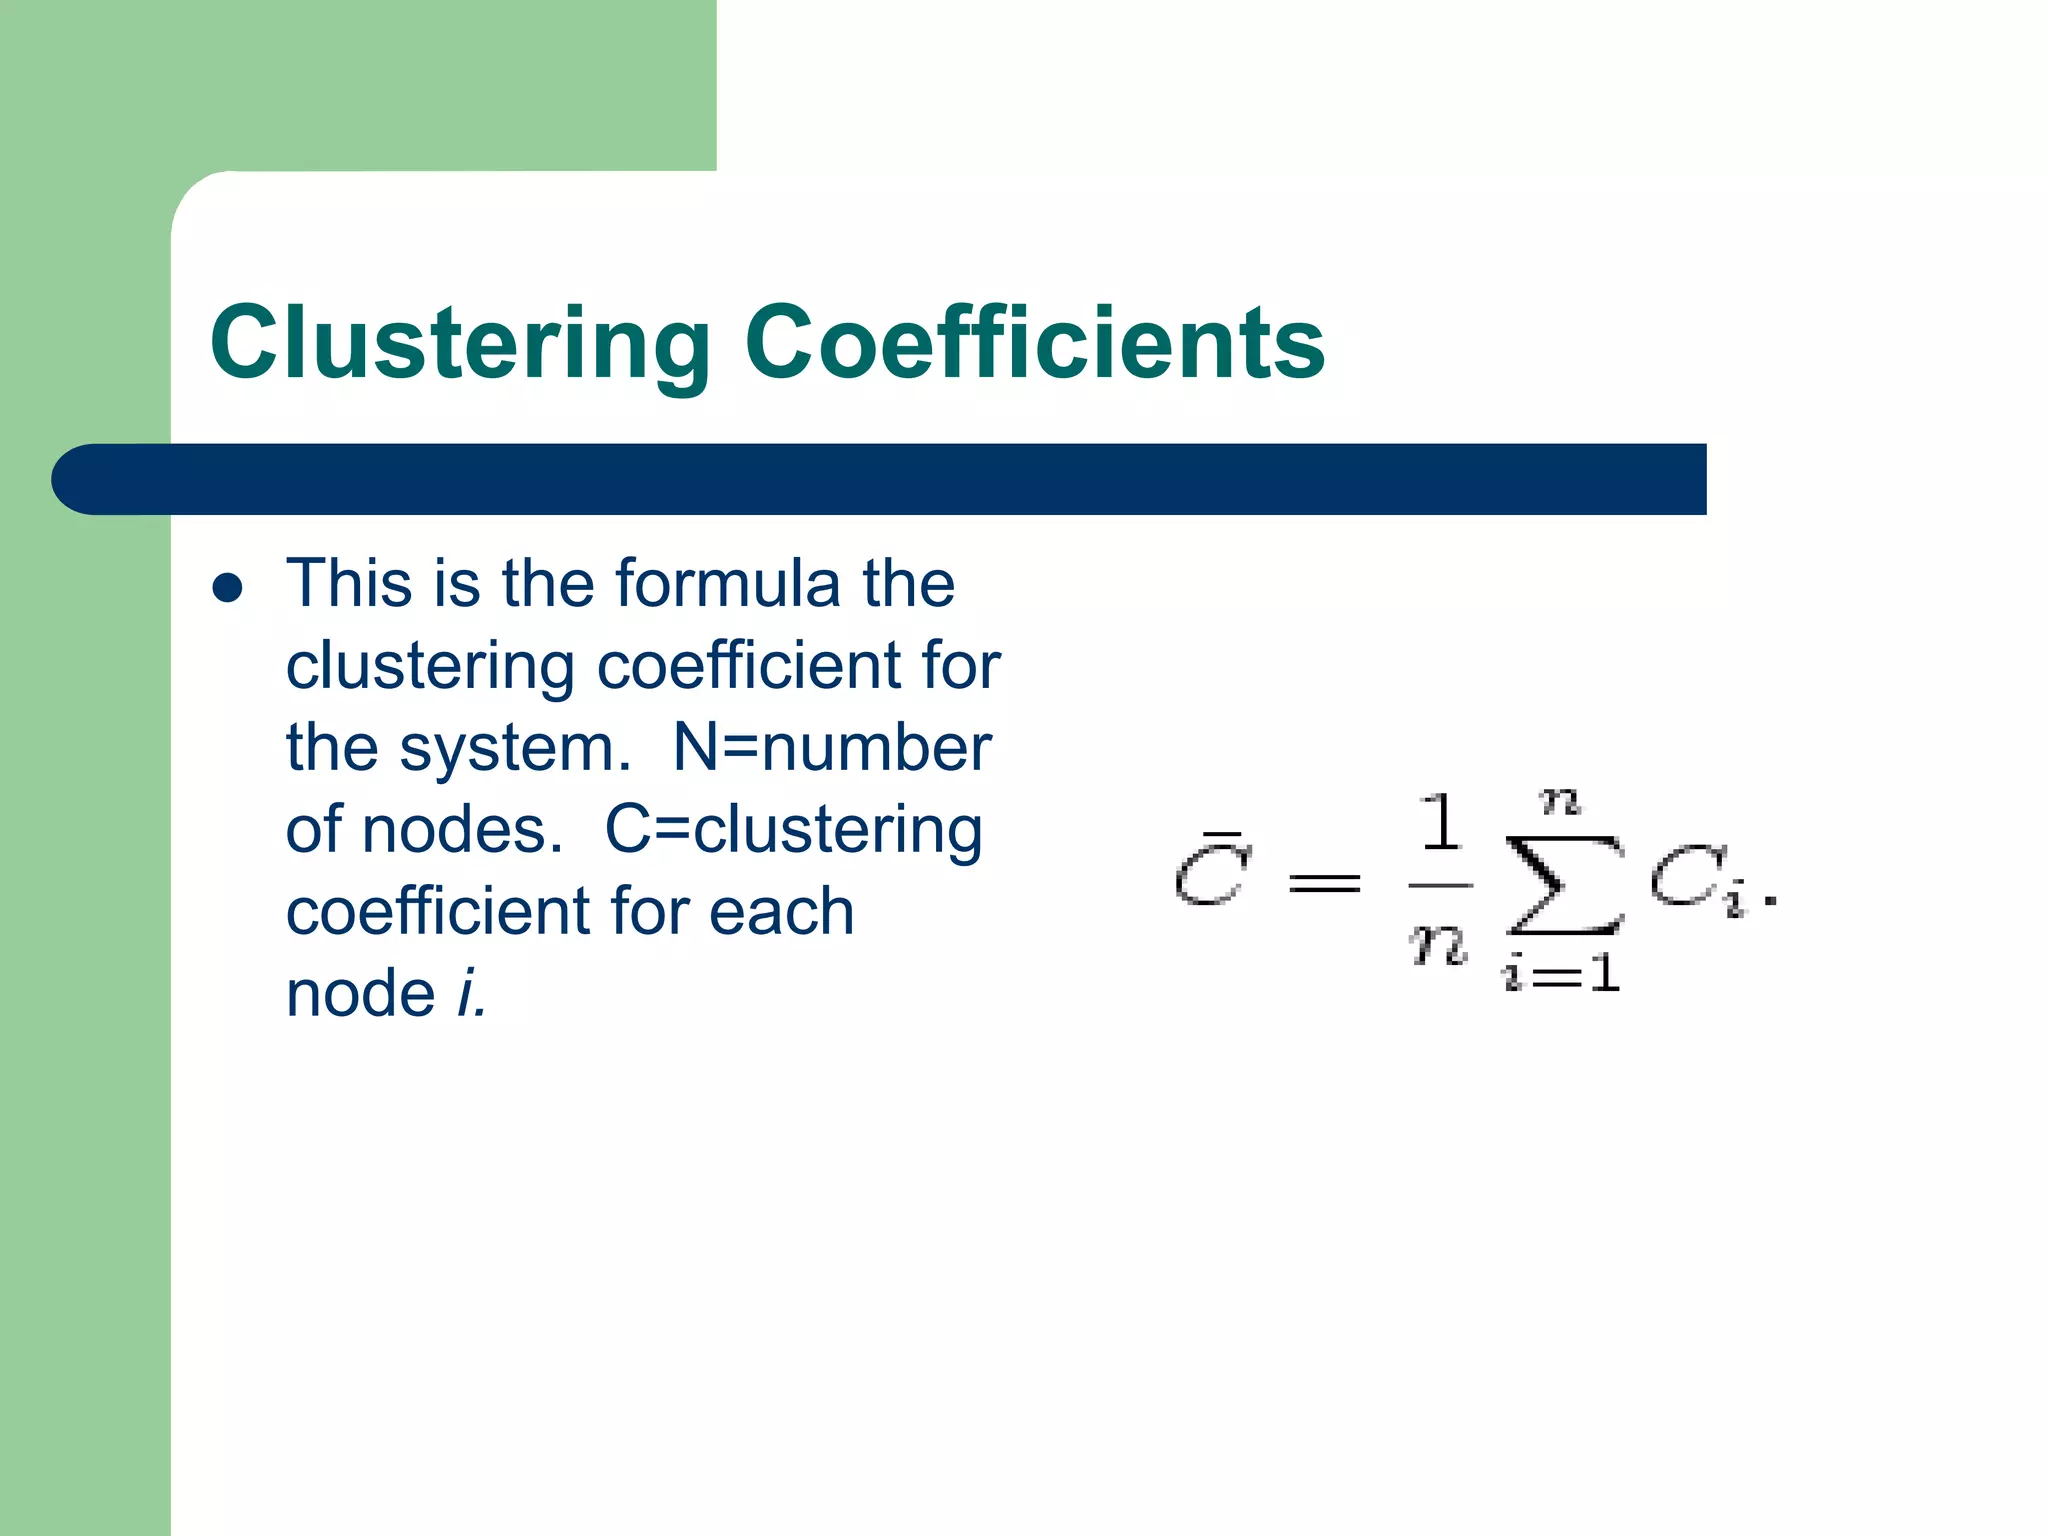
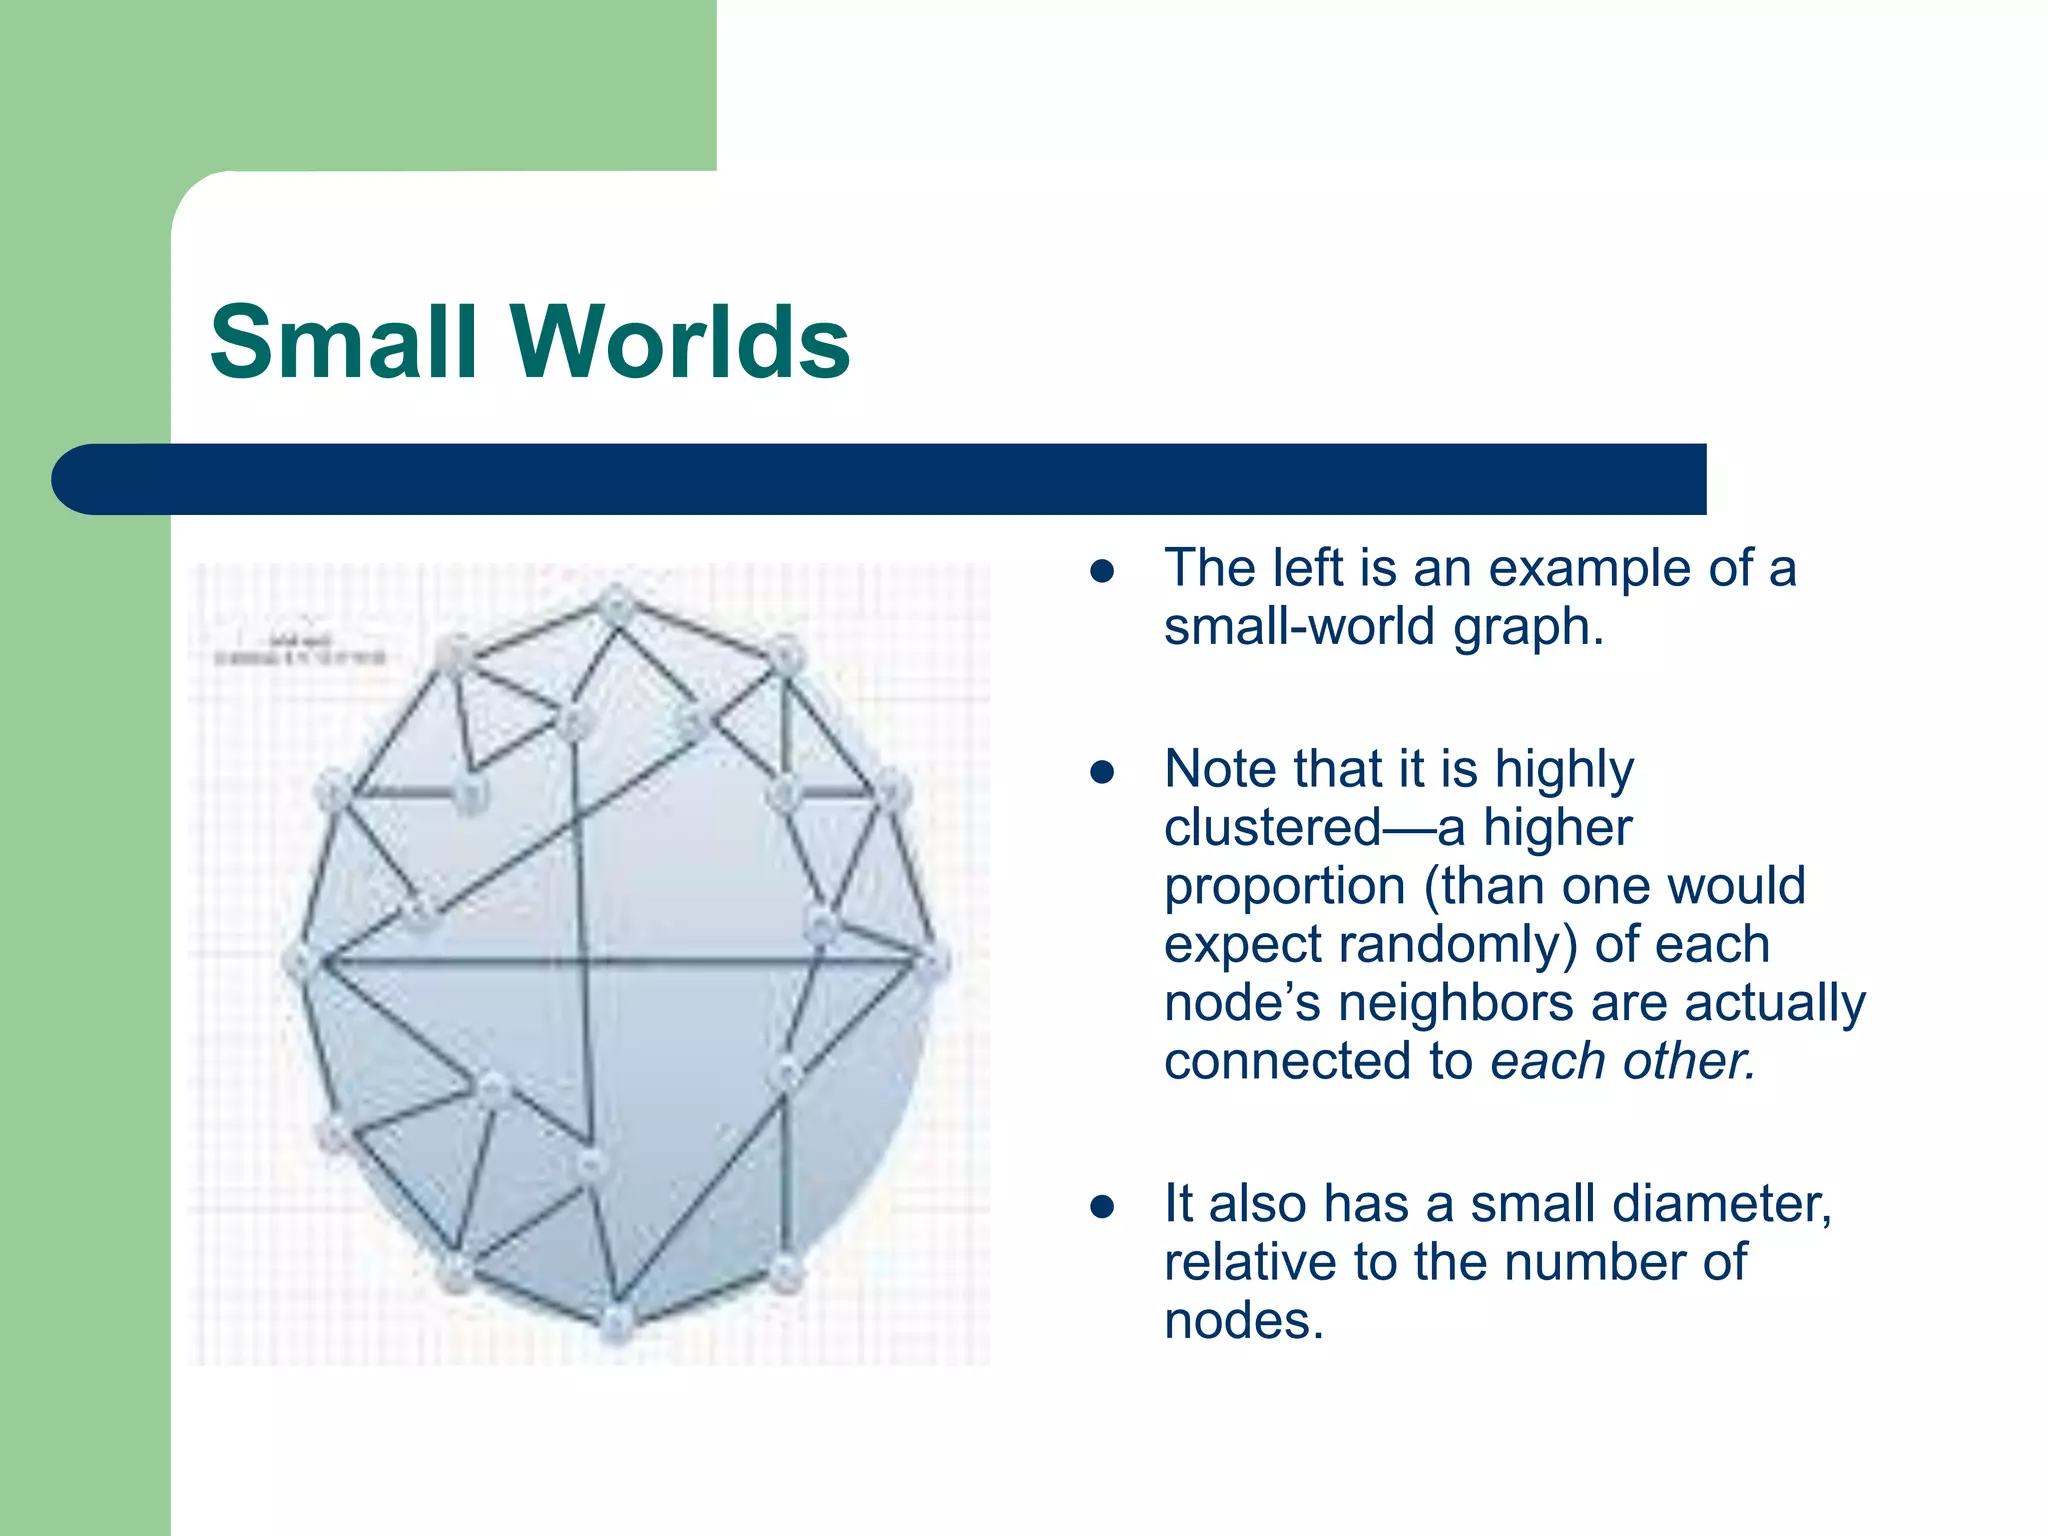
Fundamental concepts in network analysis such as nodes, edges, and the introductory notions of weak ties and small worlds.Concept of small worlds in network analysis, involving clustering, diameter, and examples of graph representations. Introduction to clustering coefficients, their measurement, and significance in both undirected and directed graphs.
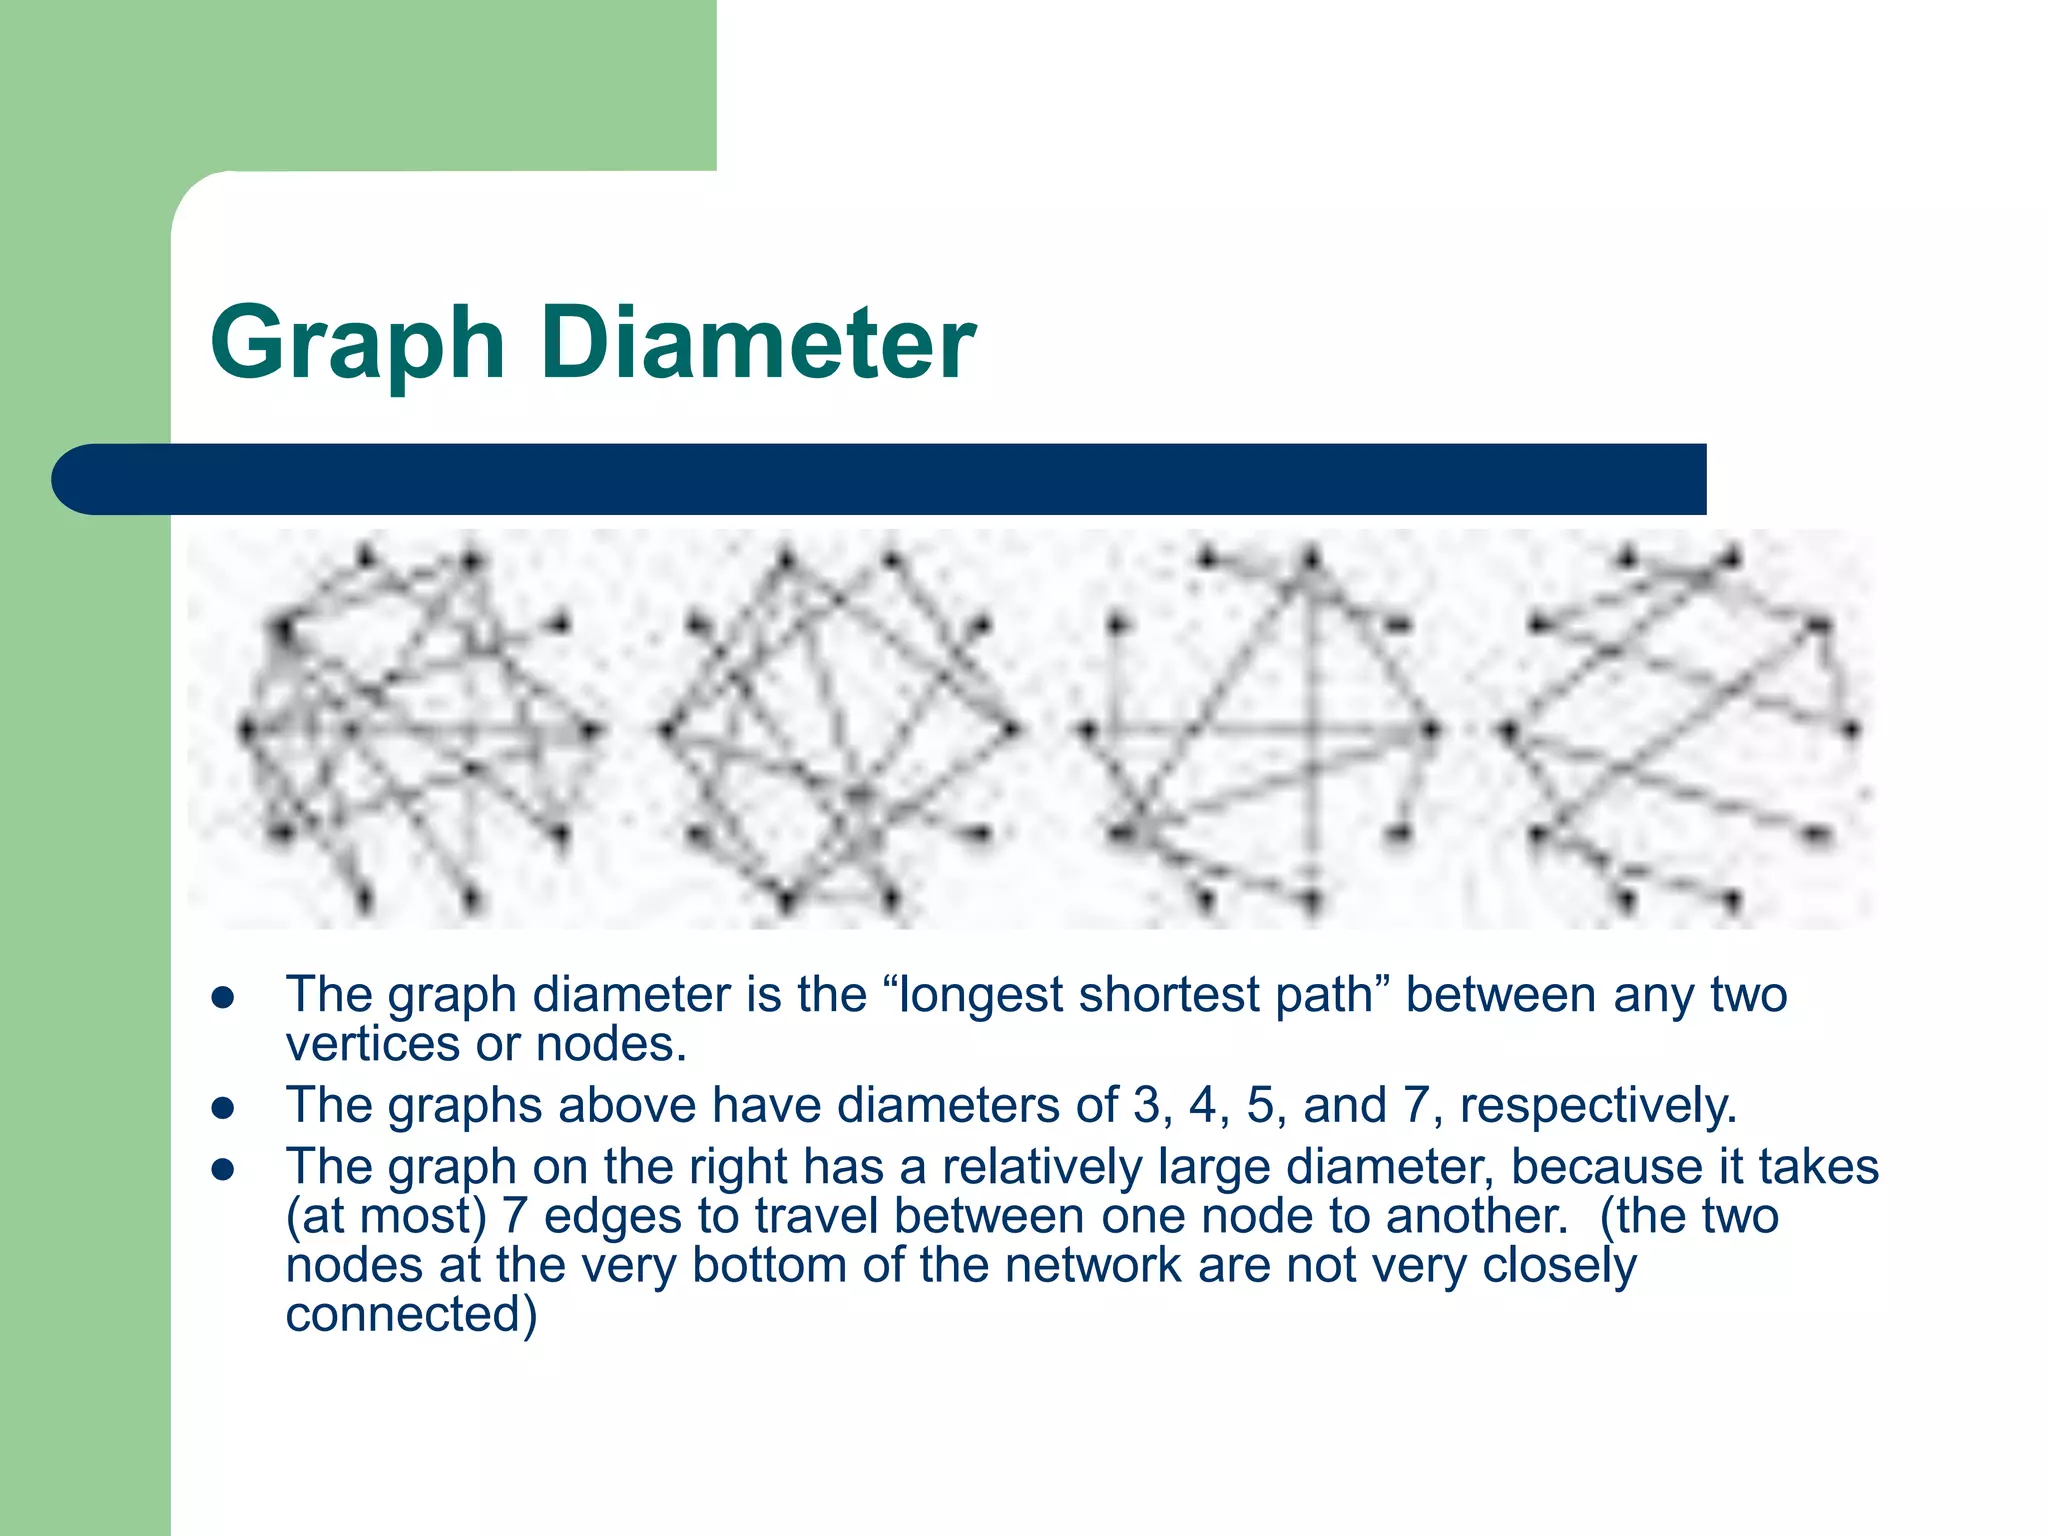
Explanation of graph diameter, the 'six degrees of separation' concept, and characteristics of small-world networks.
Discussion on social capital research exploring the implications of network connections among individuals.
The evolution and significance of network analysis in political science, highlighting key studies and figures.List of additional readings and instructional sites for further exploration in social network analysis.