Urban metabolic mapping on the web: An example from Bangalore, India.
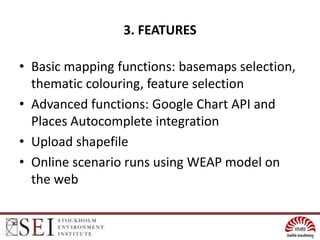
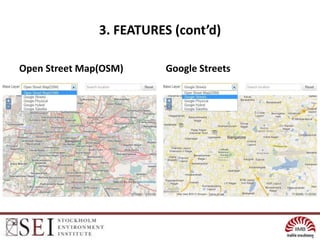
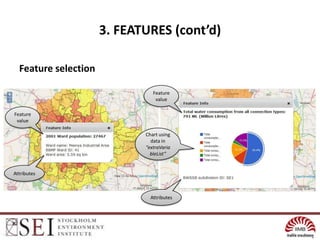
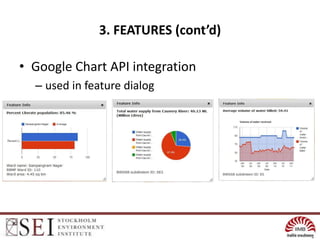
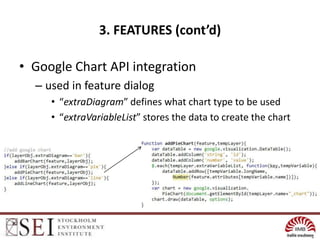
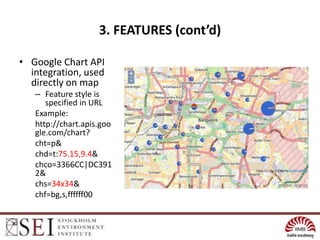
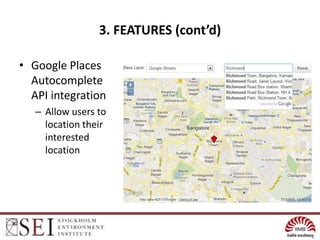
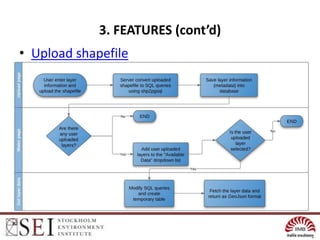
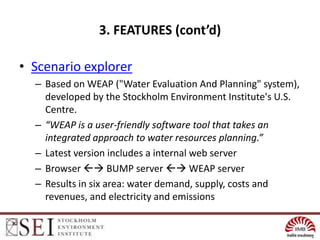
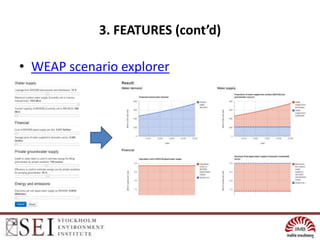
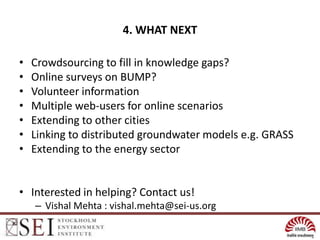
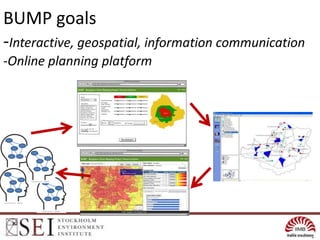
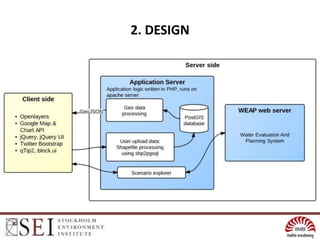
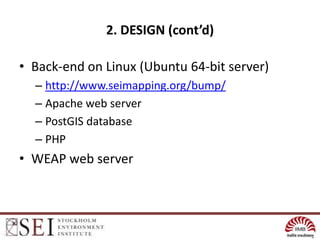
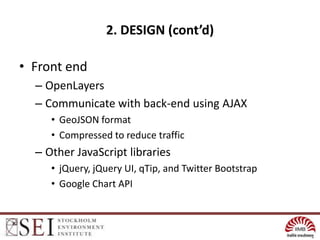
The document describes an interactive, online platform called BUMP (Bangalore Urban Metabolism Project) that allows users to visualize and explore urban metabolism data for Bangalore, India. BUMP uses open source tools like OpenLayers, PostGIS, and PHP to display geospatial data layers on maps and integrate features like Google Charts. It also links to the WEAP water modeling system to enable online scenario exploration. Next steps discussed include crowdsourcing data, conducting online surveys, and expanding the platform to other cities.


![2. DESIGN (cont’d)
• Data structure: • Example:
– Collection – Demography
• Attribute list • [Ward name, BBMP Ward
ID, Ward area]
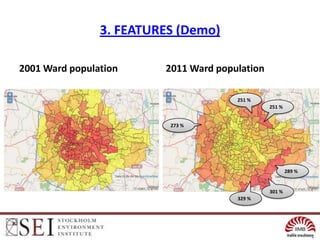
• Layer list • 2001 Ward population
– … – …
– Extra variable list – []
– Is this layer distributed – True
– Is this layer time series – False
– Type – Polygon
– Geo data – GeoJSON object
– … – …](https://image.slidesharecdn.com/seiosgisbangaloreppt-121218045147-phpapp01/85/SEI-OSGIS-presentation-11-320.jpg)