Downloaded 57 times

![Leaflet Vector Layers
• Leaflet is Scalable Vector Graphics (SVG) based
• Behind the scenes, non-image based markers are
drawn using an SVG path element
<path [path attributes] d=”[path data (e.g. M548 254L548 49L676
49L676 254L548 254z)]"></path>
• Leaflet style options are mapped to path attributes
• Style options include:
color, fillColor, opacity, fillOpacity, weight, dashArray,
stroke, fill, radius
• We can create custom markers dynamically by
inheriting from the L.Path class
9](https://image.slidesharecdn.com/meetupadvancedgeoviz-121212211021-phpapp02/85/Advanced-Web-Based-Geospatial-Visualization-using-Leaflet-9-320.jpg)
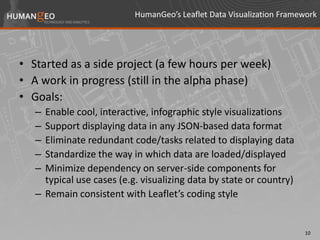
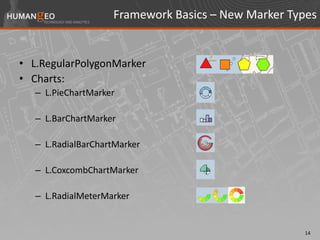
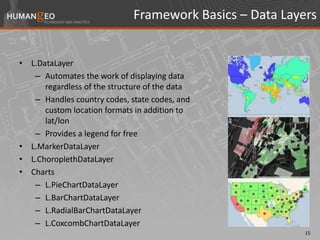
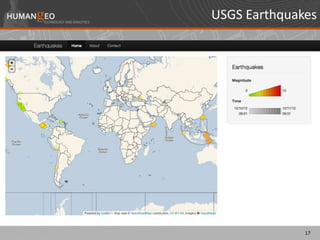
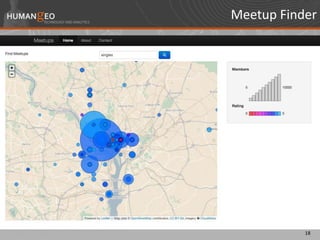
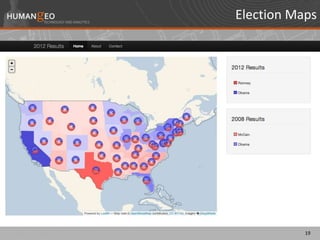
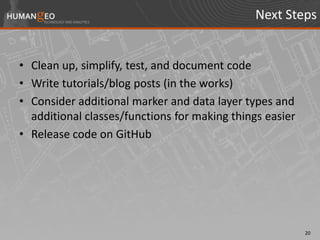
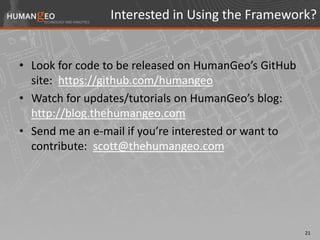

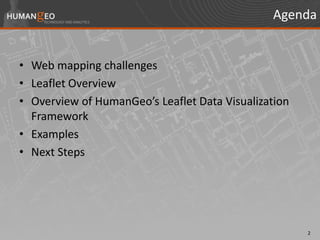
The document discusses advanced web-based geospatial visualization using the Leaflet framework, highlighting challenges and considerations for selecting mapping frameworks, data structure, and location formats. It presents an overview of Leaflet's features, including its interactive visualization capabilities, styling options, and custom marker functionalities, as well as Humangeo's data visualization framework. Next steps involve refining the framework, releasing code on GitHub, and providing tutorials to support user engagement.


![Getting Started with Apache Spark: Big Data Made Simple [Free Meetup]](https://cdn.slidesharecdn.com/ss_thumbnails/apachesparkgettingstarted-260203175547-8361bcc3-thumbnail.jpg?width=640&height=640&fit=bounds)


