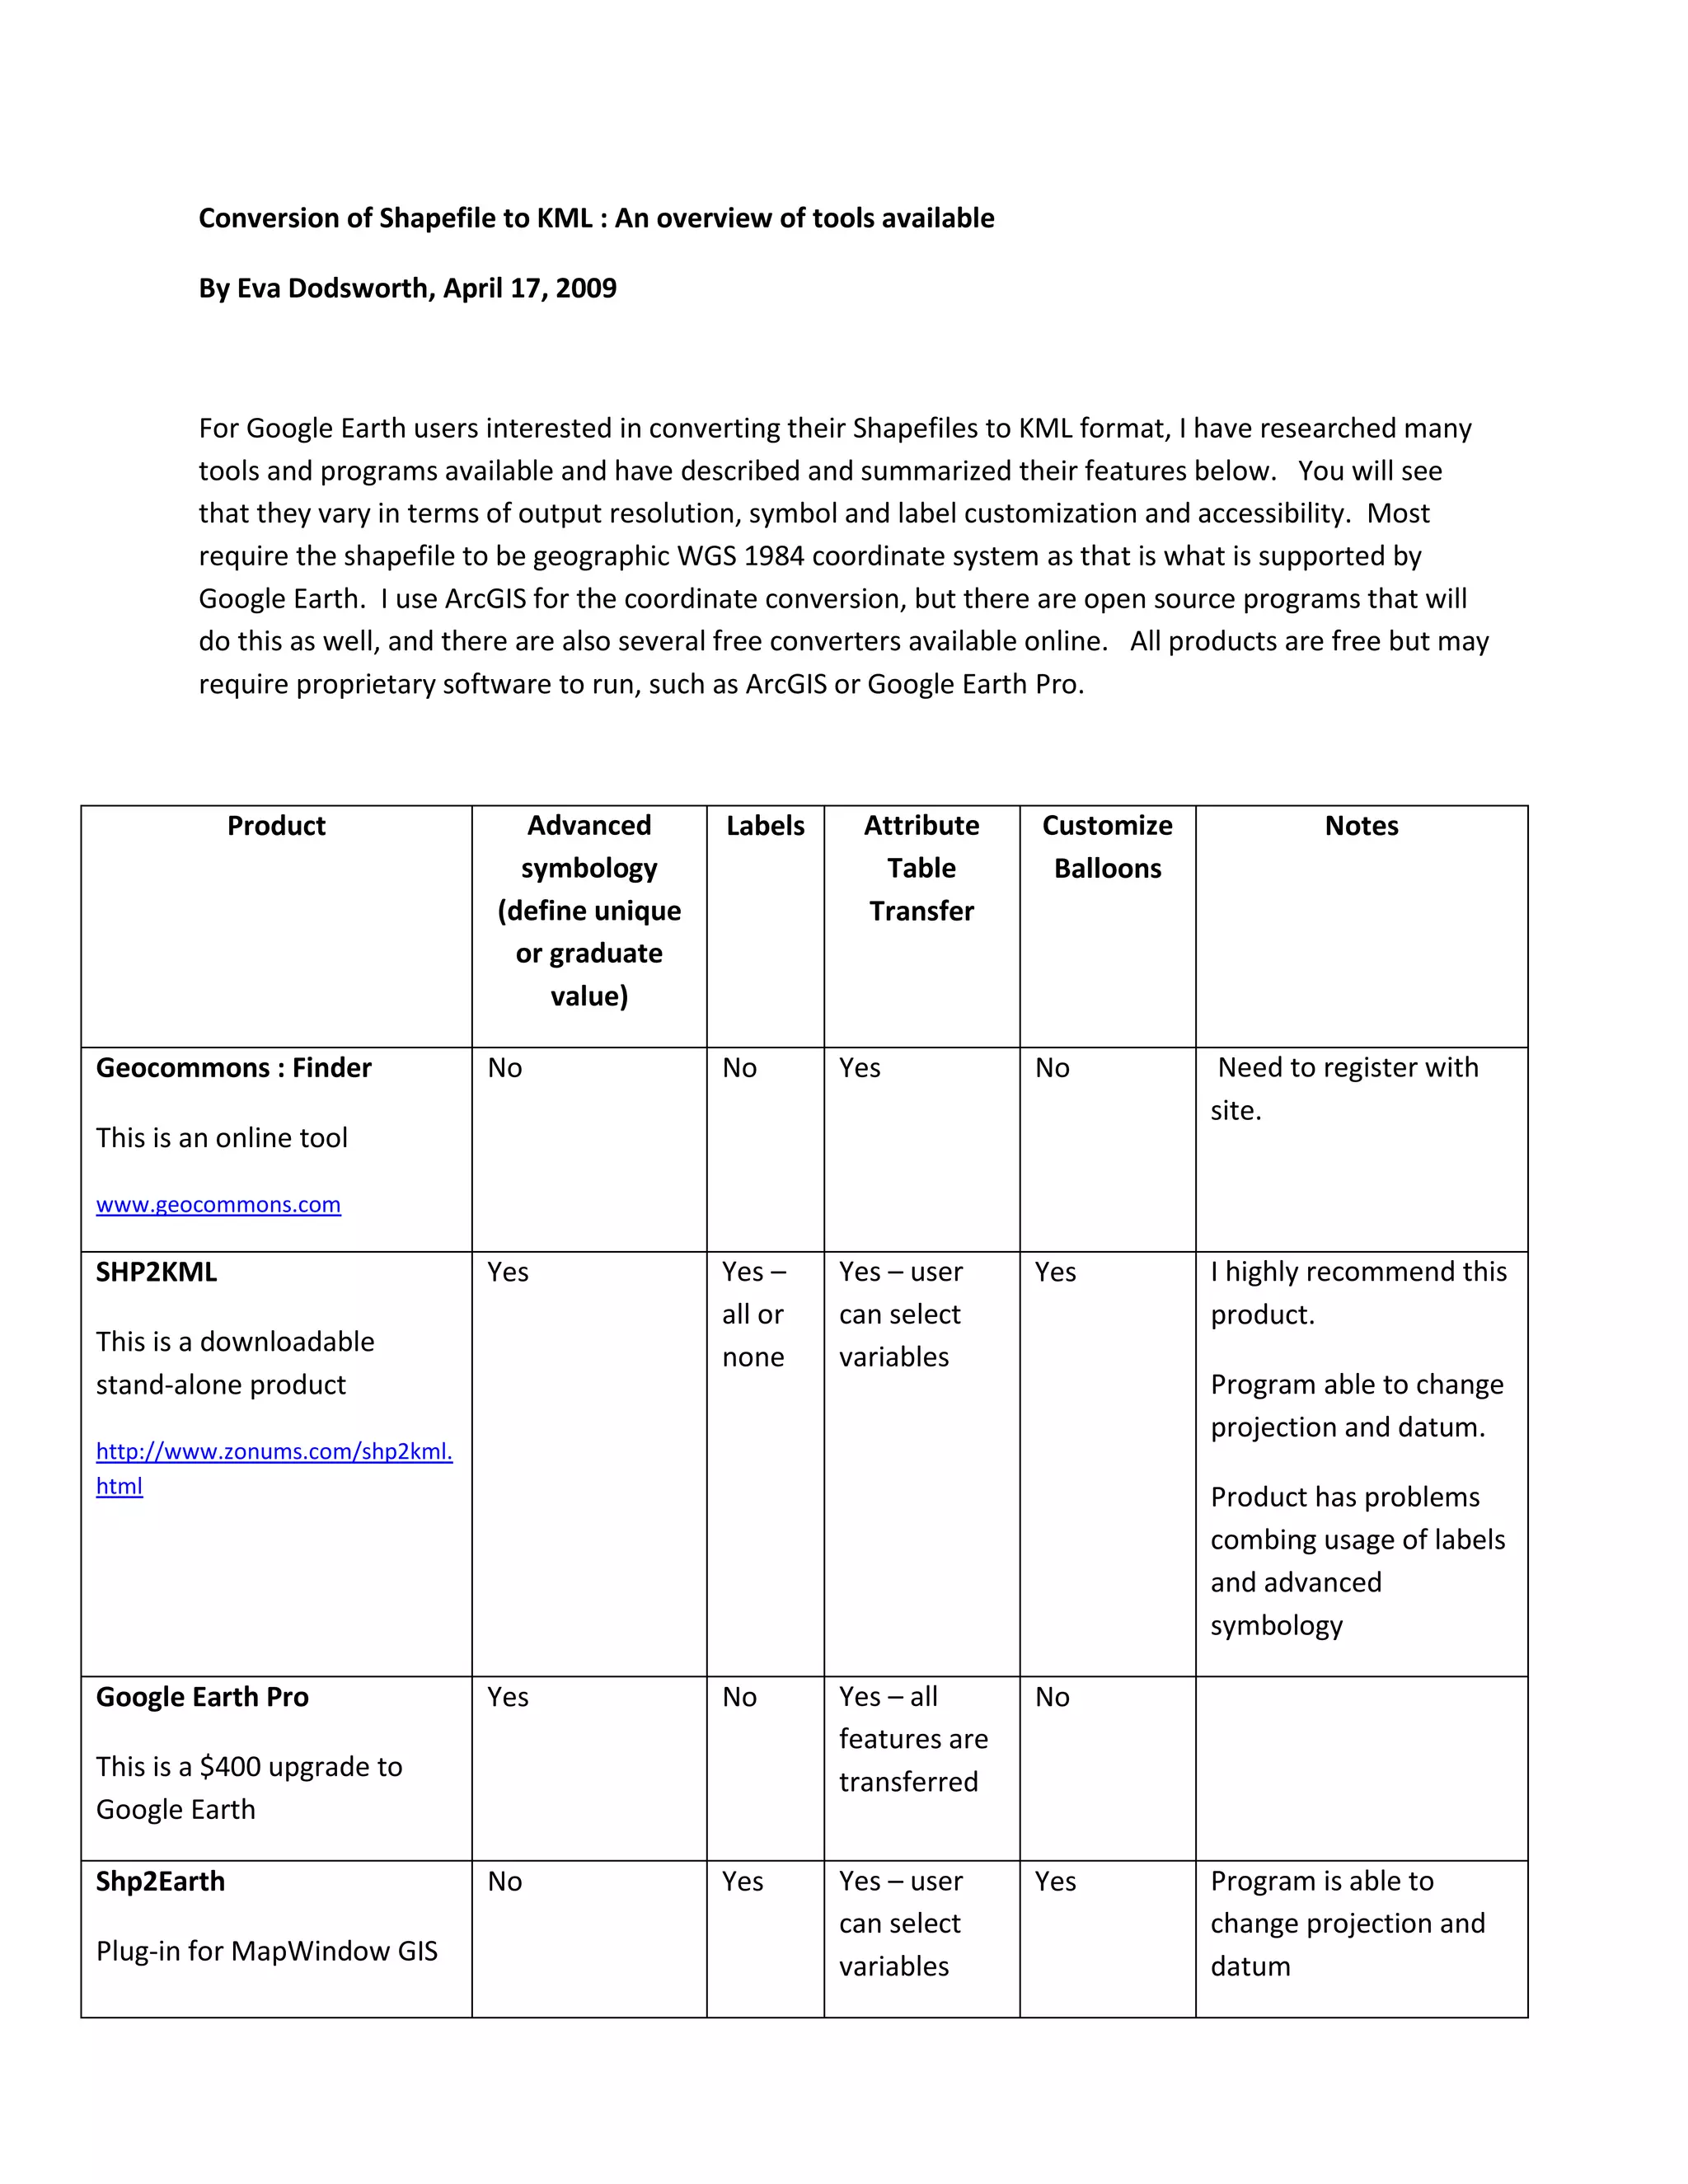
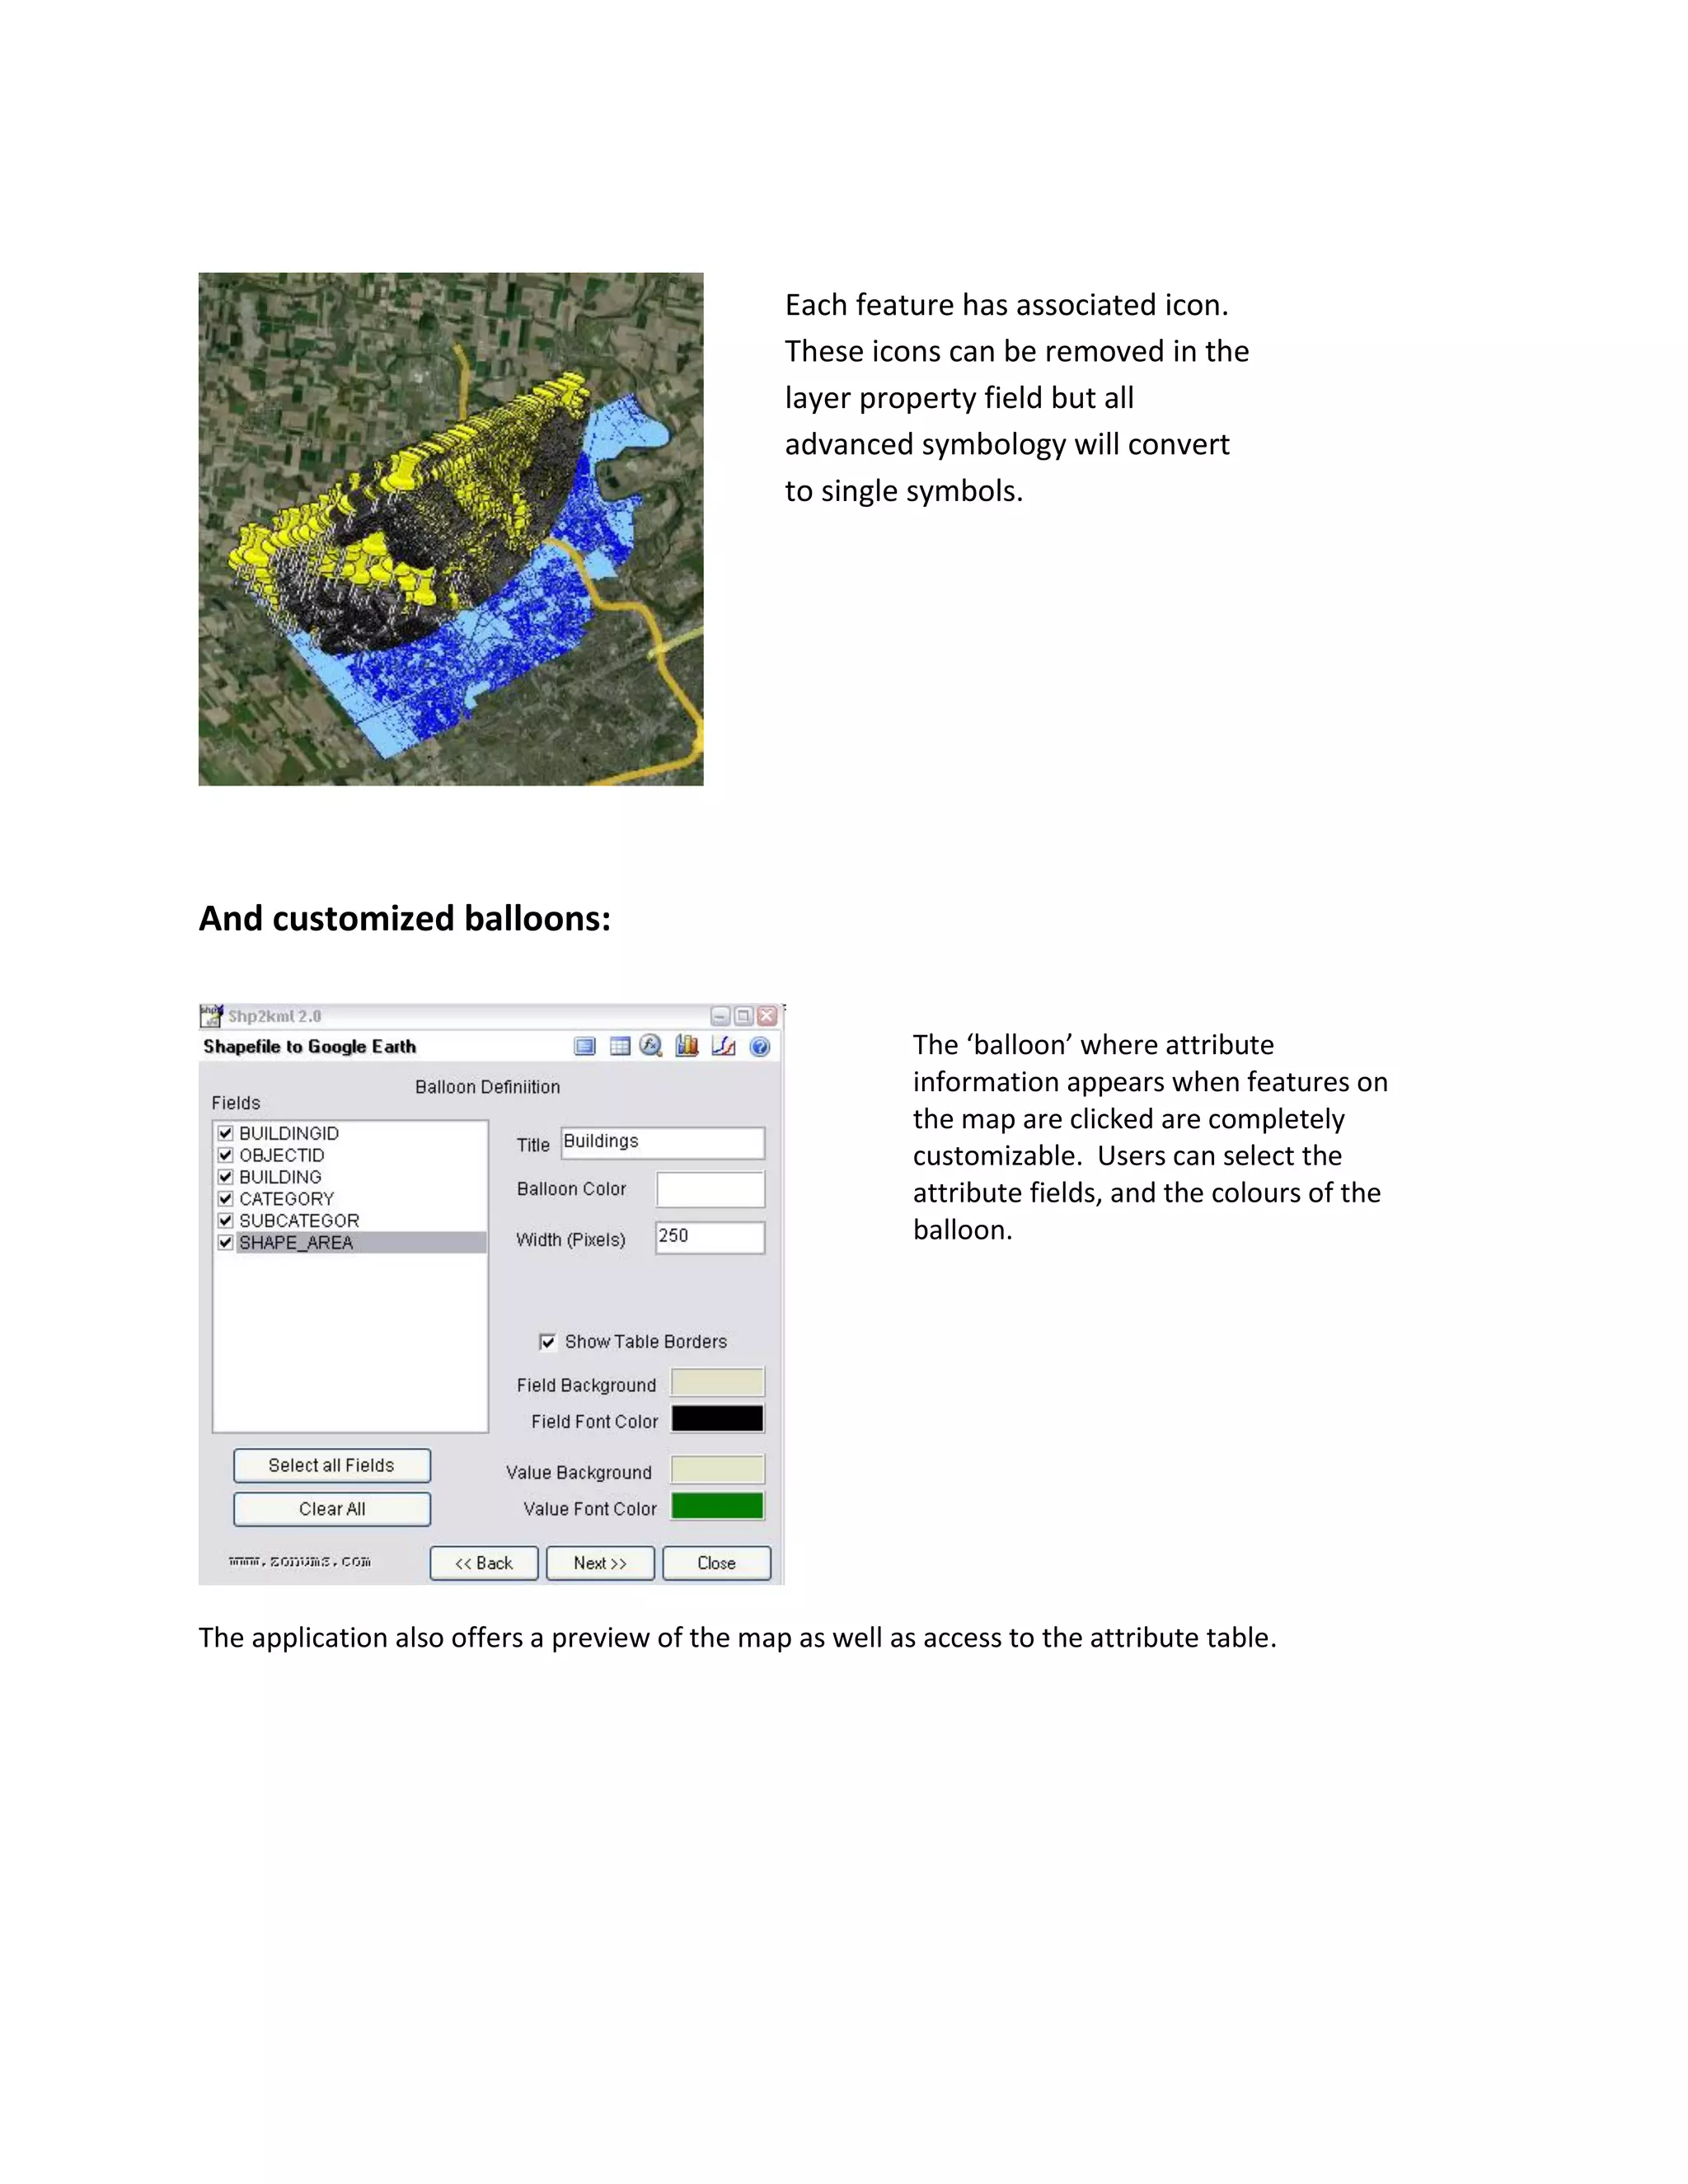
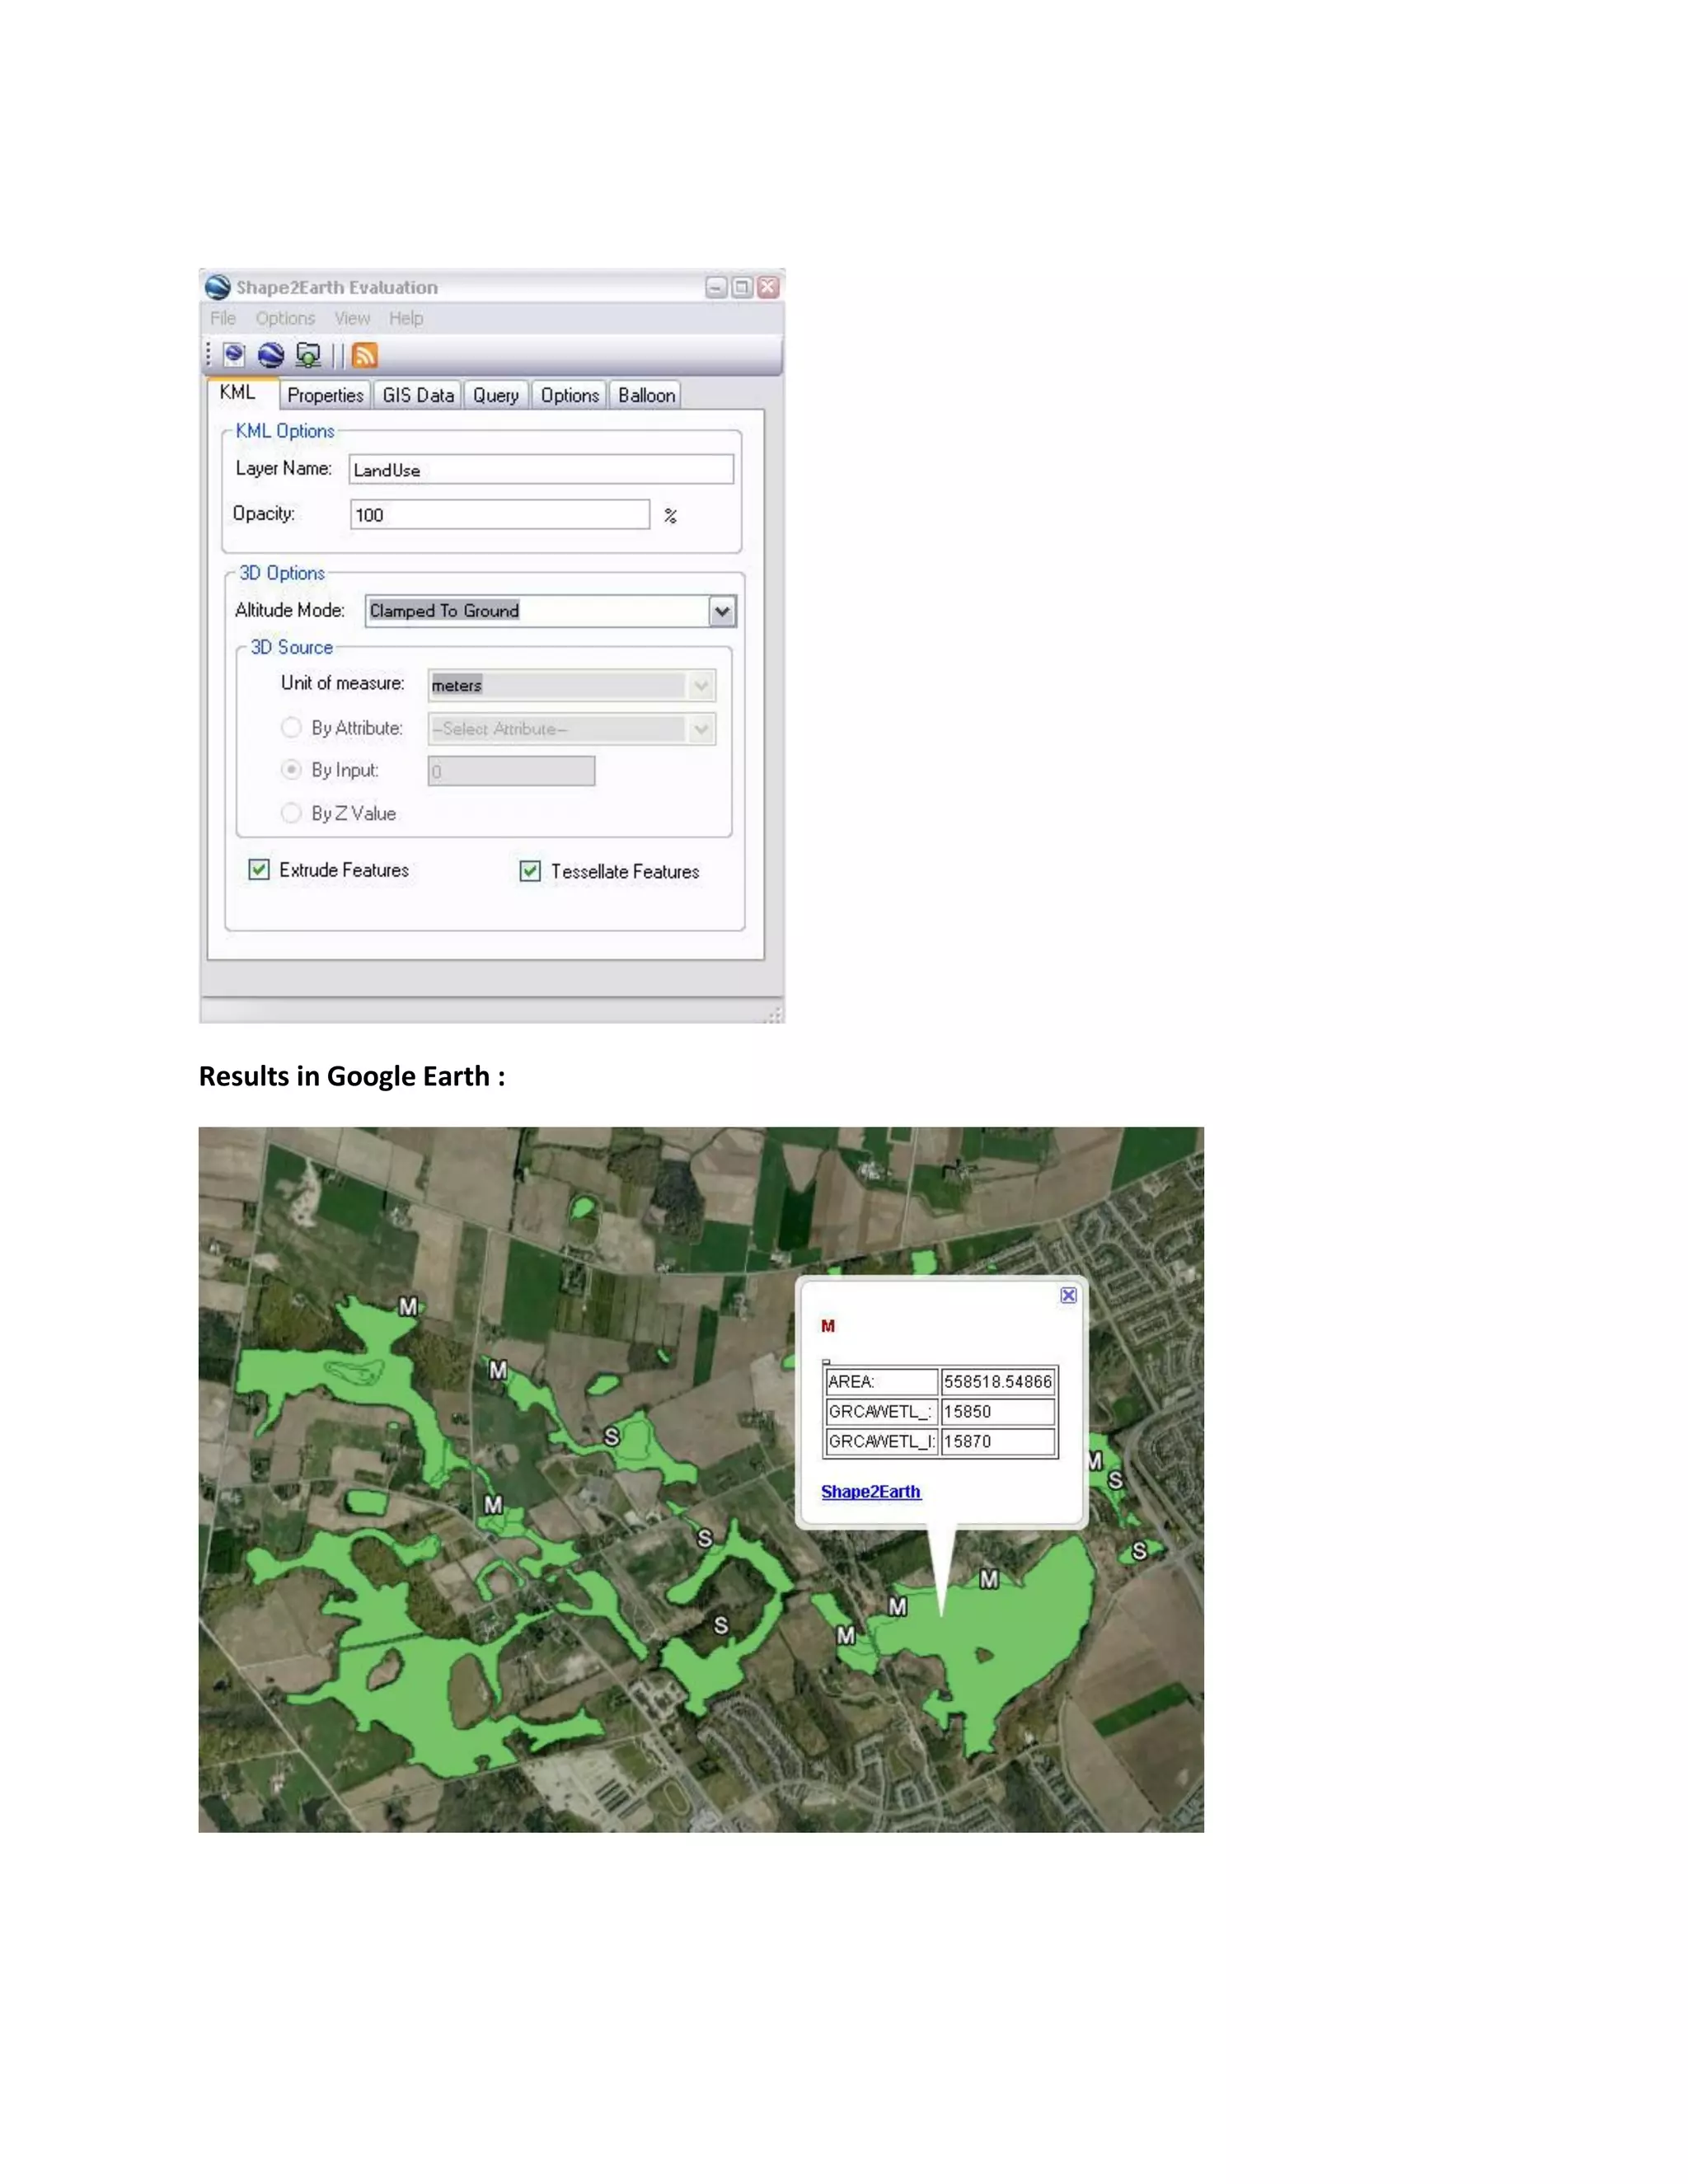
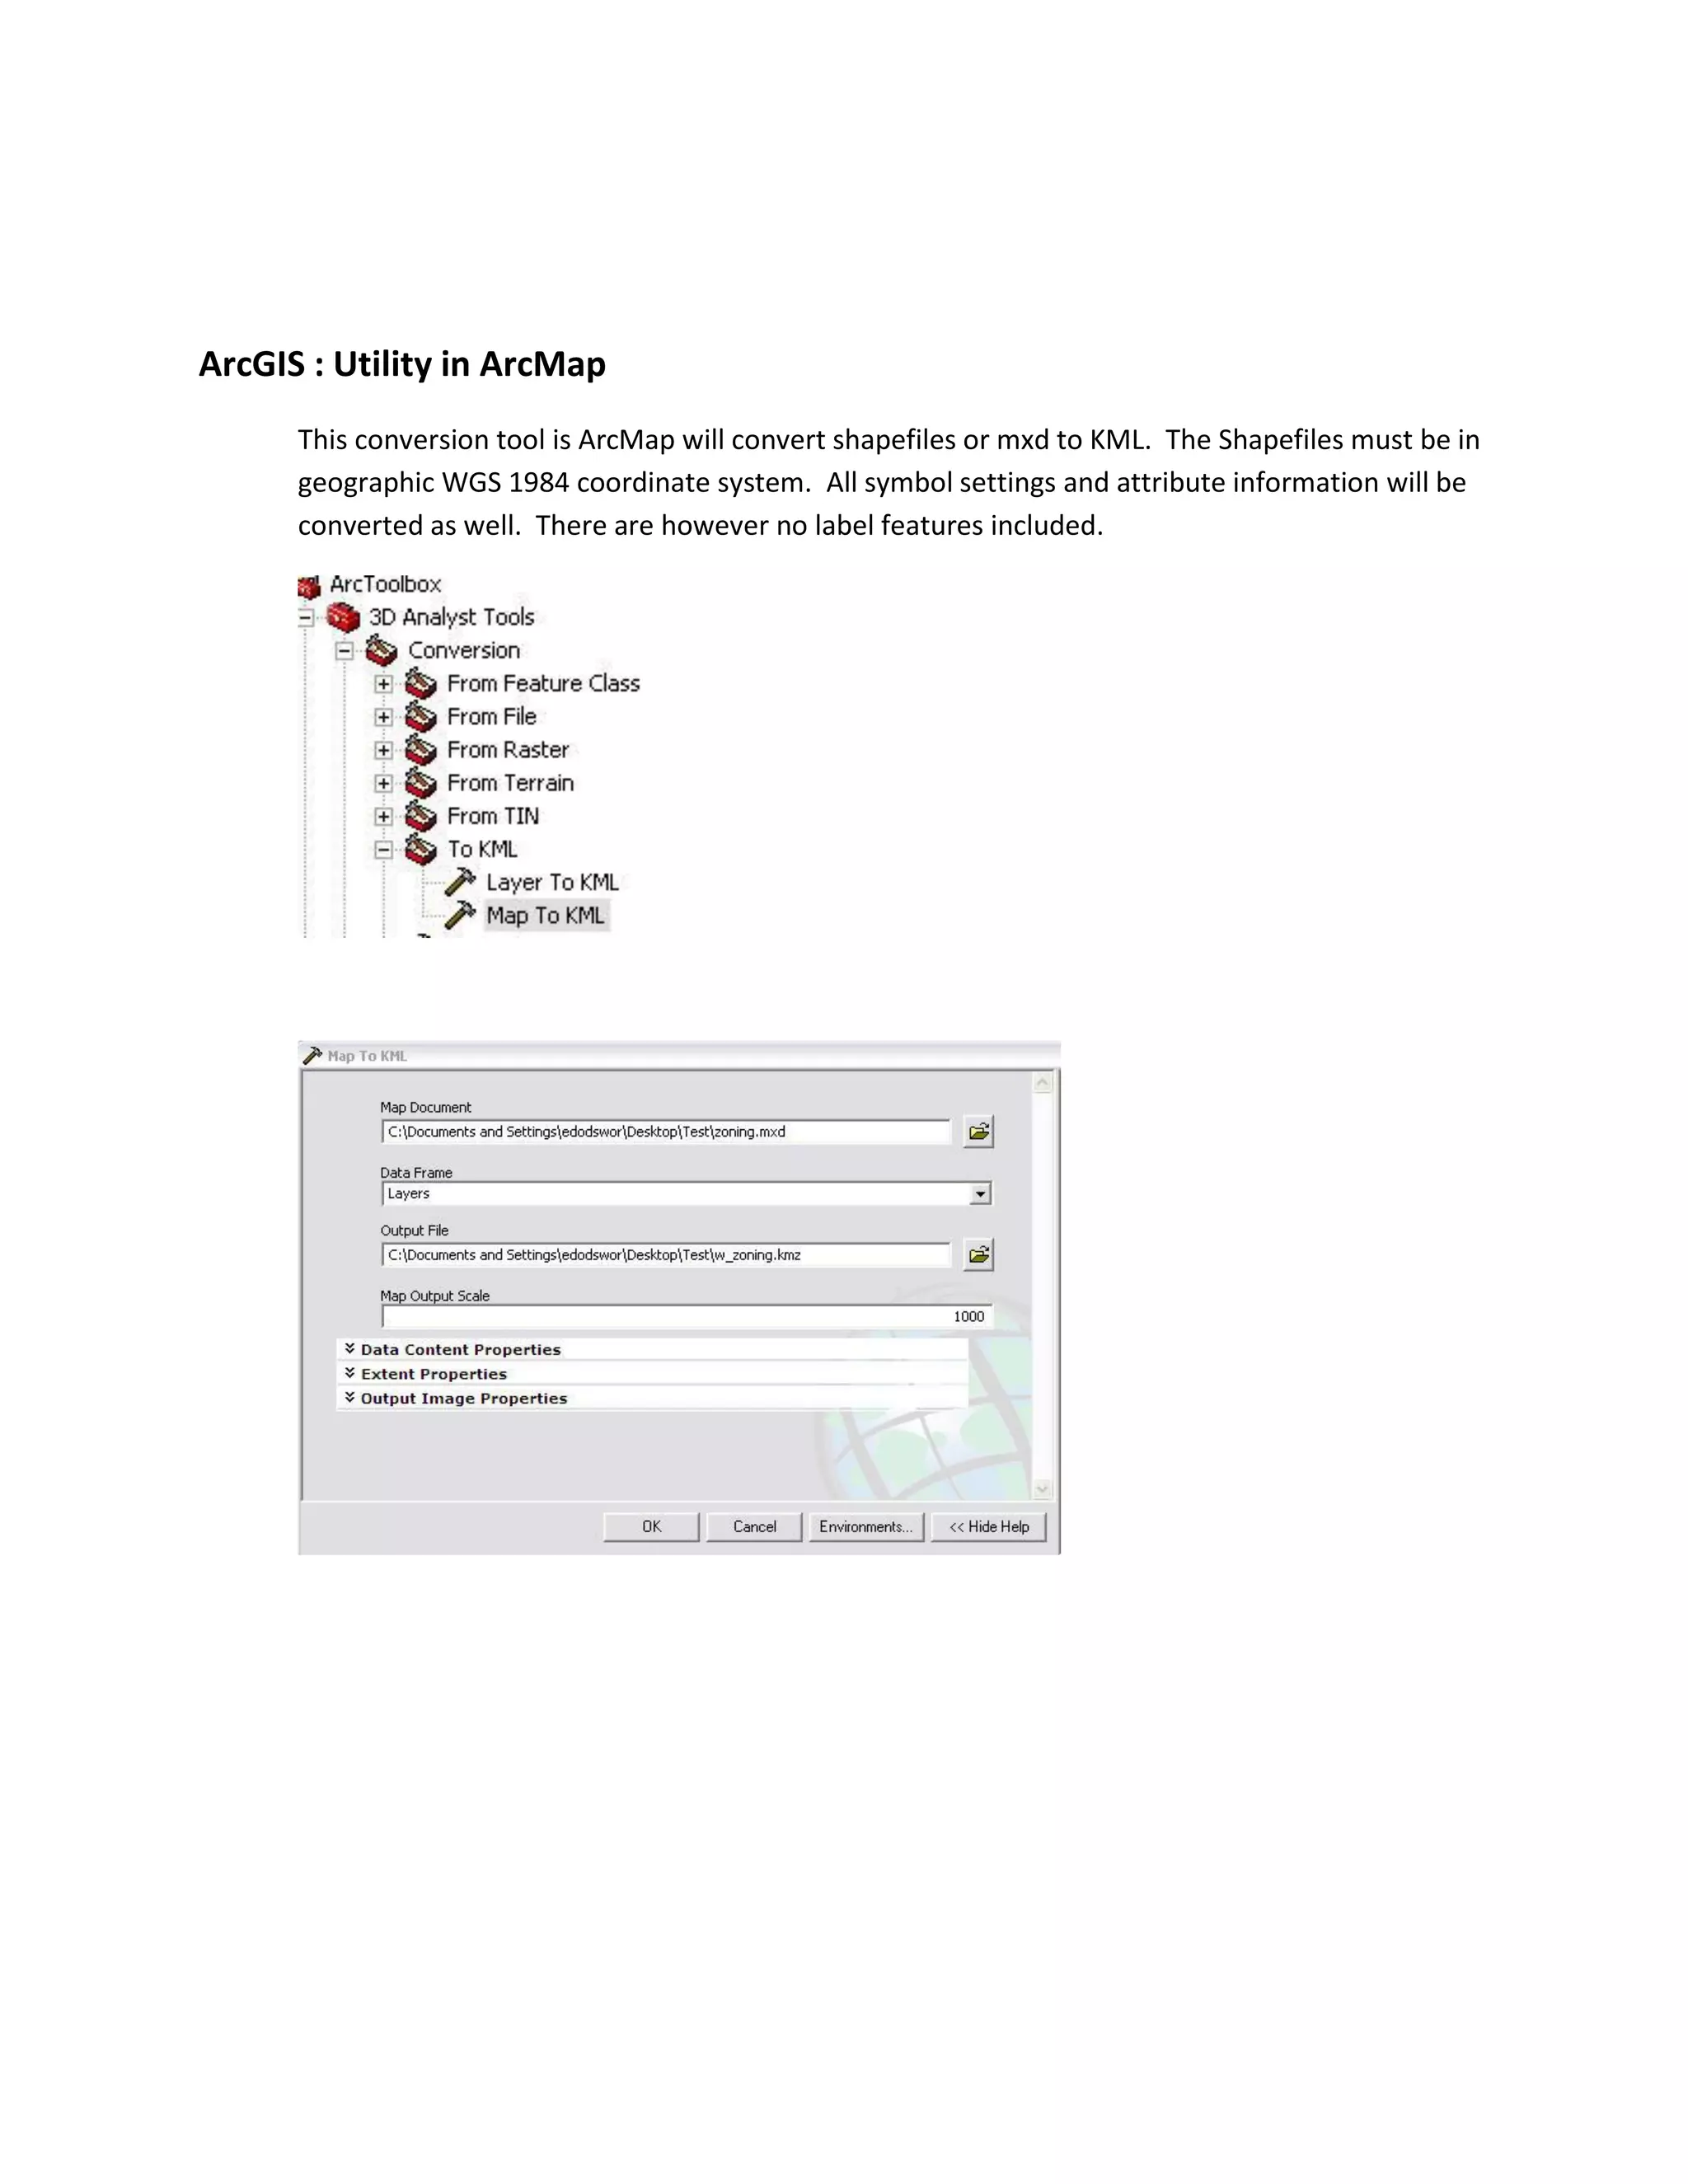
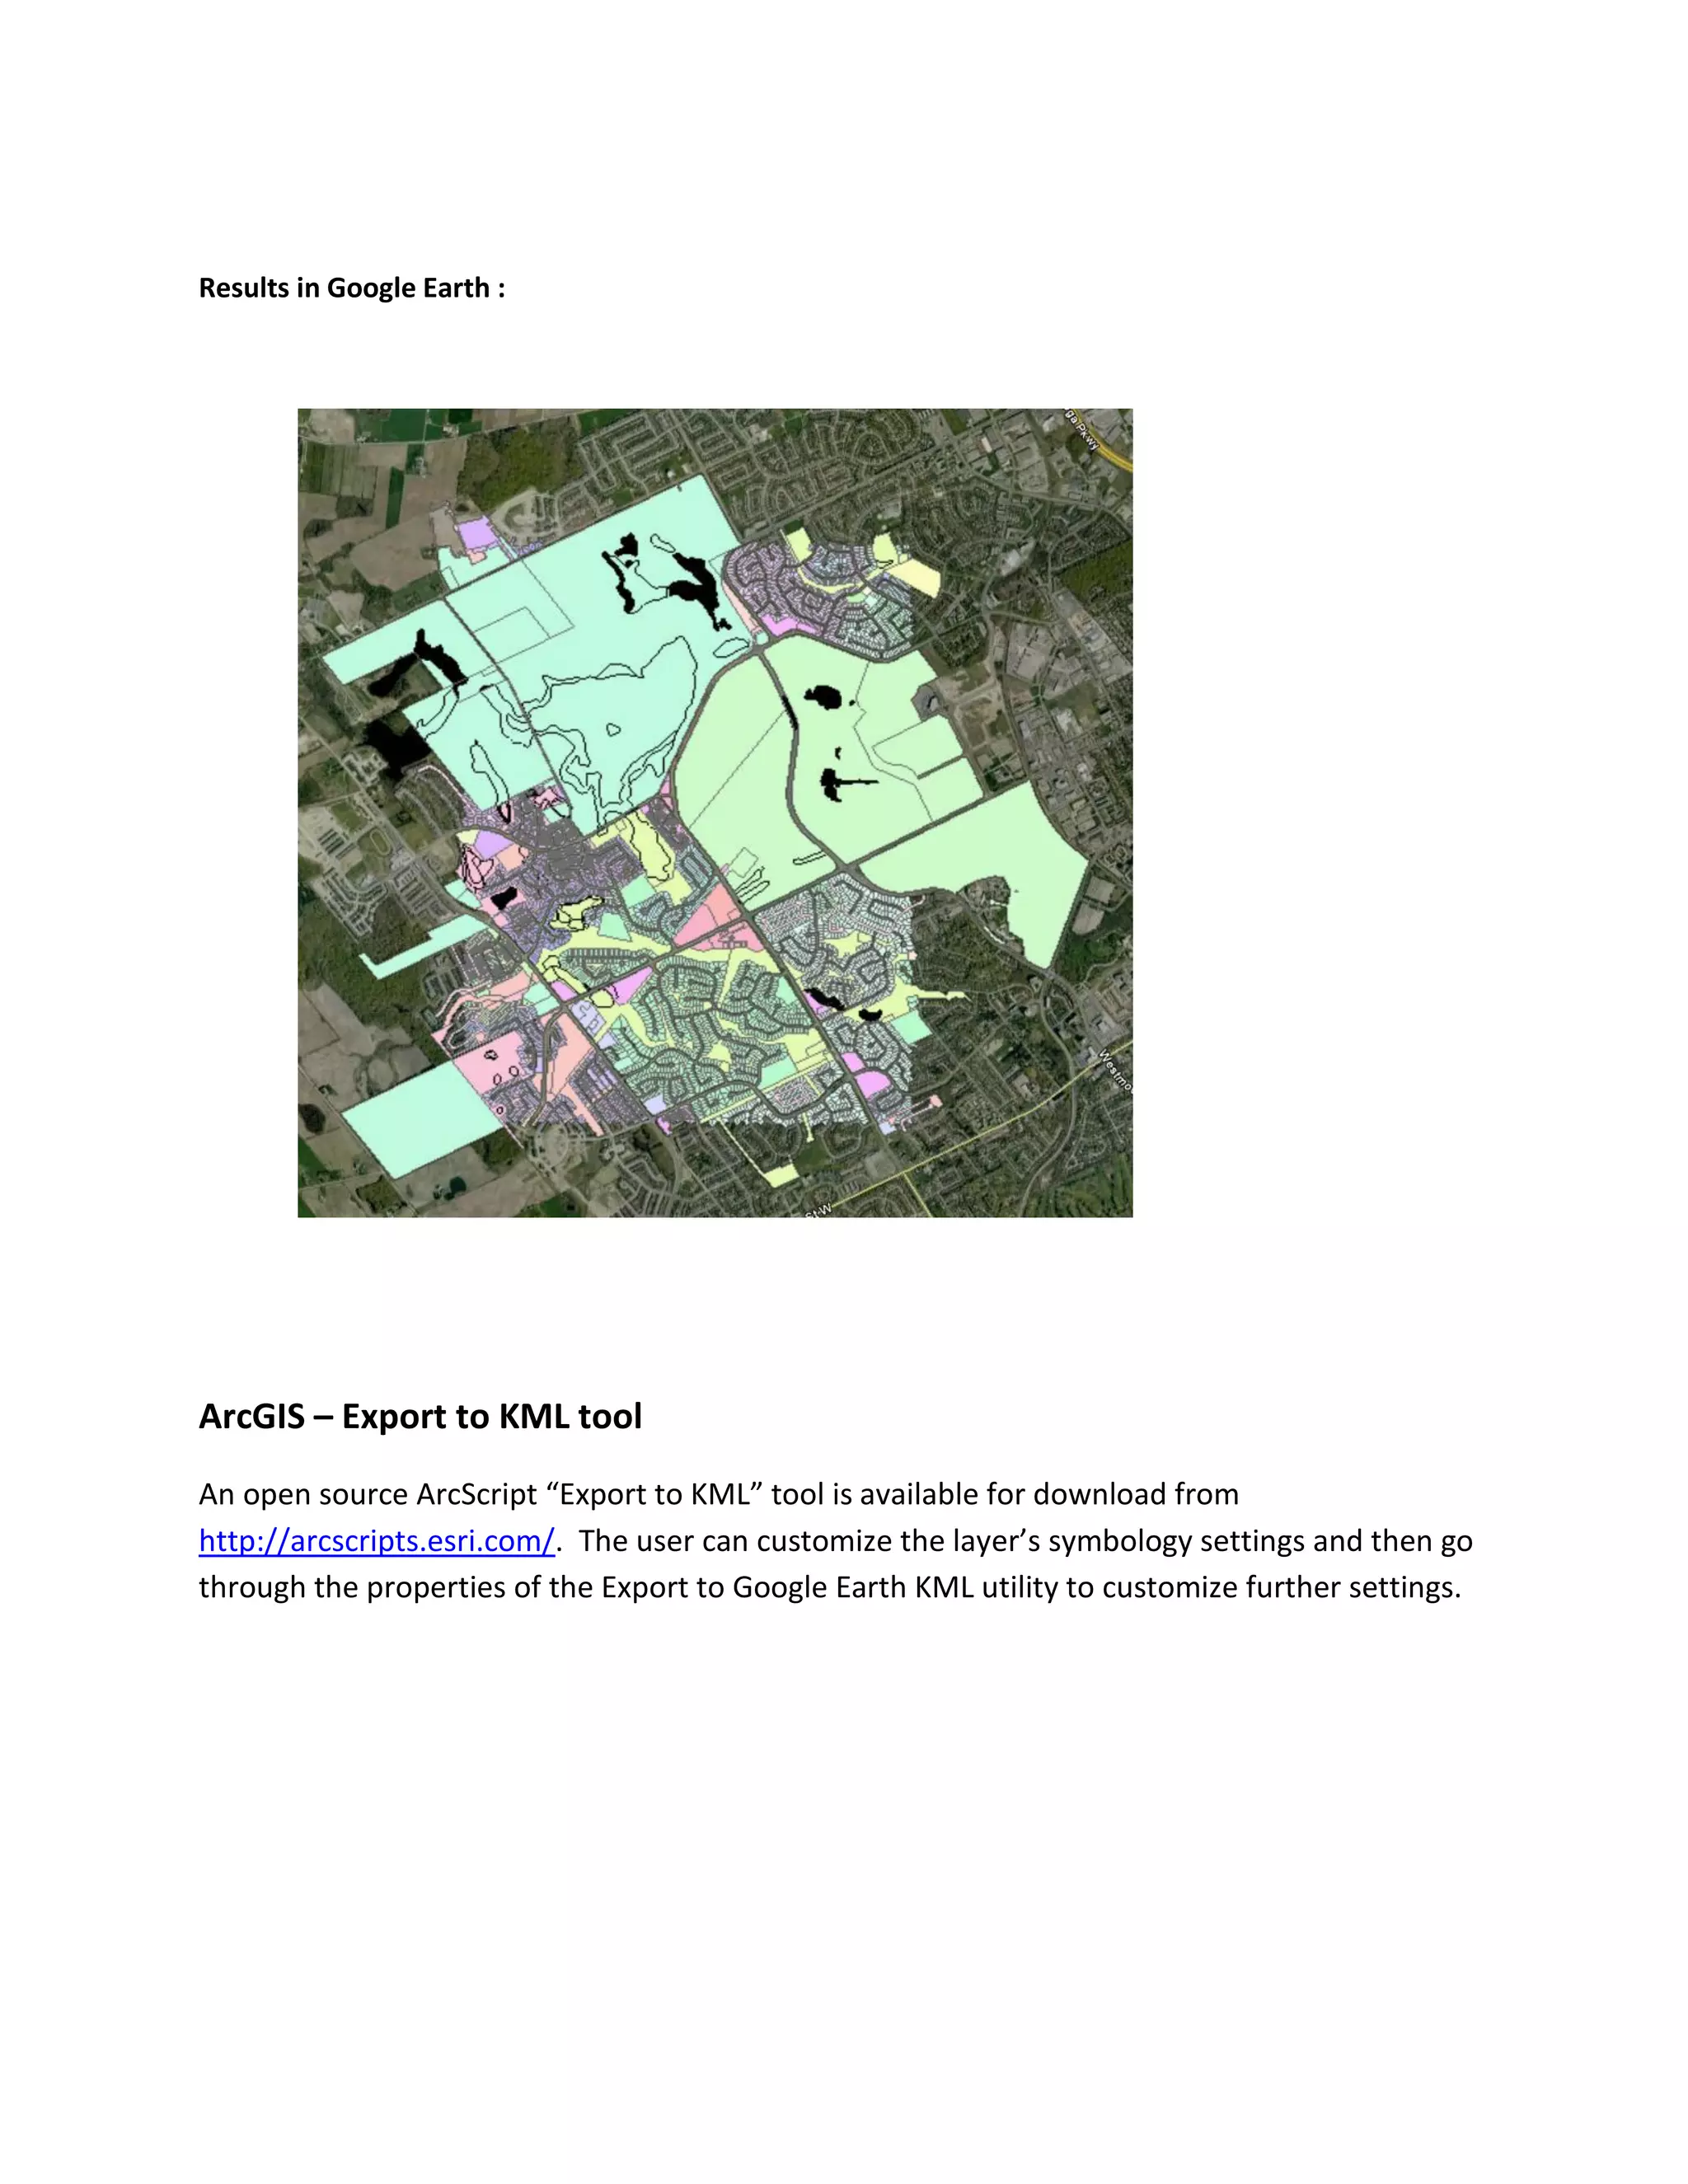
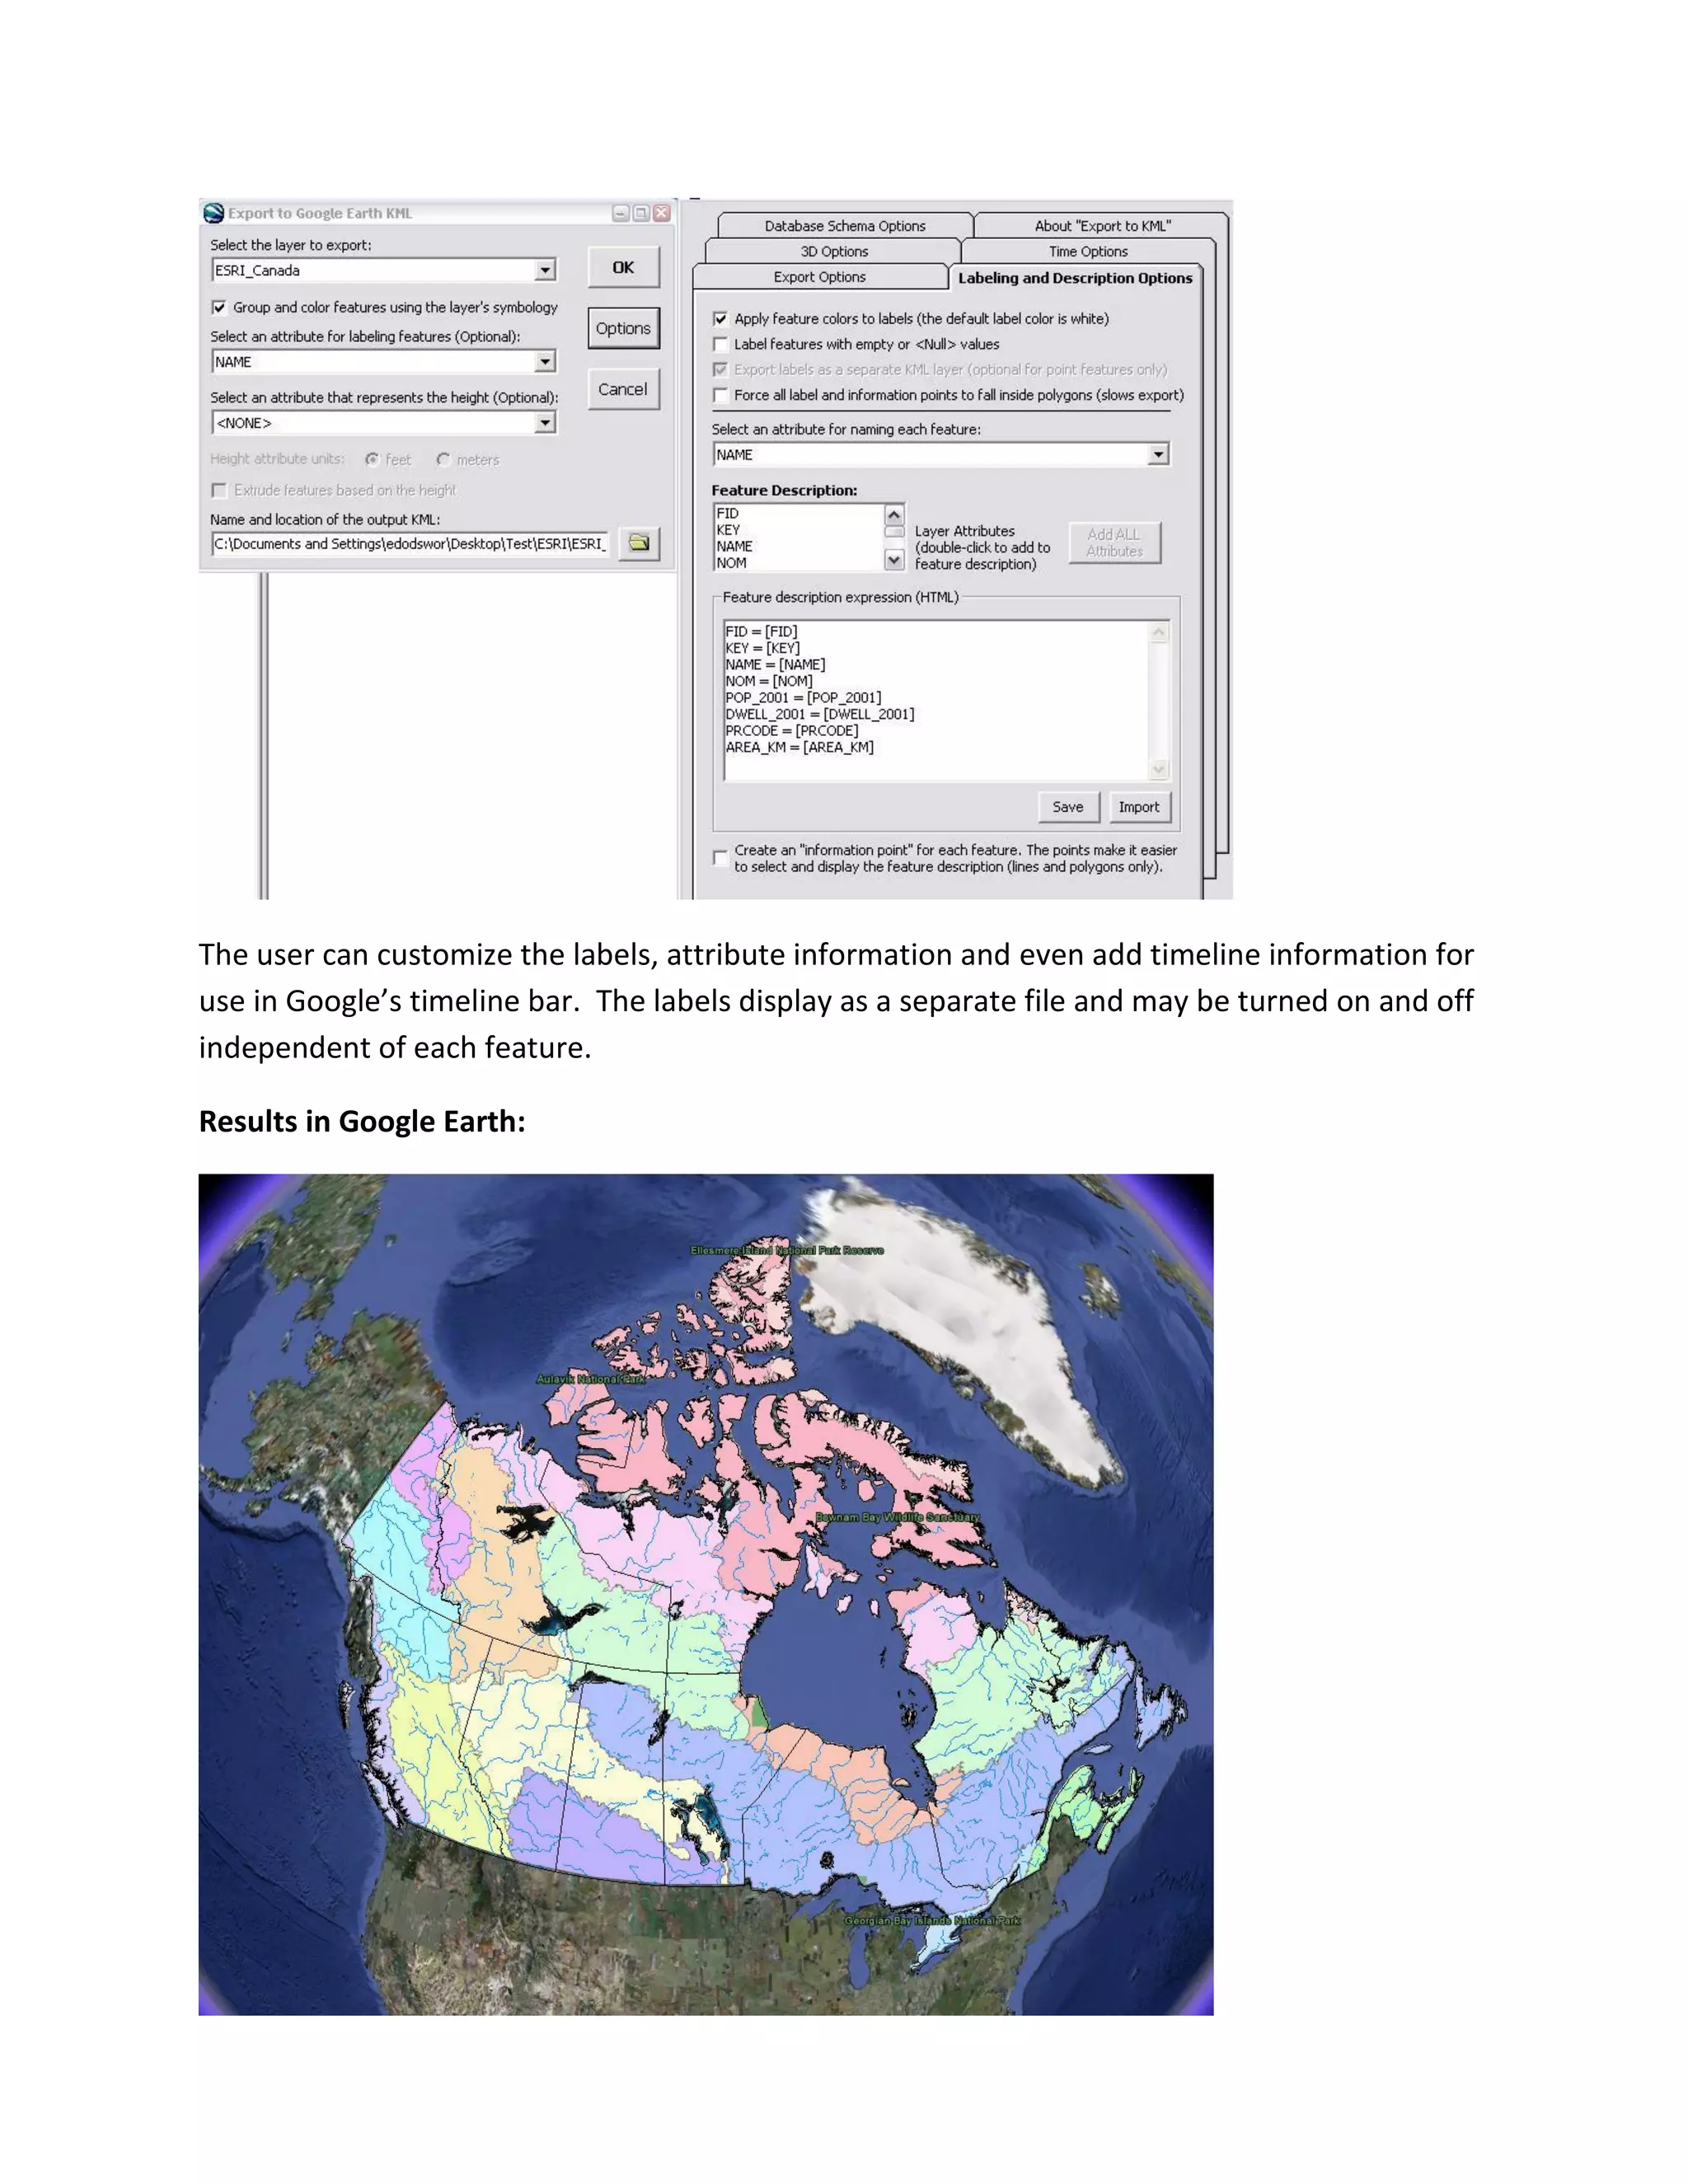
The document summarizes and compares several tools for converting Shapefiles to KML format for use in Google Earth. GeoCommons Finder allows simple online conversion but offers limited customization. Shp2kml is highly recommended as it allows unique and graduated symbology, labels, customized balloons, and projects coordinate systems. Google Earth Pro and ArcGIS conversion tools support symbology and attribute transfer but not labels. Shp2earth allows labels and attribute transfer but not advanced symbology, while the ArcGIS KML export script supports all features including timeline functionality. Overall the tools vary in supported features from simple to full-featured conversions.
Geographic information system and remote sensingchala hailu
ArcMap is where you create maps and access most of the ArcGIS functionality. Remote sensing is an instrument based of observing an object at a far distance without direct contact.
Presentation: This presentation gives a brief introduction to tools in ArcGIS and was designed for the Surface Water Quality Monitoring (SWQM) GIS training hosted by Texas Commission on Environmental Quality (TCEQ) staff.
Training: The goal of the SWQM GIS training course is to introduce beginner and intermediate GIS users within the TCEQ surface water monitoring network to the geospatial software, skills, analyses, and data most often used by water resource professionals. The training features presentations from a range of GIS experts from TCEQ, TPWD, and other organizations.
More information on the training: https://www.tceq.texas.gov/waterquality/monitoring/training
A geographic information system (GIS) is a collection of hardware,
software, geographicdata, and personnel designed to create, store, edit,
manipulate, analyze and display geographically referenced information.
Map Styling Tools and Interactive maps on the web with OpenLayers - Addy Pope...JISC GECO
Presentation given as part of the DevCSI/JISC GECO Open Mapping Workshop which was held at the Electron Club, CCA, Glasgow on Thursday 25th August 2011. The event was connected to the OpenStreetMap State of the Map Scotland event.
Globe-based earth browsers like GoogleEarth have turned web-based cartography into a widely accepted
commodity. This success is based on the three components: The browser software itself, remote sensing
data as a backdrop maps and thematic content layers.
From a GRASS GIS perspective, the ability to communicate thematic content via earth browsers is a
strategic means to quickly communicate findings to very large communities.
This poster describes the current options to compose such thematic content layers by using GRASS GIS:
Loosely coupled Keyhole Markup Language (KML) export functionalities provide the „glue“ for the seamless
integration between the GIS and the earth browser.
Reporting Summary Information of Spatial Datasets and Non-Compliance Issues U...Safe Software
An overview of two groups of FME workspaces implemented at the Mapping and Charting Establishment (MCE) that include the generation of reports in Excel format is presented here. The first group includes data validation and data compliance assessments. An example showing Self Validation of Spatial Data Input from DND Bases using FME Server is presented. The second group, implemented using FME Desktop, includes the creation of statistical reports for some key datasets distributed by MCE. Two examples of FME workspaces are presented here: the first one showing reports created for NRCan CanVec plus charts, and the second one showing reports created for Open Street Map (OSM) data delivered in FGDB format for custom AOIs.
Prepared as part of the IT for Business Intelligence course of MBA @VGSOM, IIT Kharagpur. The tutorial describes how to create an interactive map using the open source software QGIS.
In this exercise you will explore ArcCatalog and learn how it is used within
the wider ArcGIS environment. You will practice the most important functions only. If necessary, additional functions will be introduced later in the course. First, you will familiarize with the interface, then with specific functions such as browsing and exploring data, creating metadata, etc. Finally you will learn that ArcCatalog can be used as a gateway to ArcMap.
The Wisconsin Department of Natural Resources directly
produces the state’s Digital Flood Insurance Rate Maps
(DFIRMs) under FEMA’s Map Modernization Program. This
presentation will discuss how we use an ArcMap 9.2 extension,
Flood Map Desktop 9™ (FMD), to create FEMA-compliant
DFIRM data, metadata, and map deliverables. The FMD tool
has greatly improved our program’s work flow and efficiency.
As we demonstrate the FMD structure and FMD toolbars, we
will discuss geodatabase creation and management, topology,
domain tables, formatting style files, symbology, label creation
and storage, data exporting, and project settings which form the
base templates for our maps.
A presentation and workshop presented at the 2009 Annual Conference of the American Planning Association, New Jersey Chapter. Originally presented at the Bloustein School, Rutgers-New Brunswick. Workshop materials available at http://njgeo.org/presentations/
Guide shared by Ed Sharron, science communications specialist, Inventory and Monitoring, NE Temperate Network, NPS, during 2011 THV summer institute, Place & the Digital Native: Using Technology and Social Media to Teach the Hudson Valley
Charting the Transformation of the Seabed: A Historical Journey along Tunisia...MahdiMadi2
a map showing the evolution of the seabed
along the eastern coast of Tunisia, including the
Kerknah and Djerba islands, between 1886 and 2022
Tools and software used :
• Bathymetric survey maps 1886
• ArcGIS PRO (Data processing software)
• GEBCO (Current Bathymetric data)
• Microsoft Excel
work process :
The first step was to digitize the map. This involves scanning the physical map and converting it into a digital
format that can be viewed and edited on a computer.
• Once the map was digitized, it was imported into the ArcGIS software for further processing.
• ArcGIS is a powerful geographic information system (GIS) software that allows users to analyse, manage, and
display spatial data. It can be used to create maps, perform spatial analysis, and manage geographic data.
• The digitized map was then overlaid with bathymetry data from GEBCO, a web site that provides global
bathymetry data. This allows the examination of changes in the seabed over time and create a map showing
the evolution of the seabed between 1886 and 2022.
• The results were then presented in a Microsoft Excel spreadsheet, allowing for easy visualization and analysis
of the data.
The main focus of this study is to find appropriate and stable solutions for representing the statistical data into map with some special features. This research also includes the comparison between different solutions for specific features. In this research I have found three solutions using three different technologies namely Oracle MapViewer, QGIS and AnyMap which are different solutions with different specialties. Each solution has its own specialty so we can choose any solution for representing the statistical data into maps depending on our criteria’s.
An Integrated Approach to Migrating Mapping Data to Google EarthSafe Software
Learn interesting tips and tricks to get the most out of your GIS, CAD and databases using the flexible functionality of FME Workbench. These tips will show you how to leverage Google Earth in your workplace. Client examples will be used to illustrate key concepts.
Keyhole Markup Language (KML) is an XML notation for expressing geographic annotation and visualization within Internet-based, two-dimensional maps and three-dimensional Earth browsers.
Software Delivery At the Speed of AI: Inflectra Invests In AI-Powered QualityInflectra
In this insightful webinar, Inflectra explores how artificial intelligence (AI) is transforming software development and testing. Discover how AI-powered tools are revolutionizing every stage of the software development lifecycle (SDLC), from design and prototyping to testing, deployment, and monitoring.
Learn about:
• The Future of Testing: How AI is shifting testing towards verification, analysis, and higher-level skills, while reducing repetitive tasks.
• Test Automation: How AI-powered test case generation, optimization, and self-healing tests are making testing more efficient and effective.
• Visual Testing: Explore the emerging capabilities of AI in visual testing and how it's set to revolutionize UI verification.
• Inflectra's AI Solutions: See demonstrations of Inflectra's cutting-edge AI tools like the ChatGPT plugin and Azure Open AI platform, designed to streamline your testing process.
Whether you're a developer, tester, or QA professional, this webinar will give you valuable insights into how AI is shaping the future of software delivery.
Connector Corner: Automate dynamic content and events by pushing a buttonDianaGray10
Here is something new! In our next Connector Corner webinar, we will demonstrate how you can use a single workflow to:
Create a campaign using Mailchimp with merge tags/fields
Send an interactive Slack channel message (using buttons)
Have the message received by managers and peers along with a test email for review
But there’s more:
In a second workflow supporting the same use case, you’ll see:
Your campaign sent to target colleagues for approval
If the “Approve” button is clicked, a Jira/Zendesk ticket is created for the marketing design team
But—if the “Reject” button is pushed, colleagues will be alerted via Slack message
Join us to learn more about this new, human-in-the-loop capability, brought to you by Integration Service connectors.
And...
Speakers:
Akshay Agnihotri, Product Manager
Charlie Greenberg, Host
Neuro-symbolic is not enough, we need neuro-*semantic*Frank van Harmelen
Neuro-symbolic (NeSy) AI is on the rise. However, simply machine learning on just any symbolic structure is not sufficient to really harvest the gains of NeSy. These will only be gained when the symbolic structures have an actual semantics. I give an operational definition of semantics as “predictable inference”.
All of this illustrated with link prediction over knowledge graphs, but the argument is general.
DevOps and Testing slides at DASA ConnectKari Kakkonen
My and Rik Marselis slides at 30.5.2024 DASA Connect conference. We discuss about what is testing, then what is agile testing and finally what is Testing in DevOps. Finally we had lovely workshop with the participants trying to find out different ways to think about quality and testing in different parts of the DevOps infinity loop.
Epistemic Interaction - tuning interfaces to provide information for AI supportAlan Dix
Paper presented at SYNERGY workshop at AVI 2024, Genoa, Italy. 3rd June 2024
https://alandix.com/academic/papers/synergy2024-epistemic/
As machine learning integrates deeper into human-computer interactions, the concept of epistemic interaction emerges, aiming to refine these interactions to enhance system adaptability. This approach encourages minor, intentional adjustments in user behaviour to enrich the data available for system learning. This paper introduces epistemic interaction within the context of human-system communication, illustrating how deliberate interaction design can improve system understanding and adaptation. Through concrete examples, we demonstrate the potential of epistemic interaction to significantly advance human-computer interaction by leveraging intuitive human communication strategies to inform system design and functionality, offering a novel pathway for enriching user-system engagements.
Slack (or Teams) Automation for Bonterra Impact Management (fka Social Soluti...Jeffrey Haguewood
Sidekick Solutions uses Bonterra Impact Management (fka Social Solutions Apricot) and automation solutions to integrate data for business workflows.
We believe integration and automation are essential to user experience and the promise of efficient work through technology. Automation is the critical ingredient to realizing that full vision. We develop integration products and services for Bonterra Case Management software to support the deployment of automations for a variety of use cases.
This video focuses on the notifications, alerts, and approval requests using Slack for Bonterra Impact Management. The solutions covered in this webinar can also be deployed for Microsoft Teams.
Interested in deploying notification automations for Bonterra Impact Management? Contact us at sales@sidekicksolutionsllc.com to discuss next steps.
UiPath Test Automation using UiPath Test Suite series, part 3DianaGray10
Welcome to UiPath Test Automation using UiPath Test Suite series part 3. In this session, we will cover desktop automation along with UI automation.
Topics covered:
UI automation Introduction,
UI automation Sample
Desktop automation flow
Pradeep Chinnala, Senior Consultant Automation Developer @WonderBotz and UiPath MVP
Deepak Rai, Automation Practice Lead, Boundaryless Group and UiPath MVP
Key Trends Shaping the Future of Infrastructure.pdfCheryl Hung
Keynote at DIGIT West Expo, Glasgow on 29 May 2024.
Cheryl Hung, ochery.com
Sr Director, Infrastructure Ecosystem, Arm.
The key trends across hardware, cloud and open-source; exploring how these areas are likely to mature and develop over the short and long-term, and then considering how organisations can position themselves to adapt and thrive.
JMeter webinar - integration with InfluxDB and GrafanaRTTS
Watch this recorded webinar about real-time monitoring of application performance. See how to integrate Apache JMeter, the open-source leader in performance testing, with InfluxDB, the open-source time-series database, and Grafana, the open-source analytics and visualization application.
In this webinar, we will review the benefits of leveraging InfluxDB and Grafana when executing load tests and demonstrate how these tools are used to visualize performance metrics.
Length: 30 minutes
Session Overview
-------------------------------------------
During this webinar, we will cover the following topics while demonstrating the integrations of JMeter, InfluxDB and Grafana:
- What out-of-the-box solutions are available for real-time monitoring JMeter tests?
- What are the benefits of integrating InfluxDB and Grafana into the load testing stack?
- Which features are provided by Grafana?
- Demonstration of InfluxDB and Grafana using a practice web application
To view the webinar recording, go to:
https://www.rttsweb.com/jmeter-integration-webinar
JMeter webinar - integration with InfluxDB and Grafana
Km lconversionprograms
1. Conversion of Shapefile to KML : An overview of tools available
By Eva Dodsworth, April 17, 2009
For Google Earth users interested in converting their Shapefiles to KML format, I have researched many tools and programs available and have described and summarized their features below. You will see that they vary in terms of output resolution, symbol and label customization and accessibility. Most require the shapefile to be geographic WGS 1984 coordinate system as that is what is supported by Google Earth. I use ArcGIS for the coordinate conversion, but there are open source programs that will do this as well, and there are also several free converters available online. All products are free but may require proprietary software to run, such as ArcGIS or Google Earth Pro.
Product
Advanced symbology (define unique or graduate value)
Labels
Attribute Table Transfer
Customize Balloons
Notes
Geocommons : Finder
This is an online tool
www.geocommons.com
No
No
Yes
No
Need to register with site.
SHP2KML
This is a downloadable stand-alone product
http://www.zonums.com/shp2kml. html
Yes
Yes – all or none
Yes – user can select variables
Yes
I highly recommend this product.
Program able to change projection and datum.
Product has problems combing usage of labels and advanced symbology
Google Earth Pro
This is a $400 upgrade to Google Earth
Yes
No
Yes – all features are transferred
No
Shp2Earth
Plug-in for MapWindow GIS
No
Yes
Yes – user can select variables
Yes
Program is able to change projection and datum
2. (open source)
www.mapwindow.org
ArcGIS
Conversion Tool within 3D Analyst
Yes
No
Yes
No
ArcGIS ArcScript : Export to KML tool
ArcScript available from : http://arcscripts.esri.com/
Yes
Yes
Yes
No
I highly recommend this product.
Excellent Results
GeoCommons : Finder : www.geocommons.com
GeoCommons Finder is a browser-based application for finding, organizing and sharing geospatial data. Users can upload their own GIS files and use the tools available in the application to convert to other formats such as .shp, .csv and KML. GeoCommons also has a mapping component to it called the GeoCommons Mapper where users can map the data they have uploaded, or data that others have uploaded. This is a very simple program to use, but it also offers only a very simple conversion tool, with very little user input for kml templates. Once in GE, the user can define a single symbol colour. It automatically offers an icon for every single feature, but this can be removed in GE’s layer properties.
The process of uploading your Shapefile to their online database is very simple.
3. Once uploaded, you can access your stored layers and then download them to your local computer in the file format that you would like.
Results in Google Earth :
The resulting KML files offer a high resolution display of features.
4. Shp2kml : http://www.zonums.com/shp2kml.html
Shp2kml is an excellent stand-alone application that transforms Shapefiles into KML files. The product includes a projection and datum converter as well, for those files that are not in the geographic WGS 1984 coordinate system.
The program offers several advanced features that others don’t : unique and gradual values for themed features (i.e choropleth mapping) :
Mapping by Unique Value Mapping by Gradiant Value
Labels :
A note about labels : In order to activate the label feature, the product displays icons for every feature. This icon can be turned off in Google Earth in the layer’s properties, but it will remove all unique and graduate value symbology. Therefore, I do not recommend labelling features when using advanced symbology.
5. And customized balloons:
The application also offers a preview of the map as well as access to the attribute table.
Each feature has associated icon. These icons can be removed in the layer property field but all advanced symbology will convert to single symbols.
The ‘balloon’ where attribute information appears when features on the map are clicked are completely customizable. Users can select the attribute fields, and the colours of the balloon.
6. Results in Google Earth :
The resulting KML files offer a high resolution display of features.
Google Earth Pro
Google Earth Pro, a $400 upgrade to Google Earth, supports a wide variety of geospatial files, including Shapefiles. Users can add Shapefiles to the virtual globe (in geographic WGS 1984 coordinate system) and apply a template style to it which selects the name field and symbol colours.
7. Both single symbols and thematic mapping are supported. Numeric ranges can be user-specified and can be added into individual folders so it is visible in Google Earth Pro’s table of contents.
Google Earth Pro does not support labelling, nor does it offer customized balloon information and settings.
8. Results in Google Earth :
To create a KML file from this shapefile, simply right click on the layer - and “save place as” will save to KMZ format (compressed KML format).
Shp2earth : www.mapwindow.org
Shp2earth is a plug-in for open source MapWindow GIS. An evaluation copy is available for free which allows the conversion of up to 500 features. Users can add Shapefiles into MapWindow GIS in any coordinate system, customize the colours, symbols and labels and convert to a geographic WGS 1984 KML file. Unlike other utilities, this one allows users to transfer the label information and in Google Earth have the choice to keep the labels turned on or off. Users can also select individual labels to appear. Unfortunately, it doesn’t support thematic mapping (advanced symbology).
10. ArcGIS : Utility in ArcMap
This conversion tool is ArcMap will convert shapefiles or mxd to KML. The Shapefiles must be in geographic WGS 1984 coordinate system. All symbol settings and attribute information will be converted as well. There are however no label features included.
11. Results in Google Earth :
ArcGIS – Export to KML tool
An open source ArcScript “Export to KML” tool is available for download from http://arcscripts.esri.com/. The user can customize the layer’s symbology settings and then go through the properties of the Export to Google Earth KML utility to customize further settings.
12. The user can customize the labels, attribute information and even add timeline information for use in Google’s timeline bar. The labels display as a separate file and may be turned on and off independent of each feature.
Results in Google Earth: