Download as PDF, PPTX
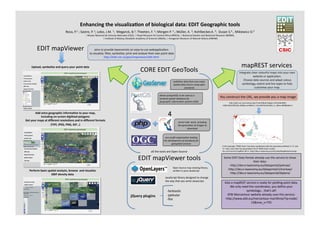


This document describes EDIT Geographic tools, which aim to provide taxonomists an easy-to-use web application to visualize, filter, symbolize, print, and analyze their own point data. It discusses several tools including the EDIT mapViewer, mapREST services, and CORE EDIT GeoTools that allow users to upload, symbolize, query, and perform basic spatial analysis on their point data. All of the tools are open source.