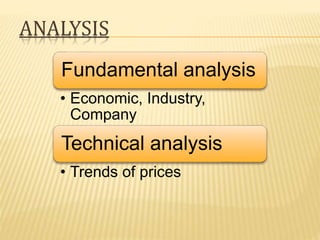
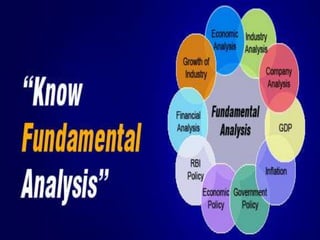
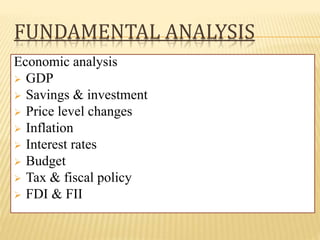
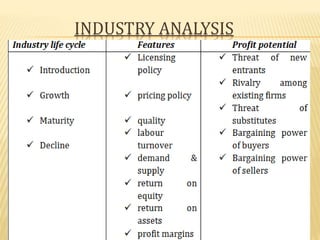
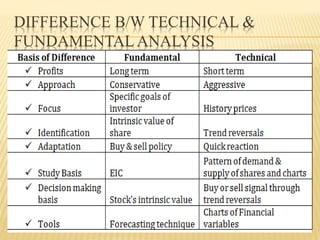
SECURITY ANALYSIS
VEDAPRADHA.R
SECURITY ANALYSIS
ANALYSIS
Fundamental analysis
• Economic, Industry,
Company
Technical analysis
• Trends of prices
FUNDAMENTAL ANALYSIS
Economic analysis
 GDP
 Savings & investment
 Price level changes
 Inflation
 Interest rates
 Budget
 Tax & fiscal policy
 FDI & FII
INDUSTRY ANALYSIS
COMPANY ANALYSIS
Balance sheet
Profit & loss a/c
Comparative statement analysis
Trend analysis
Fund flow analysis
Cash flow analysis
Ratio analysis
TECHNICAL ANALYSIS
Assumptions
 The share price is determined by supply
and demand.
 Information about the shares is already
absorbed in the market.
 Share prices move in a trend in
directions up, down or sideways.
 Market behaviour is based on historical
analysis.
USES OF TECHNICAL ANALYSIS
 It helps to forecast right information about
buying & selling security from the market.
 Identifies periods where one can expect a
quick increase or decrease in the prices.
 IT can be applied to various markets
including commodity markets, currency
markets.
LIMITATIONS
 Always relying on history doesn’t give perfect
results.
 It only gives trend reversal.
 Interpretation of data through charts is
difficult.
 Too many charts in technical analysis are
confusing.
 Indian share market is too volatile; beating
the market by using any one analysis is not
possible.
DOW JONES THEORY
Charles Dow (Founder of the Dow Jones Company and
editor of Wall street journal) believed that market trends
always forecasts the trend in economy.
Assumptions:
 It is not possible for a single individual to influence the
major trend of the market.
 In the long run the averages discount everything.
 It will not give time frame for price target.
 It is a toll to understand market rather than beat the market.
 It is concerned about trends and has no forecasting value.
TRENDS IN PRICE MOVEMENTS
 Primary trend
 Secondary trend
 Minor trend
CHARTISM
Technical analysis uses variety of charts to determine
the future direction of the price movements.
Graphical representation of stock prices gives better
& fast analysis.
Uses:
 Spots the current trend for buying & selling.
 Indicates the probable future action of the market by
projection.
 Shows the past historic movement.
 Indicates the important areas of support & resistance.
IMPORTANT PRICES IN A DAY
Opening price
Lowest price
Closing price
Highest price
TYPES OF CHARTS
Line chart
Bar chart
Point & figure chart
Candlestick chart
ADVANCED DECLINE THEORY
 The advanced decline is referred to the
breadth of the market.
Measurement involves two steps:
Calculate the number of net
advances/declines on daily basis.
Obtain the breadth of the market by
cumulating daily net advances/declines.
DIFFERENCE B/W TECHNICAL &
FUNDAMENTAL ANALYSIS
SECURITY ANALYSIS

SECURITY ANALYSIS

  • 1.
  • 3.
  • 4.
    ANALYSIS Fundamental analysis • Economic,Industry, Company Technical analysis • Trends of prices
  • 6.
    FUNDAMENTAL ANALYSIS Economic analysis GDP  Savings & investment  Price level changes  Inflation  Interest rates  Budget  Tax & fiscal policy  FDI & FII
  • 7.
  • 8.
    COMPANY ANALYSIS Balance sheet Profit& loss a/c Comparative statement analysis Trend analysis Fund flow analysis Cash flow analysis Ratio analysis
  • 9.
    TECHNICAL ANALYSIS Assumptions  Theshare price is determined by supply and demand.  Information about the shares is already absorbed in the market.  Share prices move in a trend in directions up, down or sideways.  Market behaviour is based on historical analysis.
  • 10.
    USES OF TECHNICALANALYSIS  It helps to forecast right information about buying & selling security from the market.  Identifies periods where one can expect a quick increase or decrease in the prices.  IT can be applied to various markets including commodity markets, currency markets.
  • 11.
    LIMITATIONS  Always relyingon history doesn’t give perfect results.  It only gives trend reversal.  Interpretation of data through charts is difficult.  Too many charts in technical analysis are confusing.  Indian share market is too volatile; beating the market by using any one analysis is not possible.
  • 12.
    DOW JONES THEORY CharlesDow (Founder of the Dow Jones Company and editor of Wall street journal) believed that market trends always forecasts the trend in economy. Assumptions:  It is not possible for a single individual to influence the major trend of the market.  In the long run the averages discount everything.  It will not give time frame for price target.  It is a toll to understand market rather than beat the market.  It is concerned about trends and has no forecasting value.
  • 13.
    TRENDS IN PRICEMOVEMENTS  Primary trend  Secondary trend  Minor trend
  • 14.
    CHARTISM Technical analysis usesvariety of charts to determine the future direction of the price movements. Graphical representation of stock prices gives better & fast analysis. Uses:  Spots the current trend for buying & selling.  Indicates the probable future action of the market by projection.  Shows the past historic movement.  Indicates the important areas of support & resistance.
  • 15.
    IMPORTANT PRICES INA DAY Opening price Lowest price Closing price Highest price
  • 16.
    TYPES OF CHARTS Linechart Bar chart Point & figure chart Candlestick chart
  • 17.
    ADVANCED DECLINE THEORY The advanced decline is referred to the breadth of the market. Measurement involves two steps: Calculate the number of net advances/declines on daily basis. Obtain the breadth of the market by cumulating daily net advances/declines.
  • 18.
    DIFFERENCE B/W TECHNICAL& FUNDAMENTAL ANALYSIS

Editor's Notes

  • #9 Finance function refers to all the activities of a company with respect to financial management.