TECHNICAL ANALYSIS
Security Analysisand Portfolio Management
(SAPM)
6th
Semester
Bachelors of Business administration (BBA)
Bangalore University Sudhakaran T, M.com
Assistant Professor
Department of commerce
Tapasya PU & Degree
College
MODULE-4
2.
INTRODUCTION TO
TECHNICAL ANALYSIS
Imagineyou're planning to invest in a stock but
don’t have access to the company’s financial
reports. Instead of digging through balance
sheets, you open a price chart and notice the
stock has been steadily rising for weeks. This is
where Technical Analysis comes in — it helps
investors like us make smart decisions by
studying past price movements, patterns, and
trading volumes. Just like weather forecasting
uses historical data to predict future conditions,
technical analysis uses market behavior to
anticipate future price trends.
3.
MEANING OF
TECHNICAL ANALYSIS
TechnicalAnalysis is the method of
evaluating securities by analyzing past
market data, primarily price and volume, to
forecast future price movements. It is based
on the assumption that:
• Market prices reflect all known
information (efficient pricing).
• Prices move in trends, and these trends
persist over time.
• Historical patterns tend to repeat, due to
market psychology and investor behavior.
4.
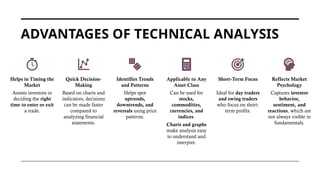
ADVANTAGES OF TECHNICALANALYSIS
Helps in Timing the
Market
Assists investors in
deciding the right
time to enter or exit
a trade.
Quick Decision-
Making
Based on charts and
indicators, decisions
can be made faster
compared to
analyzing financial
statements.
Identifies Trends
and Patterns
Helps spot
uptrends,
downtrends, and
reversals using price
patterns.
Applicable to Any
Asset Class
Can be used for
stocks,
commodities,
currencies, and
indices.
Charts and graphs
make analysis easy
to understand and
interpret.
Short-Term Focus
Ideal for day traders
and swing traders
who focus on short-
term profits.
Reflects Market
Psychology
Captures investor
behavior,
sentiment, and
reactions, which are
not always visible in
fundamentals.
5.
ASSUMPTIONS OF
TECHNICAL ANALYSIS
•Market Discounts Everything
All information (economic, political,
fundamental, psychological) is already
reflected in the stock price.
• Prices Move in Trends
Stock prices follow identifiable trends
(uptrend, downtrend, or sideways), and once
a trend is established, it is likely to continue.
• History Repeats Itself
Price patterns and market movements tend to
repeat over time due to recurring investor
behavior and sentiment.
• Emotions Influence the Market
Investor psychology such as fear, greed, and
panic can influence price movement, and
technical analysis tries to capture this through
charts.
6.
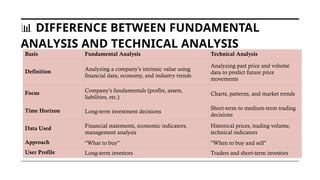
📊 DIFFERENCE BETWEENFUNDAMENTAL
ANALYSIS AND TECHNICAL ANALYSIS
Basis Fundamental Analysis Technical Analysis
Definition Analyzing a company’s intrinsic value using
financial data, economy, and industry trends
Analyzing past price and volume
data to predict future price
movements
Focus Company’s fundamentals (profits, assets,
liabilities, etc.)
Charts, patterns, and market trends
Time Horizon Long-term investment decisions
Short-term to medium-term trading
decisions
Data Used Financial statements, economic indicators,
management analysis
Historical prices, trading volume,
technical indicators
Approach "What to buy" "When to buy and sell"
User Profile Long-term investors Traders and short-term investors
7.
CHARTING TECHNICAL
ANALYSIS
• Chartingis a fundamental tool
used in Technical Analysis to
visualize historical price
movements and identify trends,
patterns, and potential entry or
exit points for investors and
traders.
8.
TYPES OF CHARTS
USEDIN
TECHNICAL
ANALYSIS
• Line Chart
A simple chart that plots closing prices over a specified time period, connected
by a continuous line.
Use: Provides an overall view of price trends over time.
• Bar Chart
9.
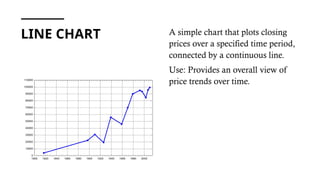
LINE CHART Asimple chart that plots closing
prices over a specified time period,
connected by a continuous line.
Use: Provides an overall view of
price trends over time.
10.
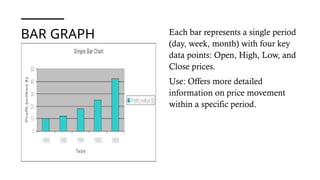
BAR GRAPH Eachbar represents a single period
(day, week, month) with four key
data points: Open, High, Low, and
Close prices.
Use: Offers more detailed
information on price movement
within a specific period.
11.
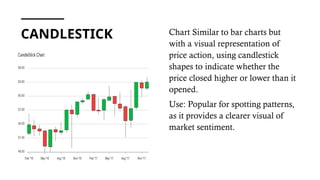
CANDLESTICK Chart Similarto bar charts but
with a visual representation of
price action, using candlestick
shapes to indicate whether the
price closed higher or lower than it
opened.
Use: Popular for spotting patterns,
as it provides a clearer visual of
market sentiment.
12.
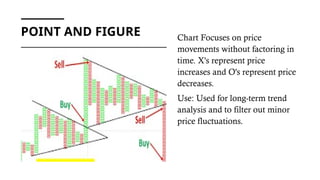
POINT AND FIGUREChart Focuses on price
movements without factoring in
time. X's represent price
increases and O's represent price
decreases.
Use: Used for long-term trend
analysis and to filter out minor
price fluctuations.
13.
COMMON TECHNICAL INDICATORSIN TECHNICAL
ANALYSIS
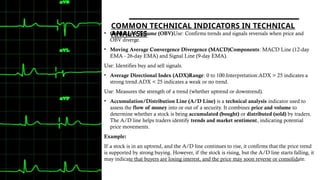
• On-Balance Volume (OBV)Use: Confirms trends and signals reversals when price and
OBV diverge.
• Moving Average Convergence Divergence (MACD)Components: MACD Line (12-day
EMA - 26-day EMA) and Signal Line (9-day EMA).
Use: Identifies buy and sell signals.
• Average Directional Index (ADX)Range: 0 to 100.Interpretation:ADX > 25 indicates a
strong trend.ADX < 25 indicates a weak or no trend.
Use: Measures the strength of a trend (whether uptrend or downtrend).
• Accumulation/Distribution Line (A/D Line) is a technical analysis indicator used to
assess the flow of money into or out of a security. It combines price and volume to
determine whether a stock is being accumulated (bought) or distributed (sold) by traders.
The A/D line helps traders identify trends and market sentiment, indicating potential
price movements.
Example:
If a stock is in an uptrend, and the A/D line continues to rise, it confirms that the price trend
is supported by strong buying. However, if the stock is rising, but the A/D line starts falling, it
may indicate that buyers are losing interest, and the price may soon reverse or consolidate.
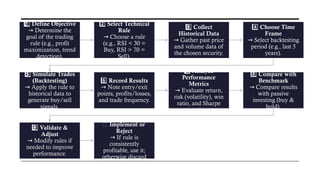
1 ️
1️⃣Define Objective
Determinethe
→
goal of the trading
rule (e.g., profit
maximization, trend
detection).
2️⃣Select Technical
Rule
Choose a rule
→
(e.g., RSI < 30 =
Buy, RSI > 70 =
Sell).
3 ️
3️⃣Collect
Historical Data
Gather past price
→
and volume data of
the chosen security.
4️⃣Choose Time
Frame
Select backtesting
→
period (e.g., last 5
years).
5 ️
5️⃣Simulate Trades
(Backtesting)
Apply the rule to
→
historical data to
generate buy/sell
signals.
6️⃣Record Results
Note entry/exit
→
points, profits/losses,
and trade frequency.
7 ️
7️⃣Analyze
Performance
Metrics
Evaluate return,
→
risk (volatility), win
ratio, and Sharpe
ratio.
8️⃣Compare with
Benchmark
Compare results
→
with passive
investing (buy &
hold).
9 ️
9️⃣Validate &
Adjust
Modify rules if
→
needed to improve
performance.
🔟 Implement or
Reject
If rule is
→
consistently
profitable, use it;
otherwise discard
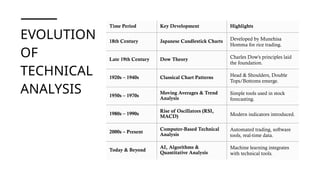
16.
EVOLUTION
OF
TECHNICAL
ANALYSIS
Time Period KeyDevelopment Highlights
18th Century Japanese Candlestick Charts Developed by Munehisa
Homma for rice trading.
Late 19th Century Dow Theory Charles Dow's principles laid
the foundation.
1920s – 1940s Classical Chart Patterns Head & Shoulders, Double
Tops/Bottoms emerge.
1950s – 1970s
Moving Averages & Trend
Analysis
Simple tools used in stock
forecasting.
1980s – 1990s
Rise of Oscillators (RSI,
MACD) Modern indicators introduced.
2000s – Present
Computer-Based Technical
Analysis
Automated trading, software
tools, real-time data.
Today & Beyond
AI, Algorithms &
Quantitative Analysis
Machine learning integrates
with technical tools.
17.
CONCLUSION
• Just likehow we check weather forecasts before planning our day, investors use technical
analysis to forecast market trends before making financial decisions. It doesn’t guarantee
success, but it helps us make informed and timely choices by studying past patterns, prices, and
market signals.
By using charts and indicators wisely, we can reduce emotional decisions and increase our
chances of profitable investments — just like checking traffic before starting a journey helps
avoid delays.