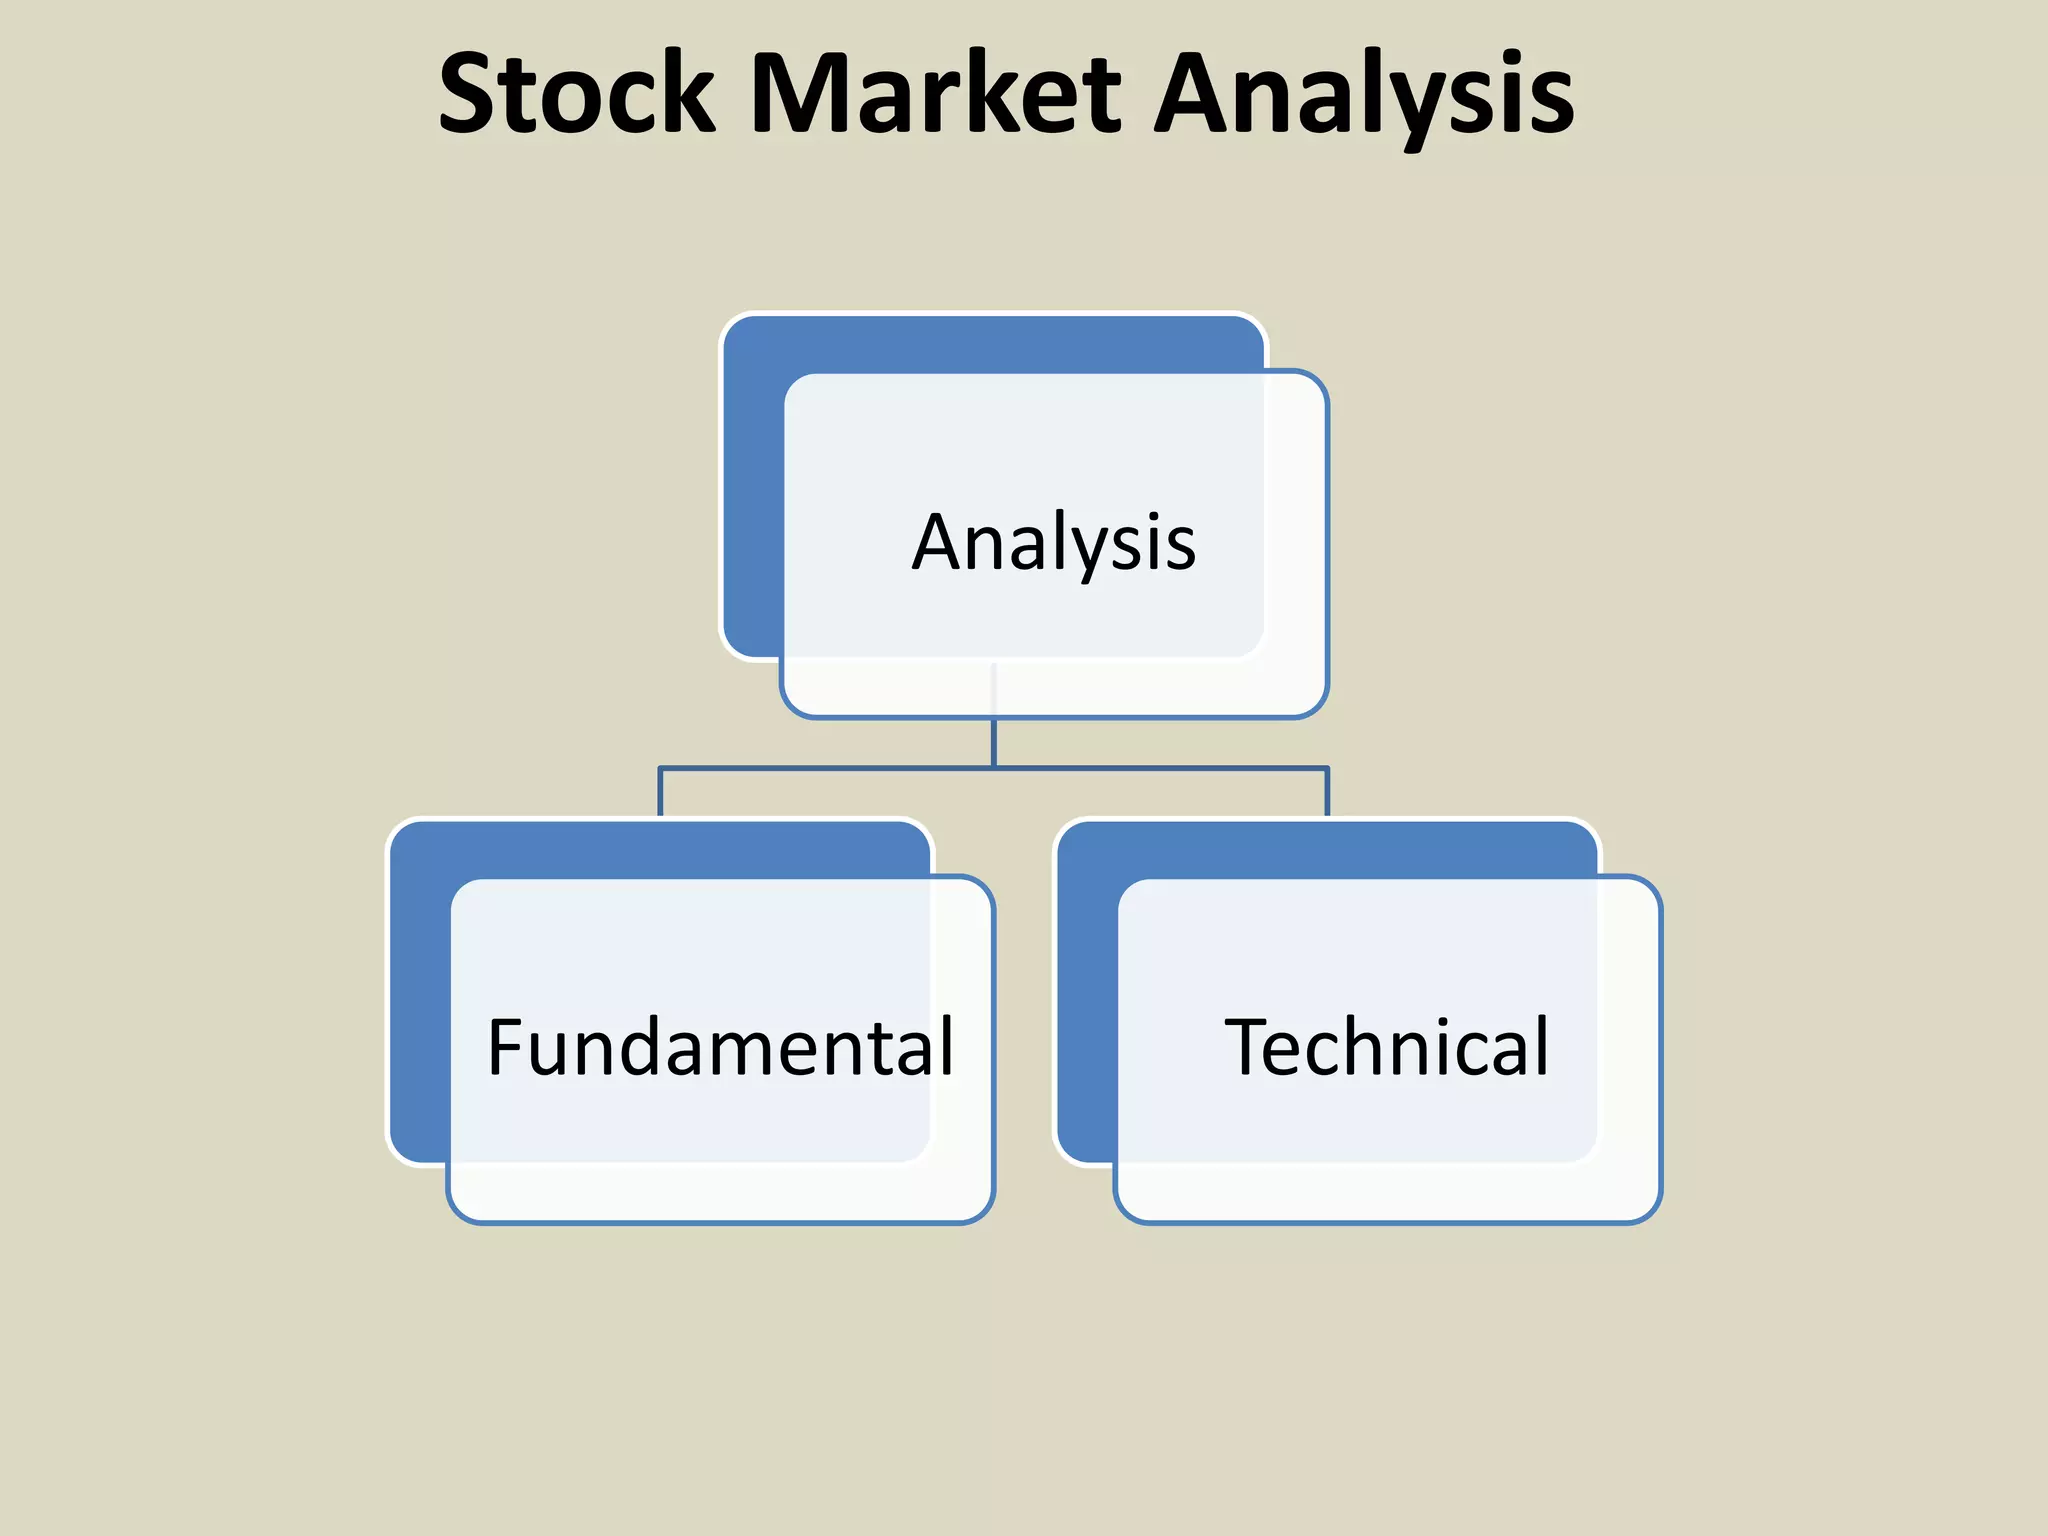
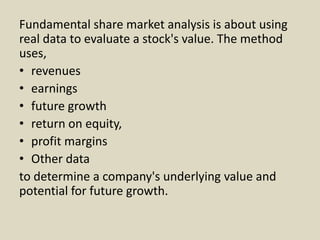
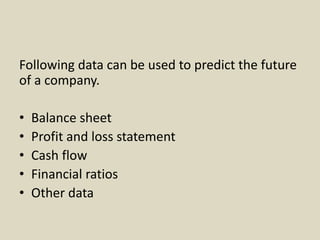
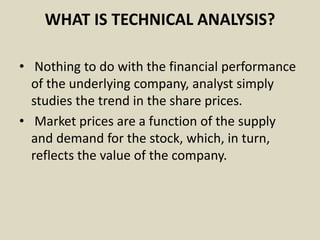
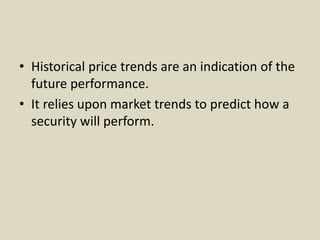
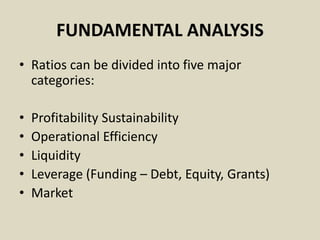
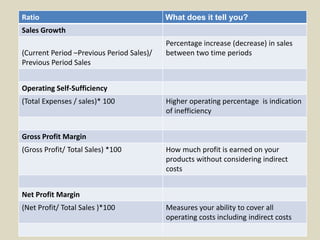
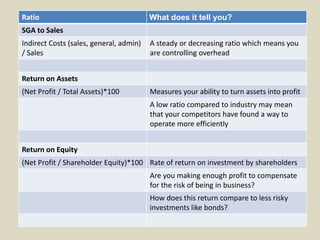
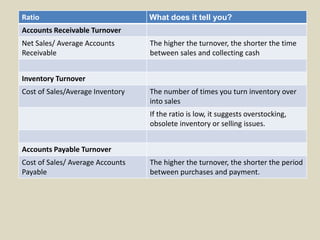
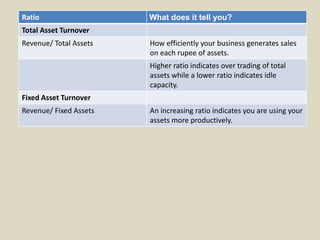
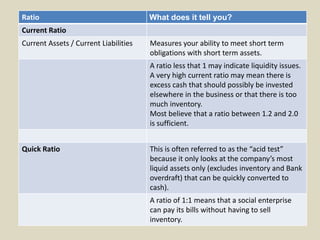
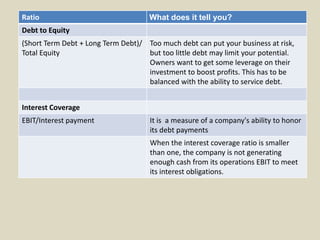
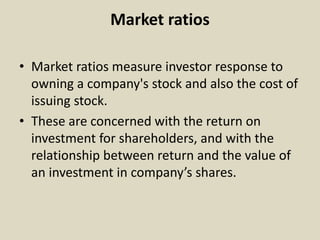
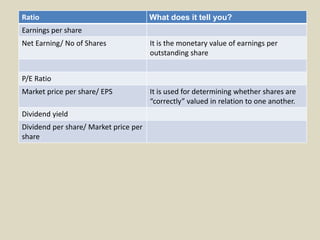
Stock Market Analysis
Analysis
Fundamental Technical
WHAT IS FUNDAMENTAL ANALYSIS?
• This method aims to evaluate the value of the
underlying Security/ Company
Value
Overvalued
Undervalued
• Market share price < EPS (As per calculation)
• Market share price > EPS (As per calculation)
Market share price < EPS (As per calculation)
• then the stock is said to be undervalued. This
means the stock is selling at a much lower price
than what it is actually worth.
Market share price > EPS (As per calculation)
• then the stock is said to be overvalued. This
means the stock is selling at a much higher price
than what it is actually worth.
Intrinsic value
Company
condition
Industry
condition
Management
condition
Economic
condition
• The basic belief is that as the company grows so
will the value of the share increase. This in turn will
benefit the investor in the long run
Fundamental share market analysis is about using
real data to evaluate a stock's value. The method
uses,
• revenues
• earnings
• future growth
• return on equity,
• profit margins
• Other data
to determine a company's underlying value and
potential for future growth.
Following data can be used to predict the future
of a company.
• Balance sheet
• Profit and loss statement
• Cash flow
• Financial ratios
• Other data
WHAT IS TECHNICAL ANALYSIS?
• Nothing to do with the financial performance
of the underlying company, analyst simply
studies the trend in the share prices.
• Market prices are a function of the supply
and demand for the stock, which, in turn,
reflects the value of the company.
• Historical price trends are an indication of the
future performance.
• It relies upon market trends to predict how a
security will perform.
FUNDAMENTAL ANALYSIS
• Ratios can be divided into five major
categories:
• Profitability Sustainability
• Operational Efficiency
• Liquidity
• Leverage (Funding – Debt, Equity, Grants)
• Market
Profitability Sustainability Ratios
• How well is business performing over a
specific period?
• Do enterprise have the financial resources to
continue tomorrow as well as today?
Ratio What does it tell you?
Sales Growth
(Current Period –Previous Period Sales)/
Previous Period Sales
Percentage increase (decrease) in sales
between two time periods
Operating Self-Sufficiency
(Total Expenses / sales)* 100 Higher operating percentage is indication
of inefficiency
Gross Profit Margin
(Gross Profit/ Total Sales) *100 How much profit is earned on your
products without considering indirect
costs
Net Profit Margin
(Net Profit/ Total Sales )*100 Measures your ability to cover all
operating costs including indirect costs
Ratio What does it tell you?
SGA to Sales
Indirect Costs (sales, general, admin)
/ Sales
A steady or decreasing ratio which means you
are controlling overhead
Return on Assets
(Net Profit / Total Assets)*100 Measures your ability to turn assets into profit
A low ratio compared to industry may mean
that your competitors have found a way to
operate more efficiently
Return on Equity
(Net Profit / Shareholder Equity)*100 Rate of return on investment by shareholders
Are you making enough profit to compensate
for the risk of being in business?
How does this return compare to less risky
investments like bonds?
Operational Efficiency Ratios
• How efficiently are business utilizing assets
and liabilities?
Ratio What does it tell you?
Accounts Receivable Turnover
Net Sales/ Average Accounts
Receivable
The higher the turnover, the shorter the time
between sales and collecting cash
Inventory Turnover
Cost of Sales/Average Inventory The number of times you turn inventory over
into sales
If the ratio is low, it suggests overstocking,
obsolete inventory or selling issues.
Accounts Payable Turnover
Cost of Sales/ Average Accounts
Payable
The higher the turnover, the shorter the period
between purchases and payment.
Ratio What does it tell you?
Total Asset Turnover
Revenue/ Total Assets How efficiently your business generates sales
on each rupee of assets.
Higher ratio indicates over trading of total
assets while a lower ratio indicates idle
capacity.
Fixed Asset Turnover
Revenue/ Fixed Assets An increasing ratio indicates you are using your
assets more productively.
Liquidity Ratios
• Does enterprise have enough cash on an
ongoing basis to meet its operational
obligations?
Ratio What does it tell you?
Current Ratio
Current Assets / Current Liabilities Measures your ability to meet short term
obligations with short term assets.
A ratio less that 1 may indicate liquidity issues.
A very high current ratio may mean there is
excess cash that should possibly be invested
elsewhere in the business or that there is too
much inventory.
Most believe that a ratio between 1.2 and 2.0
is sufficient.
Quick Ratio This is often referred to as the “acid test”
because it only looks at the company’s most
liquid assets only (excludes inventory and Bank
overdraft) that can be quickly converted to
cash).
A ratio of 1:1 means that a social enterprise
can pay its bills without having to sell
inventory.
Leverage Ratios
• To what degree does an enterprise utilize
borrowed money and what is its level of risk?
Lenders often use this information to
determine a business’s ability to repay debt.
Ratio What does it tell you?
Debt to Equity
(Short Term Debt + Long Term Debt)/
Total Equity
Too much debt can put your business at risk,
but too little debt may limit your potential.
Owners want to get some leverage on their
investment to boost profits. This has to be
balanced with the ability to service debt.
Interest Coverage
EBIT/Interest payment It is a measure of a company's ability to honor
its debt payments
When the interest coverage ratio is smaller
than one, the company is not generating
enough cash from its operations EBIT to meet
its interest obligations.
Market ratios
• Market ratios measure investor response to
owning a company's stock and also the cost of
issuing stock.
• These are concerned with the return on
investment for shareholders, and with the
relationship between return and the value of
an investment in company’s shares.
Ratio What does it tell you?
Earnings per share
Net Earning/ No of Shares It is the monetary value of earnings per
outstanding share
P/E Ratio
Market price per share/ EPS It is used for determining whether shares are
“correctly” valued in relation to one another.
Dividend yield
Dividend per share/ Market price per
share
SAPM Lecture 6Analysis

SAPM Lecture 6Analysis

  • 1.
  • 2.
    WHAT IS FUNDAMENTALANALYSIS? • This method aims to evaluate the value of the underlying Security/ Company Value Overvalued Undervalued
  • 3.
    • Market shareprice < EPS (As per calculation) • Market share price > EPS (As per calculation)
  • 4.
    Market share price< EPS (As per calculation) • then the stock is said to be undervalued. This means the stock is selling at a much lower price than what it is actually worth. Market share price > EPS (As per calculation) • then the stock is said to be overvalued. This means the stock is selling at a much higher price than what it is actually worth.
  • 5.
  • 6.
    • The basicbelief is that as the company grows so will the value of the share increase. This in turn will benefit the investor in the long run
  • 7.
    Fundamental share marketanalysis is about using real data to evaluate a stock's value. The method uses, • revenues • earnings • future growth • return on equity, • profit margins • Other data to determine a company's underlying value and potential for future growth.
  • 8.
    Following data canbe used to predict the future of a company. • Balance sheet • Profit and loss statement • Cash flow • Financial ratios • Other data
  • 9.
    WHAT IS TECHNICALANALYSIS? • Nothing to do with the financial performance of the underlying company, analyst simply studies the trend in the share prices. • Market prices are a function of the supply and demand for the stock, which, in turn, reflects the value of the company.
  • 10.
    • Historical pricetrends are an indication of the future performance. • It relies upon market trends to predict how a security will perform.
  • 11.
    FUNDAMENTAL ANALYSIS • Ratioscan be divided into five major categories: • Profitability Sustainability • Operational Efficiency • Liquidity • Leverage (Funding – Debt, Equity, Grants) • Market
  • 12.
    Profitability Sustainability Ratios •How well is business performing over a specific period? • Do enterprise have the financial resources to continue tomorrow as well as today?
  • 13.
    Ratio What doesit tell you? Sales Growth (Current Period –Previous Period Sales)/ Previous Period Sales Percentage increase (decrease) in sales between two time periods Operating Self-Sufficiency (Total Expenses / sales)* 100 Higher operating percentage is indication of inefficiency Gross Profit Margin (Gross Profit/ Total Sales) *100 How much profit is earned on your products without considering indirect costs Net Profit Margin (Net Profit/ Total Sales )*100 Measures your ability to cover all operating costs including indirect costs
  • 14.
    Ratio What doesit tell you? SGA to Sales Indirect Costs (sales, general, admin) / Sales A steady or decreasing ratio which means you are controlling overhead Return on Assets (Net Profit / Total Assets)*100 Measures your ability to turn assets into profit A low ratio compared to industry may mean that your competitors have found a way to operate more efficiently Return on Equity (Net Profit / Shareholder Equity)*100 Rate of return on investment by shareholders Are you making enough profit to compensate for the risk of being in business? How does this return compare to less risky investments like bonds?
  • 15.
    Operational Efficiency Ratios •How efficiently are business utilizing assets and liabilities?
  • 16.
    Ratio What doesit tell you? Accounts Receivable Turnover Net Sales/ Average Accounts Receivable The higher the turnover, the shorter the time between sales and collecting cash Inventory Turnover Cost of Sales/Average Inventory The number of times you turn inventory over into sales If the ratio is low, it suggests overstocking, obsolete inventory or selling issues. Accounts Payable Turnover Cost of Sales/ Average Accounts Payable The higher the turnover, the shorter the period between purchases and payment.
  • 17.
    Ratio What doesit tell you? Total Asset Turnover Revenue/ Total Assets How efficiently your business generates sales on each rupee of assets. Higher ratio indicates over trading of total assets while a lower ratio indicates idle capacity. Fixed Asset Turnover Revenue/ Fixed Assets An increasing ratio indicates you are using your assets more productively.
  • 18.
    Liquidity Ratios • Doesenterprise have enough cash on an ongoing basis to meet its operational obligations?
  • 19.
    Ratio What doesit tell you? Current Ratio Current Assets / Current Liabilities Measures your ability to meet short term obligations with short term assets. A ratio less that 1 may indicate liquidity issues. A very high current ratio may mean there is excess cash that should possibly be invested elsewhere in the business or that there is too much inventory. Most believe that a ratio between 1.2 and 2.0 is sufficient. Quick Ratio This is often referred to as the “acid test” because it only looks at the company’s most liquid assets only (excludes inventory and Bank overdraft) that can be quickly converted to cash). A ratio of 1:1 means that a social enterprise can pay its bills without having to sell inventory.
  • 20.
    Leverage Ratios • Towhat degree does an enterprise utilize borrowed money and what is its level of risk? Lenders often use this information to determine a business’s ability to repay debt.
  • 21.
    Ratio What doesit tell you? Debt to Equity (Short Term Debt + Long Term Debt)/ Total Equity Too much debt can put your business at risk, but too little debt may limit your potential. Owners want to get some leverage on their investment to boost profits. This has to be balanced with the ability to service debt. Interest Coverage EBIT/Interest payment It is a measure of a company's ability to honor its debt payments When the interest coverage ratio is smaller than one, the company is not generating enough cash from its operations EBIT to meet its interest obligations.
  • 22.
    Market ratios • Marketratios measure investor response to owning a company's stock and also the cost of issuing stock. • These are concerned with the return on investment for shareholders, and with the relationship between return and the value of an investment in company’s shares.
  • 23.
    Ratio What doesit tell you? Earnings per share Net Earning/ No of Shares It is the monetary value of earnings per outstanding share P/E Ratio Market price per share/ EPS It is used for determining whether shares are “correctly” valued in relation to one another. Dividend yield Dividend per share/ Market price per share