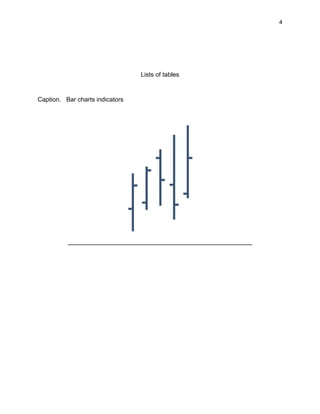
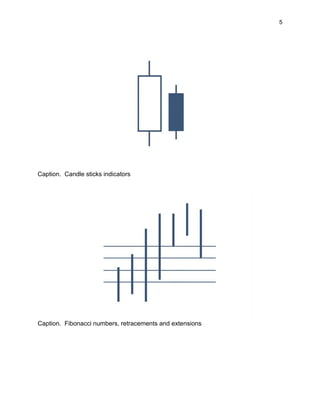
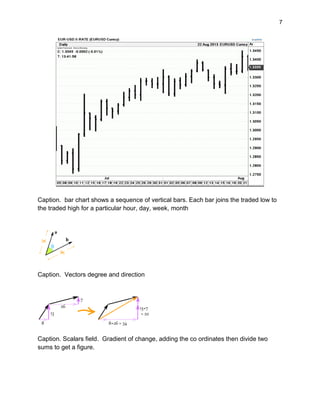
This document is a thesis submitted by Abdul Rahim Wong for a PhD in Business Administration. The thesis proposes using mathematical vectors in financial graphs as a new quantitative analysis tool. It provides an introduction to the topic and reviews literature on financial modeling, quantitative analysis, and technical analysis. Key assumptions of technical analysis are discussed, including that the security has high liquidity, no artificial price changes, and no extreme news influencing price. Different types of financial charts and indicators are also summarized, including candlestick charts.