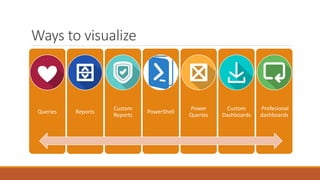
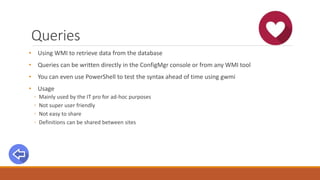
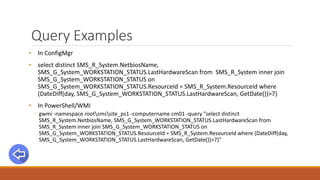
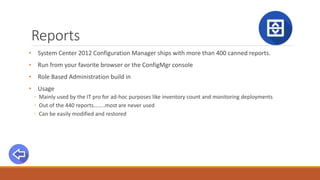
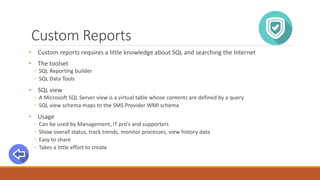
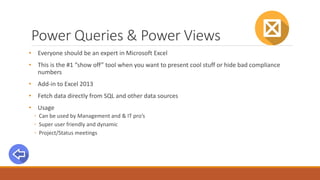
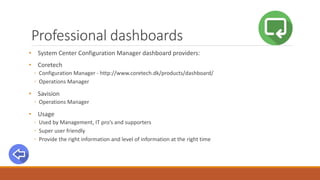
Visualize your ConfigMgr
data
KENT AGERLUND, CORETECH
ENTERPRISE CLIENT MANAGEMENT MVP
TWITTER: @AGERLUND – BLOG: BLOG.CORETECH.DK/AUTHOR/KEA
Why Visualize
Dashboard
Management needs facts to make
decisions
IT Pro’s must be able to spot Trends
and have insights to know what’s
going on and what will happen
Supporters must have detailed information
about devices and deployments to
troubleshoot
Knowing is so much cooler than
guessing:
Share insights - enable people
Raise productivity
Avoid human bottlenecks
Let everyone know what's cooking
Data must be easy to access, when
they are they will:
Understand your client environment and
prioritize appropriately
With the correct data it will be:
Easier to prioritize
Get there in time
Easy to compare trends
Ways to visualize
Queries Reports
Custom
Reports
PowerShell
Power
Queries
Custom
Dashboards
Profesional
dashboards
Queries
• Using WMI to retrieve data from the database
• Queries can be written directly in the ConfigMgr console or from any WMI tool
• You can even use PowerShell to test the syntax ahead of time using gwmi
• Usage
◦ Mainly used by the IT pro for ad-hoc purposes
◦ Not super user friendly
◦ Not easy to share
◦ Definitions can be shared between sites
Query Examples
• In ConfigMgr
• select distinct SMS_R_System.NetbiosName,
SMS_G_System_WORKSTATION_STATUS.LastHardwareScan from SMS_R_System inner join
SMS_G_System_WORKSTATION_STATUS on
SMS_G_System_WORKSTATION_STATUS.ResourceId = SMS_R_System.ResourceId where
(DateDiff(day, SMS_G_System_WORKSTATION_STATUS.LastHardwareScan, GetDate())>7)
• In PowerShell/WMI
◦ gwmi -namespace rootsmssite_ps1 -computername cm01 -query "select distinct
SMS_R_System.NetbiosName, SMS_G_System_WORKSTATION_STATUS.LastHardwareScan from
SMS_R_System inner join SMS_G_System_WORKSTATION_STATUS on
SMS_G_System_WORKSTATION_STATUS.ResourceId = SMS_R_System.ResourceId where (DateDiff(day,
SMS_G_System_WORKSTATION_STATUS.LastHardwareScan, GetDate())>7)"
Reports
• System Center 2012 Configuration Manager ships with more than 400 canned reports.
• Run from your favorite browser or the ConfigMgr console
• Role Based Administration build in
• Usage
◦ Mainly used by the IT pro for ad-hoc purposes like inventory count and monitoring deployments
◦ Out of the 440 reports……..most are never used
◦ Can be easily modified and restored
Links
• Introducing to reporting in Configuration Manager
◦ https://technet.microsoft.com/en-us/library/gg682105.aspx
• Channel 0
◦ http://channel9.msdn.com/Events/MMS/2013/UD-B338
Custom Reports
• Custom reports requires a little knowledge about SQL and searching the Internet
• The toolset
◦ SQL Reporting builder
◦ SQL Data Tools
• SQL view
◦ A Microsoft SQL Server view is a virtual table whose contents are defined by a query
◦ SQL view schema maps to the SMS Provider WMI schema
• Usage
◦ Can be used by Management, IT pro’s and supporters
◦ Show overall status, track trends, monitor processes, view history data
◦ Easy to share
◦ Takes a little effort to create
Reporting Advice
• Only show the data that are needed
• Use graphics and colour to emphasize data
◦ Eliminate fluff
◦ Thin font
◦ Space instead of lines
◦ Dim labels not values
◦ Limit number of accent colors
◦ Visualize KPI’s
◦ Trend over time, consider using sparkline instread of raw data
• http://blogs.msdn.com/b/bobmeyers/archive/2009/07/31/add-excel-like-color-scale-
conditional-formatting-to-your-reports.aspx
PowerShell
• To some, the best thing that has happened to humanity since we invented Coffee
• Quick and dirty ways to show data
• Export data to CSV files
• Export data to grid view
• Usage
◦ Used by the IT pro for ad-hoc purposes
◦ Limited output
◦ Often project driven
PowerShell examples
• Export list of maintenance windows
• Export list of packages/applications and active deployments
Power Queries & Power Views
• Everyone should be an expert in Microsoft Excel
• This is the #1 “show off” tool when you want to present cool stuff or hide bad compliance
numbers
• Add-in to Excel 2013
• Fetch data directly from SQL and other data sources
• Usage
◦ Can be used by Management and & IT pro’s
◦ Super user friendly and dynamic
◦ Project/Status meetings
Power Queries & Power View resources
• Download Power Queries for Excel
◦ http://www.microsoft.com/en-us/download/details.aspx?id=39379
• Getting started with Power Queries
◦ http://www.databasejournal.com/sqletc/getting-started-with-microsoft-power-query-for-excel.html
◦ https://support.office.com/en-us/article/Microsoft-Power-Query-for-Excel-Help-2B433A85-DDFB-420B-
9CDA-FE0E60B82A94
• Download Power View
◦ http://www.microsoft.com/en-us/download/details.aspx?id=26718
• Getting started with Power View
◦ https://technet.microsoft.com/en-us/library/hh213579(v=sql.110).aspx
◦ http://blogs.msdn.com/b/seanboon/archive/2012/07/30/visualizing-the-olympics-with-power-view-in-
excel-2013-day-1.aspx
Custom dashboards
• In essence a custom report on steroids
• Usage
◦ Should provide Management with the correct overview
◦ Right there on the big monitor
Custom dashboard resources
• Compliance
• http://blogs.technet.com/b/gary_simmons_mcs/archive/2014/09/16/system-center-2012-r2-
configuration-manager-software-update-compliance-dashboard-part-1.aspx
• Patch Management
• http://blogs.technet.com/b/gary_simmons_mcs/archive/2013/12/09/creating-a-custom-
report-for-system-center-2012-r2-configuration-manager-part-1.aspx
• Client Health
◦ https://gallery.technet.microsoft.com/SCCM-Configmgr-2012-SSRS-2863c240
• A little of everything
◦ http://blogs.technet.com/b/configmgrdude/archive/2015/01/06/creating-a-simply-dashboard-using-
smsprov-log-in-configmgr-2012.aspx
Professional dashboards
• System Center Configuration Manager dashboard providers:
• Coretech
◦ Configuration Manager - http://www.coretech.dk/products/dashboard/
◦ Operations Manager
• Savision
◦ Operations Manager
• Usage
◦ Used by Management, IT pro’s and supporters
◦ Super user friendly
◦ Provide the right information and level of information at the right time
Professional dashboard examples

SCUG.DK: Visualizing Your Data, April 2015

  • 1.
    Visualize your ConfigMgr data KENTAGERLUND, CORETECH ENTERPRISE CLIENT MANAGEMENT MVP TWITTER: @AGERLUND – BLOG: BLOG.CORETECH.DK/AUTHOR/KEA
  • 2.
    Why Visualize Dashboard Management needsfacts to make decisions IT Pro’s must be able to spot Trends and have insights to know what’s going on and what will happen Supporters must have detailed information about devices and deployments to troubleshoot Knowing is so much cooler than guessing:
  • 3.
    Share insights -enable people Raise productivity Avoid human bottlenecks Let everyone know what's cooking Data must be easy to access, when they are they will:
  • 4.
    Understand your clientenvironment and prioritize appropriately With the correct data it will be: Easier to prioritize Get there in time Easy to compare trends
  • 5.
    Ways to visualize QueriesReports Custom Reports PowerShell Power Queries Custom Dashboards Profesional dashboards
  • 7.
    Queries • Using WMIto retrieve data from the database • Queries can be written directly in the ConfigMgr console or from any WMI tool • You can even use PowerShell to test the syntax ahead of time using gwmi • Usage ◦ Mainly used by the IT pro for ad-hoc purposes ◦ Not super user friendly ◦ Not easy to share ◦ Definitions can be shared between sites
  • 8.
    Query Examples • InConfigMgr • select distinct SMS_R_System.NetbiosName, SMS_G_System_WORKSTATION_STATUS.LastHardwareScan from SMS_R_System inner join SMS_G_System_WORKSTATION_STATUS on SMS_G_System_WORKSTATION_STATUS.ResourceId = SMS_R_System.ResourceId where (DateDiff(day, SMS_G_System_WORKSTATION_STATUS.LastHardwareScan, GetDate())>7) • In PowerShell/WMI ◦ gwmi -namespace rootsmssite_ps1 -computername cm01 -query "select distinct SMS_R_System.NetbiosName, SMS_G_System_WORKSTATION_STATUS.LastHardwareScan from SMS_R_System inner join SMS_G_System_WORKSTATION_STATUS on SMS_G_System_WORKSTATION_STATUS.ResourceId = SMS_R_System.ResourceId where (DateDiff(day, SMS_G_System_WORKSTATION_STATUS.LastHardwareScan, GetDate())>7)"
  • 9.
    Reports • System Center2012 Configuration Manager ships with more than 400 canned reports. • Run from your favorite browser or the ConfigMgr console • Role Based Administration build in • Usage ◦ Mainly used by the IT pro for ad-hoc purposes like inventory count and monitoring deployments ◦ Out of the 440 reports……..most are never used ◦ Can be easily modified and restored
  • 10.
    Links • Introducing toreporting in Configuration Manager ◦ https://technet.microsoft.com/en-us/library/gg682105.aspx • Channel 0 ◦ http://channel9.msdn.com/Events/MMS/2013/UD-B338
  • 11.
    Custom Reports • Customreports requires a little knowledge about SQL and searching the Internet • The toolset ◦ SQL Reporting builder ◦ SQL Data Tools • SQL view ◦ A Microsoft SQL Server view is a virtual table whose contents are defined by a query ◦ SQL view schema maps to the SMS Provider WMI schema • Usage ◦ Can be used by Management, IT pro’s and supporters ◦ Show overall status, track trends, monitor processes, view history data ◦ Easy to share ◦ Takes a little effort to create
  • 12.
    Reporting Advice • Onlyshow the data that are needed • Use graphics and colour to emphasize data ◦ Eliminate fluff ◦ Thin font ◦ Space instead of lines ◦ Dim labels not values ◦ Limit number of accent colors ◦ Visualize KPI’s ◦ Trend over time, consider using sparkline instread of raw data • http://blogs.msdn.com/b/bobmeyers/archive/2009/07/31/add-excel-like-color-scale- conditional-formatting-to-your-reports.aspx
  • 13.
    PowerShell • To some,the best thing that has happened to humanity since we invented Coffee • Quick and dirty ways to show data • Export data to CSV files • Export data to grid view • Usage ◦ Used by the IT pro for ad-hoc purposes ◦ Limited output ◦ Often project driven
  • 14.
    PowerShell examples • Exportlist of maintenance windows • Export list of packages/applications and active deployments
  • 15.
    Power Queries &Power Views • Everyone should be an expert in Microsoft Excel • This is the #1 “show off” tool when you want to present cool stuff or hide bad compliance numbers • Add-in to Excel 2013 • Fetch data directly from SQL and other data sources • Usage ◦ Can be used by Management and & IT pro’s ◦ Super user friendly and dynamic ◦ Project/Status meetings
  • 16.
    Power Queries &Power View resources • Download Power Queries for Excel ◦ http://www.microsoft.com/en-us/download/details.aspx?id=39379 • Getting started with Power Queries ◦ http://www.databasejournal.com/sqletc/getting-started-with-microsoft-power-query-for-excel.html ◦ https://support.office.com/en-us/article/Microsoft-Power-Query-for-Excel-Help-2B433A85-DDFB-420B- 9CDA-FE0E60B82A94 • Download Power View ◦ http://www.microsoft.com/en-us/download/details.aspx?id=26718 • Getting started with Power View ◦ https://technet.microsoft.com/en-us/library/hh213579(v=sql.110).aspx ◦ http://blogs.msdn.com/b/seanboon/archive/2012/07/30/visualizing-the-olympics-with-power-view-in- excel-2013-day-1.aspx
  • 17.
    Custom dashboards • Inessence a custom report on steroids • Usage ◦ Should provide Management with the correct overview ◦ Right there on the big monitor
  • 18.
    Custom dashboard resources •Compliance • http://blogs.technet.com/b/gary_simmons_mcs/archive/2014/09/16/system-center-2012-r2- configuration-manager-software-update-compliance-dashboard-part-1.aspx • Patch Management • http://blogs.technet.com/b/gary_simmons_mcs/archive/2013/12/09/creating-a-custom- report-for-system-center-2012-r2-configuration-manager-part-1.aspx • Client Health ◦ https://gallery.technet.microsoft.com/SCCM-Configmgr-2012-SSRS-2863c240 • A little of everything ◦ http://blogs.technet.com/b/configmgrdude/archive/2015/01/06/creating-a-simply-dashboard-using- smsprov-log-in-configmgr-2012.aspx
  • 19.
    Professional dashboards • SystemCenter Configuration Manager dashboard providers: • Coretech ◦ Configuration Manager - http://www.coretech.dk/products/dashboard/ ◦ Operations Manager • Savision ◦ Operations Manager • Usage ◦ Used by Management, IT pro’s and supporters ◦ Super user friendly ◦ Provide the right information and level of information at the right time
  • 20.

Editor's Notes

  • #3 Key message: We have a wealth of information and different scenarios will need different ways of communicating. Management do not require detailed information about each and every device and service desk need often only to focus on a specific device. Your job is to deliver the correct information at the right time in a manner that he message is apprehended.
  • #4 Some of the side effects of sharing insights is that we will make less human errors in the decision making process – knowledge sharing and facts will raise productivity
  • #5 Having the correct data will also ensure you are able to prioritize your work day and tasks. Often we see a huge vast of man hours due to lack of knowledge.