Download as PDF, PPTX

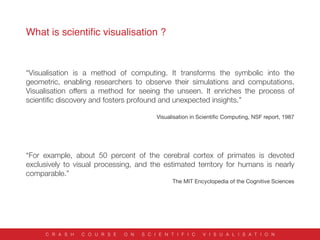
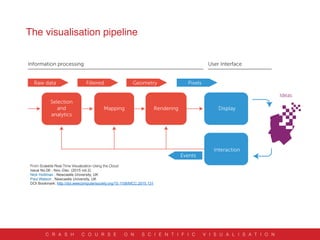
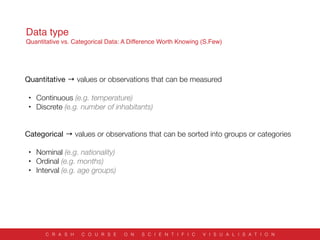
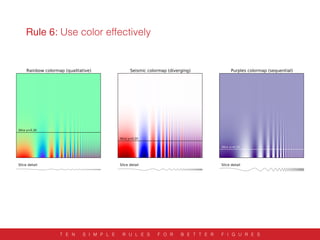
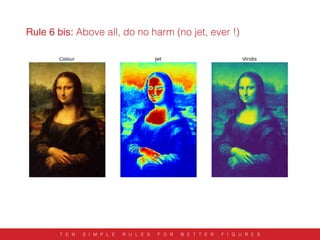
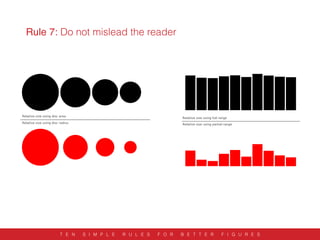
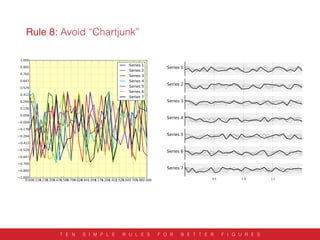

This document provides a summary of a 2.5 hour crash course on scientific visualization. It discusses what scientific visualization is, examples of its uses, and frameworks for the visualization pipeline. It also covers different data and graphical element types, visualization techniques, and 10 simple rules for creating better figures, such as knowing your audience and message, using color effectively, and avoiding misleading or overly decorated visualizations.


![Polymer [ बहुलक ] Chemistry Notes PDF - Irfanullah Mehar - JJ Sir Chemistry.pdf](https://cdn.slidesharecdn.com/ss_thumbnails/polymerchemistrynotespdf-irfanullahmehar-jjsirchemistry-260210172118-3f9b37f7-thumbnail.jpg?width=640&height=640&fit=bounds)


![ANIMAL_CELL_,_TISSUE_AND_ORGAN_CULTURE[1].pptx](https://cdn.slidesharecdn.com/ss_thumbnails/animalcelltissueandorganculture1-260204172026-4462b440-thumbnail.jpg?width=640&height=640&fit=bounds)

