Downloaded 12 times
![SCIENTIFIC VISUALIZATION DOWN TO BASICS
Emiliano Martínez Rivera
Multimedia Creation, Design and Engineering Master 2011
BES La Salle, Universitat Ramon Llull - Barcelona, Spain
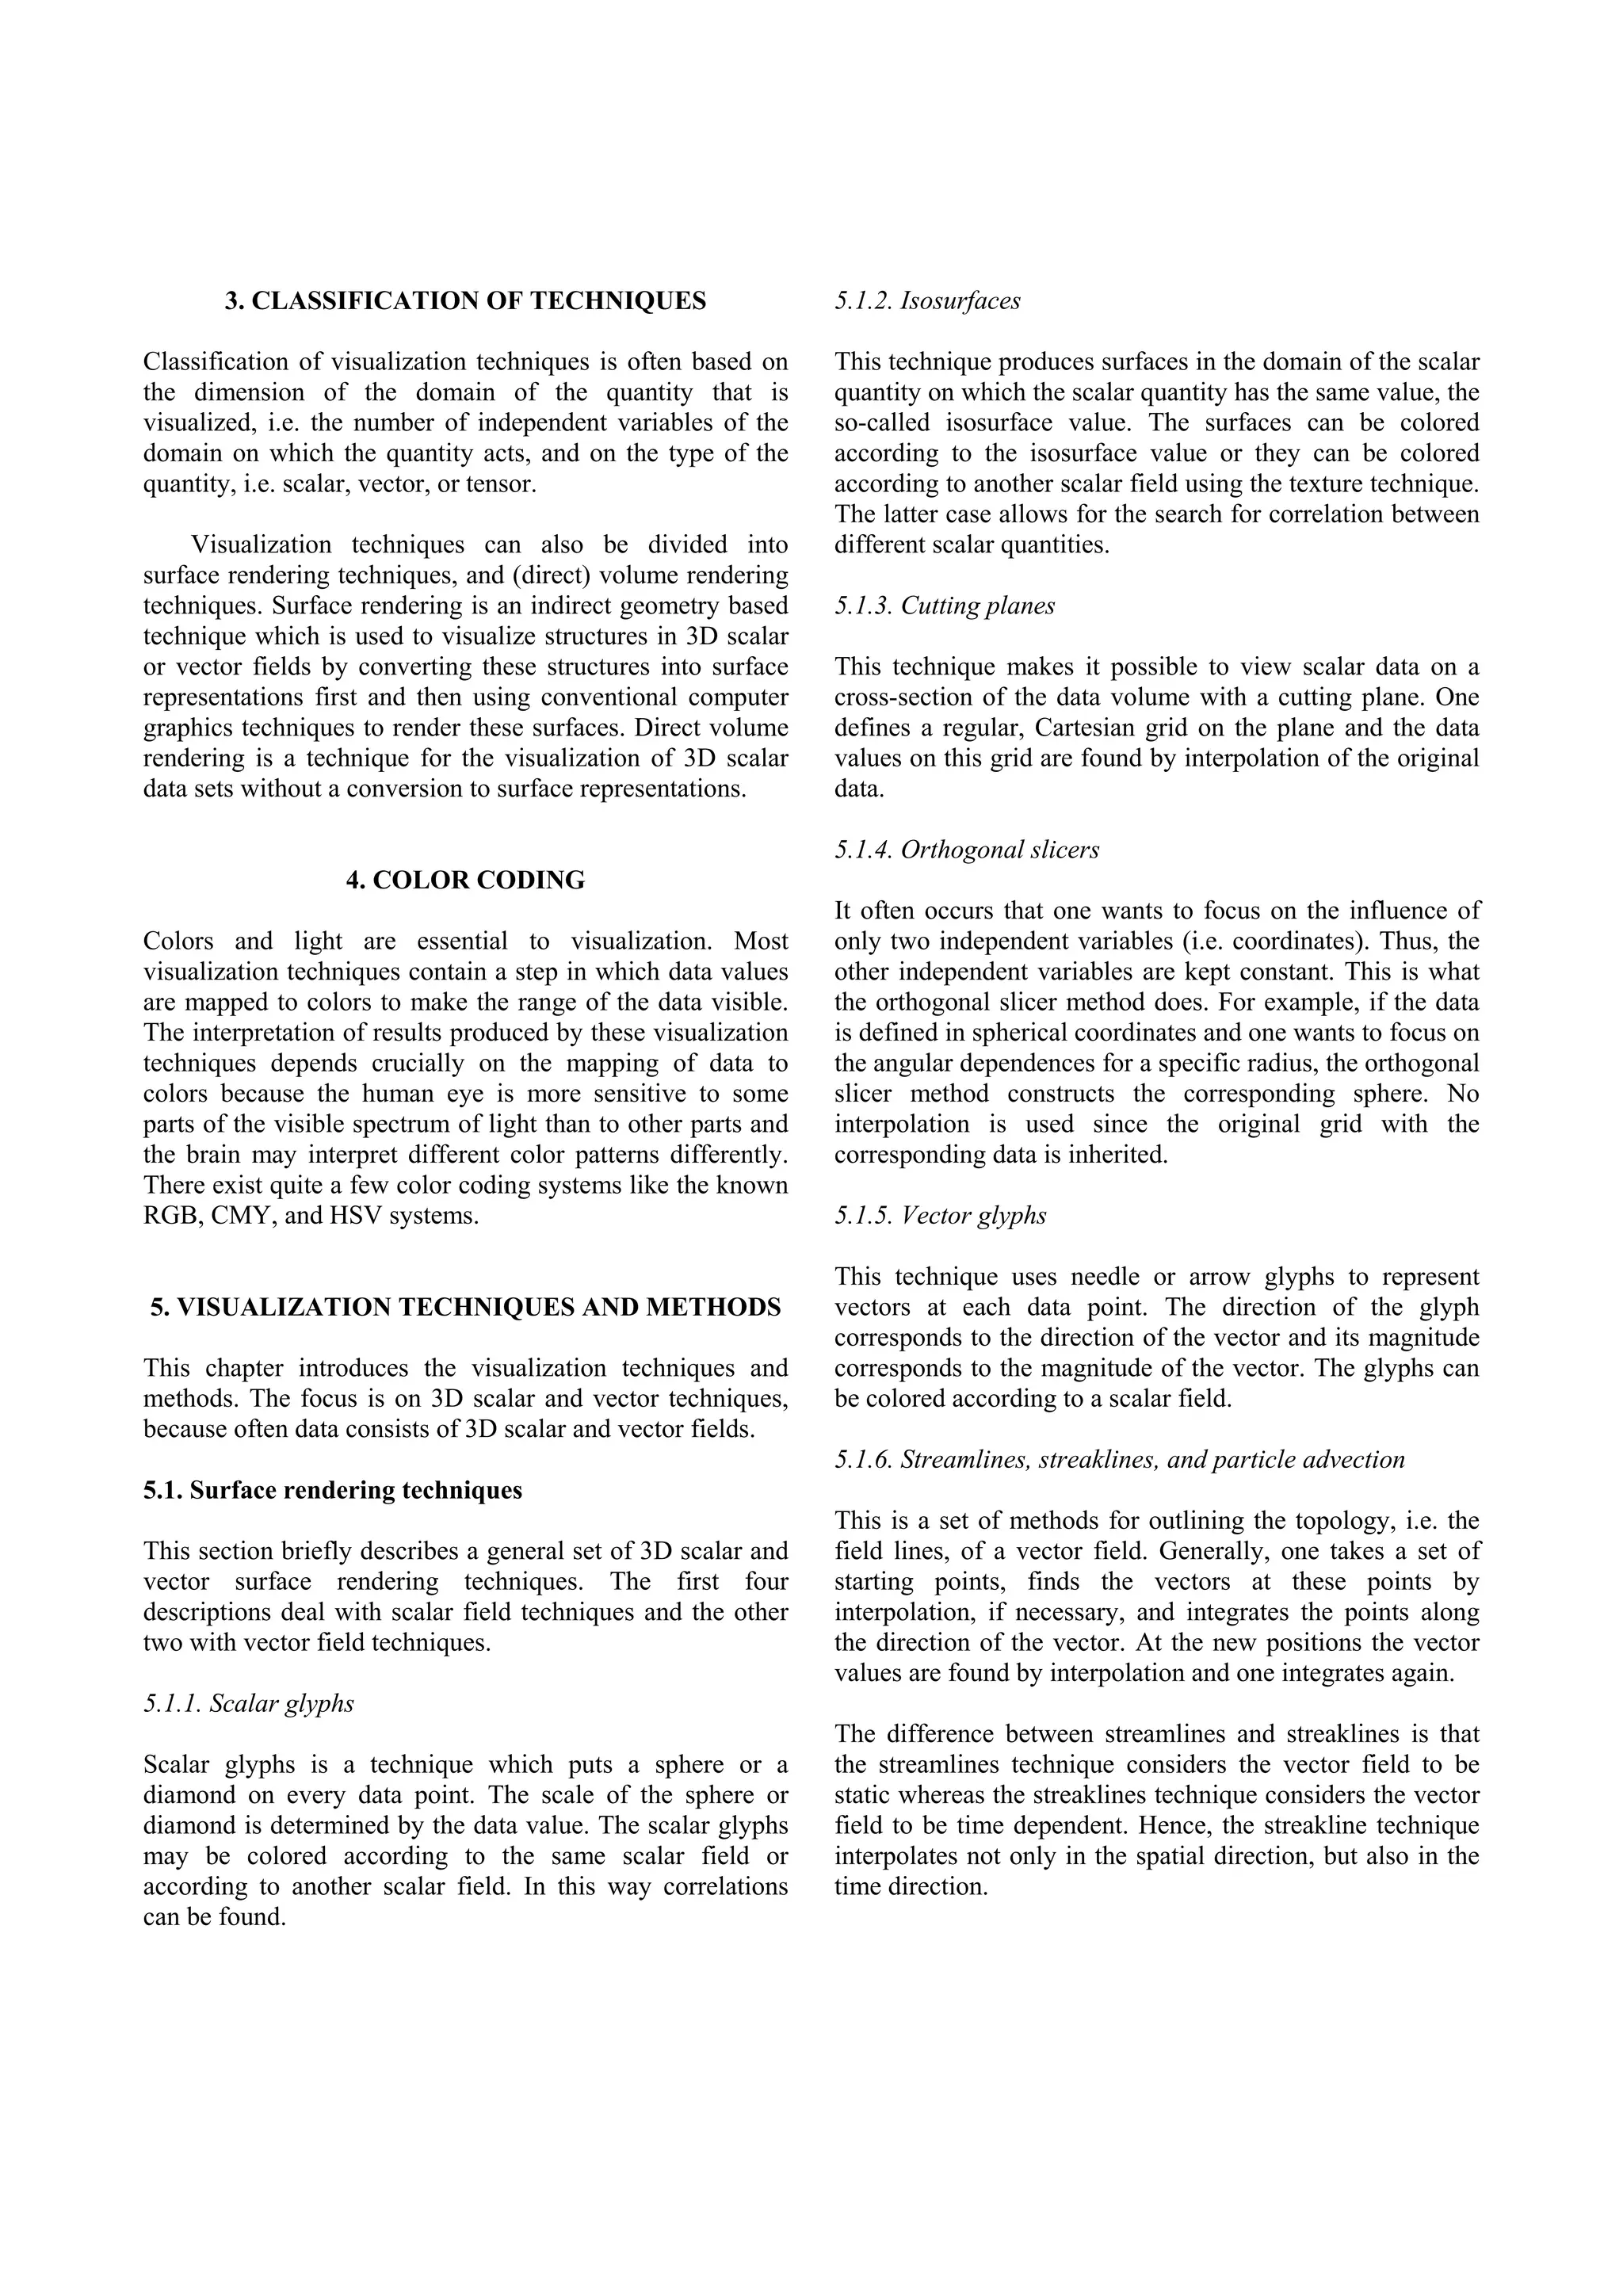
ABSTRACT
"A useful definition of visualization might be the
Computers help us handle and process tons of information binding (or mapping) of data to a representation that can be
data. Most of the time all this data is so dense, it’s almost perceived. The types of binding could be visual, auditory,
impossible to understand from just looking at a bunch of tactile, etc. or a combination of these." [5]
numbers. Some of the data could be analyzed by computers,
but most of the time there must be somebody, a real thinking "Visualization is more than a method of computing.
person, who shall interpret the data and take conclusions Visualization is the process of transforming information into
from it to make decisions, analyze. Scientific Visualization a visual form, enabling users to observe the information.
is about converting numbers into a representation of reality, The resulting visual display enables the scientist or engineer
something more graphic so that a human being can to perceive visually features which are hidden in the data but
understand and/or communicate. nevertheless are needed for data exploration and analysis."
[6]
Index Terms— Computer Science, Computer Graphics,
Infographics, Visualization, Scientific Modeling, Shape, 1.2. Synthesis of Definitions
Art, Animation, Engineering drawings, Virtual Reality,
Image Processing [1] “Mapping from computer representations to perceptual
(visual) representations, choosing encoding techniques to
1. INTRODUCTION maximize human understanding and communication” [2]
The present paper aims to describe the Scientific 1.3. Scientific Visualization Goals
Visualization in clear terms so that any reader, no matter the
knowledge level, can understand. exploration/exploitation of data and information
enhancing understanding of concepts and processes
1.1. Example Definitions [2] gaining new (unexpected, profound) insights
making invisible visible
"Visualization is a method of computing. It transforms effective presentation of significant features
the symbolic into the geometric, enabling researchers to quality control of simulations, measurements
observe their simulations and computations. Visualization
increasing scientific productivity
offers a method for seeing the unseen. It enriches the
medium of communication/collaboration
process of scientific discovery and fosters profound and
unexpected insights. In many fields it is already
1.4. Adjacent Disciplines
revolutionizing the way scientists do science." [3]
Following is a general comparison of Visualization (V) with
"Scientific visualization is a new, exciting field of
some adjacent disciplines to better understand the
computational science spurred on in large measure by the
differences:
rapid growth in computer technology, particular in graphics
workstation hardware and computer graphics software.
Computer Graphics (CG)
[Visualization tools] are beginning to impact our daily lives
through usage in the arts, particularly film animation, and Efficiency of algorithms versus effectiveness of use.
they hold great promise for scientific research and
education. When computer graphics is applied to scientific Computer Vision (CV)
data for purposes of gaining insight, testing hypothesis, and Mapping from pictures to abstract description versus
general elucidation, we speak of scientific visualization." [4] mapping from abstract description to pictures.](https://image.slidesharecdn.com/scientificvisualization-110226172229-phpapp02/75/Scientific-visualization-1-2048.jpg)
![ Image Processing (IP) => NSF Committee to solve problems
Mapping from data domain to data domain versus
mapping from data domain to picture domain Committee on "Graphics, Image Processing, and
Workstations" (1986)
(Visual) Perception (VP) sponsored by NSF / Division of Advanced Scientific
General and scientific explanation of human abilities Computing
and limitations versus goal oriented use of visual
perception in complex information presentation. Goal of committee
recommendations to HW/SW builders to improve
Art and Design (AD) scientific productivity
Aesthetics and style versus expressiveness and
effectiveness Result of committee
recommendations to research communities to develop
1.5. History new concepts/techniques for "Visualization in Scientific
Computing (ViSC)"
One of the earliest examples of three-dimensional scientific
visualization was Maxwell's thermodynamic surface, Solidifying goals
sculpted in clay in 1874 by James Clerk Maxwell.[7] workshop on "Visualization in Scientific Computing"
sponsors: e.g. NSF and NASA
Key Publication: [3]
2. COMMON QUESTIONS AND CONCERNS
The discussion is focused on the following questions:
1. What is the improvement in the understanding of the
data as compared to the situation without visualization?
2. Which visualization techniques are suitable for one's
data? Are direct volume rendering techniques to be
preferred over surface rendering techniques?
3. Can current techniques, like streamline and particle
advection methods, be used to appropriately outline the
known visual phenomena in the system?
This prefigured modern scientific visualization
techniques which use computer graphics.[8] The success of visualization not only depends on the
results which it produces, but also depends on the
Notable early two-dimensional examples include the environment in which it has to be done. This environment is
flow map of Napoleon’s March on Moscow produced by determined by the available hardware, like graphical
Charles Joseph Minard in 1869;[9] the “coxcombs” used by workstations, disk space, color printers, video editing
Florence Nightingale in 1857 as part of a campaign to hardware, and network bandwidth, and by the visualization
improve sanitary conditions in the British army;[9] and the software. For example, the graphical hardware imposes
dot map used by John Snow in 1855 to visualize the Broad constraints on interactive speed of visualization and on the
Street cholera outbreak.[9] size of the data sets which can be handled. Many different
problems encountered with visualization software must be
Need and opportunity taken into account. The user interface, programming model,
increased data rates from data input, data output, data manipulation facilities, and
o measuring devices: e.g. space missions, other related items are all important. The way in which these
medical instruments ("fire hose") items are implemented determines the convenience and
o scientific computing: e.g. national effectiveness of the use of the software package as seen by
supercomputer centers the scientist. Furthermore, whether software supports
mature and cheap technology: powerful graphical distributive processing and computational steering must be
workstations, color, sufficient memory and storage taken into account. [10]](https://image.slidesharecdn.com/scientificvisualization-110226172229-phpapp02/75/Scientific-visualization-2-2048.jpg)
![5.1.7. Textures 5.3.1. Flipbook animation
This is a technique to color arbitrary surfaces, e.g. those This is a well known technique. The generated images are
generated by the isosurface techniques, according to a 3D displayed one after the other. Its name is attached to the
scalar field. An interpolation scheme is used to determine thumbing or flipping through a series of images.
the values of the scalar field on the surface. A colormap is
used to assign the color. 5.3.2. Keyframe animation
5.2. Volume rendering techniques For this technique one only has to generate so-called
keyframes. Keyframes mark changes in the characteristics
Volume rendering techniques have been developed to of the motion. Interpolation techniques are used to generate
overcome problems of the accurate representation of a set of images between two keyframes.
surfaces in the isosurface techniques. In short, these
problems are related to making a decision for every volume 6. CONCLUSIONS
element whether or not the surface passes through it and this
can produce false positives (spurious surfaces) or false In such a rapidly evolving field, it is important to be aware
negatives (erroneous holes in surfaces), particularly in the of the latest developments, as well as those areas of ongoing
presence of small or poorly defined features. Volume research. Two important recent developments are of special
rendering does not use intermediate geometrical importance. The first has been the explosion of the internet.
representations, in contrast to surface rendering techniques. The growth of the web has created a new medium by which
It offers the possibility for displaying weak or fuzzy visualization can be presented with a high level of
surfaces. This frees one from the requirement to make a interaction.
decision whether a surface is present or not.
The second recent (and continuing) development is the
Two implementations of volume rendering are Ray casting increase in speed of PCs, as well as the reduction in cost of
and Splatting. The two methods differ in the way the RGBA high end workstations. This is bringing the world of
volume is projected onto the 2D viewing plane. Scientific Visualization to every possible user.
5.2.1. Ray casting 7. REFERENCES
For every pixel in the output image a ray is shot into the [1] The Institute Of Electrical And Electronics Engineers (IEEE), “2009
IEEE Taxonomy” Version 1.01 Supplied as additional material
data volume. At a predetermined number of evenly spaced 2009Taxonomy_v101.pdf.
locations along the ray the color and opacity values are [2] Gitta Domik [domik@siggraph.org] “Tutorial on Visualization”
obtained by interpolation. The interpolated colors and University of Paderborn - Germany
opacities are merged with each other and with the [3] McCormick, B.H., T.A. DeFanti, M.D. Brown (ed), “Visualization in
Scientific Computing”, Computer Graphics Vol. 21, No. 6,
background by compositing in back-to-front order to yield November 1987
the color of the pixel. [4] H. Aref, R. D. Charles and T. T. Elvins, “Scientific Visualization of
Fluid Flow”, in C.A. Pickover and S.K. Tewksbury (eds), Frontiers of
5.2.2. Splatting Scientific Visualization, 1994,Wiley Interscience.
[5] J. Foley and B. Ribarsky, “Next-generation Data Visualization
Tools”, in Scientific Visualization, 1994, Advances and Challenges,
This technique was developed to improve the speed of Ed: L. Rosenblum, R.A. Earnshaw, J. Encarnacao, H. Hagen, A.
calculation of volume rendering techniques like ray casting, Kaufman, S. Klimenko, G. Nielson, F. Post, D. Thalmann , Academic
at the price of less accurate rendering. A projection is made Press.
[6] N. Gershon, “From Perception to Visualization”, in Scientific
for every voxel and the resulting splats are composited on Visualization, 1994, Advances and Challenges, Ed: L. Rosenblum,
top of each other in back-to-front order to produce the final R.A. Earnshaw, J. Encarnacao, H. Hagen, A. Kaufman, S. Klimenko,
image. G. Nielson, F. Post, D. Thalmann , Academic Press.
[7] James Clerk Maxwell and P. M. Harman (2002), “The Scientific
Letters and Papers of James Clerk Maxwell”, Volume 3; 1874-1879,
5.3. Animation techniques Cambridge University Press, ISBN 0521256275, p. 148 [link]
[8] Thomas G.West (February 1999). "James Clerk Maxwell, Working in
These techniques simulate continuous motion by rapidly Wet Clay". SIGGRAPH Computer Graphics Newsletter 33 (1): 15–
displaying images. The viewer is given the impression that 17. [link]
[9] Michael Friendly (2008). "Milestones in the history of thematic
he is watching a continuous motion. To achieve this cartography, statistical graphics, and data visualization" Supplied as
impression the graphical hardware needs image display rates additional material milestone.pdf.
of at least 25 images per second, since otherwise motion [10] Scientific Visualization Laboratory, Georgia Tech “Scientific
will look shaky. Visualization Tutorial” [link]](https://image.slidesharecdn.com/scientificvisualization-110226172229-phpapp02/75/Scientific-visualization-4-2048.jpg)

The document provides an overview of scientific visualization, emphasizing its role in transforming complex data into visual forms for better understanding and analysis. It explores various visualization techniques and classifications, highlighting the importance of color coding and the evolution of volume rendering methods. Additionally, it discusses the impact of advancements in technology on the field and the ongoing development of visualization tools.


![Coded Agents – with UiPath SDK + LangGraph [Virtual Hands-on Workshop]](https://cdn.slidesharecdn.com/ss_thumbnails/codedagentsdeck-251215155422-5497c599-thumbnail.jpg?width=640&height=640&fit=bounds)


