Download as PDF, PPTX
![Integrated disciplines
[1]](https://image.slidesharecdn.com/presentation-120121043313-phpapp02/85/Visual-Analytics-3-320.jpg)
![Temporal and Geospatial Visualization
● Geospatial data is different from usual statistical data.
● Toblers first law: "everything is related to everything else,
but near things are more related than distant things".
● Data is often uncertain: errors, missing values, deviations.
● Hierarchical scale of time; different types of time: linear and
cyclic, branching and multiple perspectives.
[1]](https://image.slidesharecdn.com/presentation-120121043313-phpapp02/85/Visual-Analytics-6-320.jpg)
![Space-time cube
[1]](https://image.slidesharecdn.com/presentation-120121043313-phpapp02/85/Visual-Analytics-7-320.jpg)
![Linear and cyclic representation
[1]](https://image.slidesharecdn.com/presentation-120121043313-phpapp02/85/Visual-Analytics-8-320.jpg)
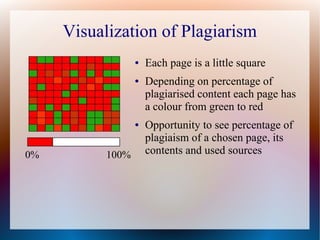
![Plagiarism Visualization
[9]](https://image.slidesharecdn.com/presentation-120121043313-phpapp02/85/Visual-Analytics-9-320.jpg)
![Plagiarism Visualization
[9]](https://image.slidesharecdn.com/presentation-120121043313-phpapp02/85/Visual-Analytics-10-320.jpg)
![Visualization of Social Networks
[2]](https://image.slidesharecdn.com/presentation-120121043313-phpapp02/85/Visual-Analytics-11-320.jpg)
![Visualization of Social Networks
[3]](https://image.slidesharecdn.com/presentation-120121043313-phpapp02/85/Visual-Analytics-12-320.jpg)
![Visualization of Scientific
Collaboration
[4]](https://image.slidesharecdn.com/presentation-120121043313-phpapp02/85/Visual-Analytics-13-320.jpg)
![Perception and Cognition
● "Visual perception is the means by which people interpret
their surroundings and for that matter, images on a computer
display".
● "Cognition is the ability to understand this visual
information, making inferences largely based on prior
learning".
● "Knowledge of how we ’think visually’ is important in the
design of user interfaces."
[1]](https://image.slidesharecdn.com/presentation-120121043313-phpapp02/85/Visual-Analytics-14-320.jpg)
![Perception and Cognition
[1]](https://image.slidesharecdn.com/presentation-120121043313-phpapp02/85/Visual-Analytics-15-320.jpg)
![Perception and Cognition
[1]](https://image.slidesharecdn.com/presentation-120121043313-phpapp02/85/Visual-Analytics-16-320.jpg)
![OpenGL
● "OpenGL (for Open Graphics Library) is a software
interface to graphics hardware."
● Interface: a set of several hundred procedures and functions
● Enables specifying the objects and operations for producing
high-quality graphical images
[6]](https://image.slidesharecdn.com/presentation-120121043313-phpapp02/85/Visual-Analytics-18-320.jpg)
![OpenGL: Visualization of Contacts in
Twitter
[7]](https://image.slidesharecdn.com/presentation-120121043313-phpapp02/85/Visual-Analytics-19-320.jpg)
![Gephi
● graph and network visualization
● allows to work with complex and
large data sets
● extensive functionality:
importing, visualizing,
spatializing, altering,
manipulating and exporting
● extensibility: tools and fitures can
be added
[8]](https://image.slidesharecdn.com/presentation-120121043313-phpapp02/85/Visual-Analytics-20-320.jpg)
![Gapminder
● Designed to make world
census data available to a
wider audience
● Two-dimentional chart, use
of colour and size
● Allowes the user to explore
the change of the variables
over time
[10]](https://image.slidesharecdn.com/presentation-120121043313-phpapp02/85/Visual-Analytics-21-320.jpg)
![Geospatial and Temporal Visualization
● Nodes represent research
institutions
● Thickness of connection
lines depends on number of
co-authorships
● Enabling change of time
dinamically and observe
changes
● Filtering
[5]](https://image.slidesharecdn.com/presentation-120121043313-phpapp02/85/Visual-Analytics-23-320.jpg)
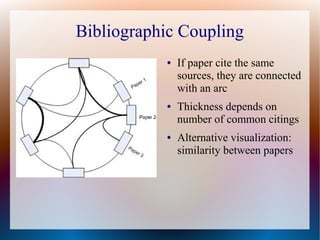

This presentation discusses visual analytics, which combines visualization techniques with analytical reasoning to enable knowledge discovery in large datasets. It outlines the goals of visual analytics like presenting data understandably, analyzing and deriving insights from large datasets. Specific aspects covered include temporal and geospatial visualization, plagiarism detection, social networks, and scientific collaboration. Frameworks for visual analytics like OpenGL, Gephi and Gapminder are also described. Potential applications that could be implemented include geospatial and temporal visualization of research institutions, plagiarism detection visualization, and bibliographic coupling analysis.


