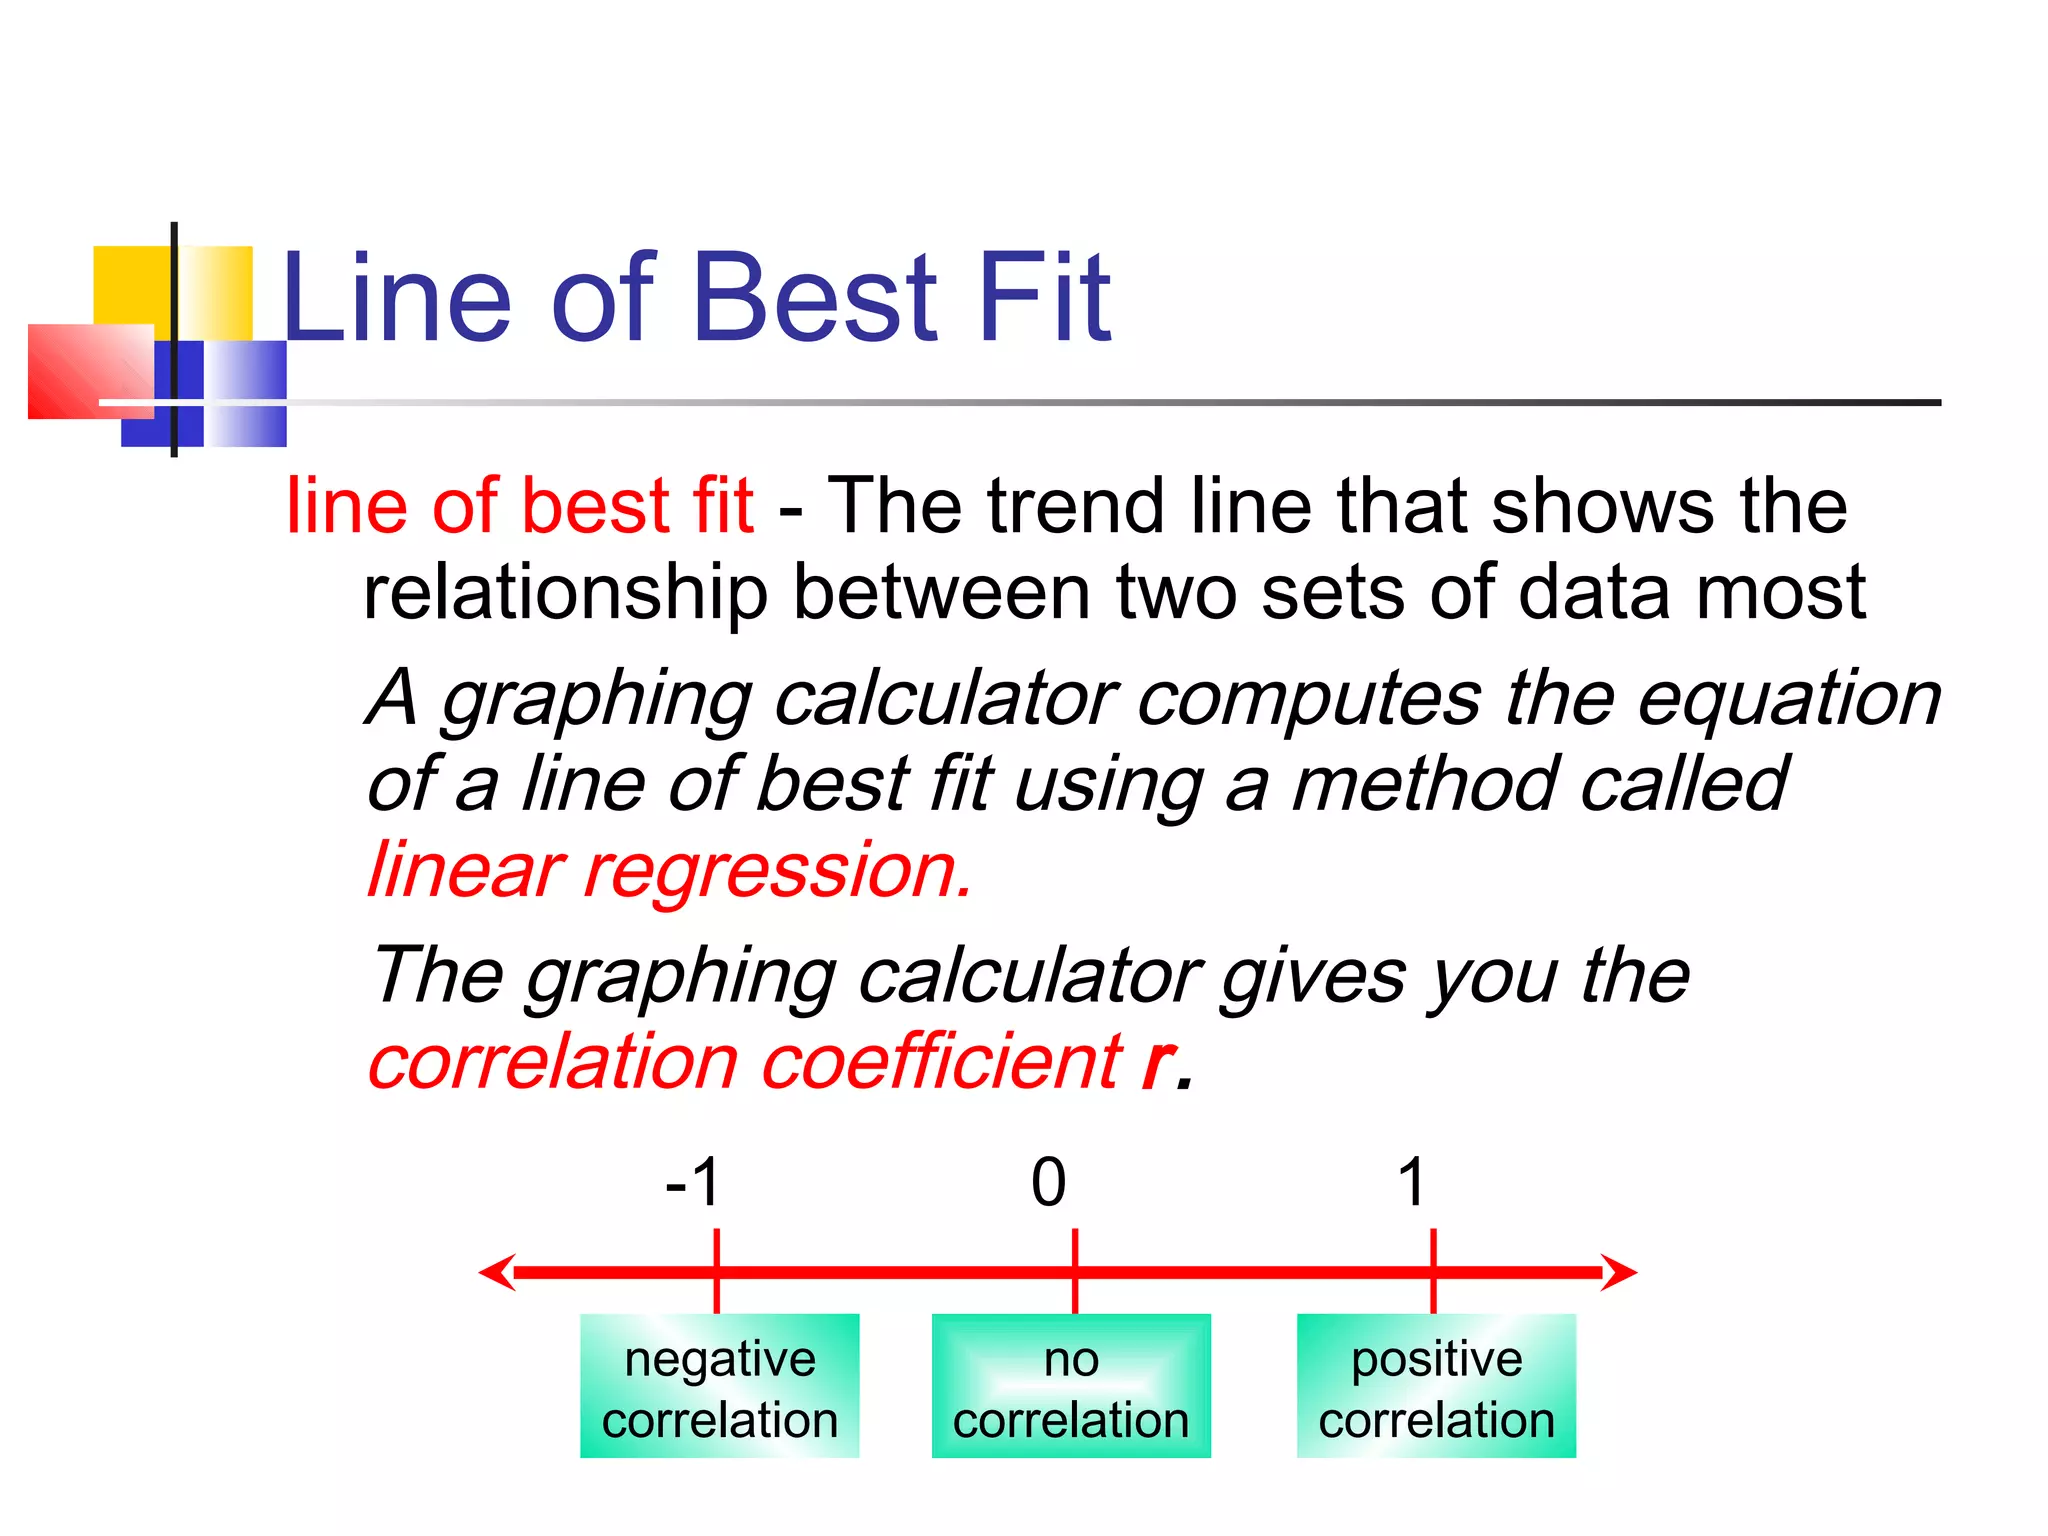
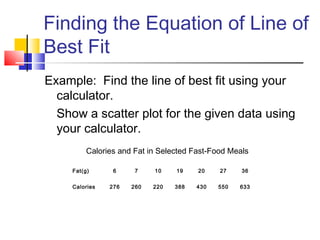
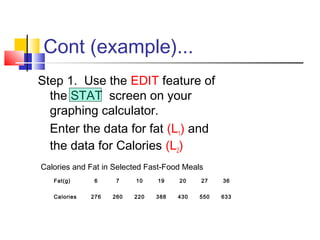
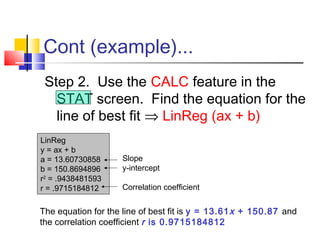
Line of Best Fit
line of best fit - The trend line that shows the
relationship between two sets of data most
A graphing calculator computes the equation
of a line of best fit using a method called
linear regression.
The graphing calculator gives you the
correlation coefficient r.
-1 0 1
negative
correlation
no
correlation
positive
correlation
Finding the Equation of Line of
Best Fit
Example: Find the line of best fit using your
calculator.
Show a scatter plot for the given data using
your calculator.
Fat(g) 6 7 10 19 20 27 36
Calories 276 260 220 388 430 550 633
Calories and Fat in Selected Fast-Food Meals
Cont (example)...
Step 1. Use the EDIT feature of
the STAT screen on your
graphing calculator.
Enter the data for fat (L1) and
the data for Calories (L2)
Calories and Fat in Selected Fast-Food Meals
Fat(g) 6 7 10 19 20 27 36
Calories 276 260 220 388 430 550 633
Cont (example)...
Step 2. Use the CALC feature in the
STAT screen. Find the equation for the
line of best fit ⇒ LinReg (ax + b)
LinReg
y = ax + b
a = 13.60730858
b = 150.8694896
r2
= .9438481593
r = .9715184812
Slope
y-intercept
Correlation coefficient
The equation for the line of best fit is y = 13.61x + 150.87 and
the correlation coefficient r is 0.9715184812
Finding the Equation of Line of
Best Fit
You try! Use a graphing
calculator to find the
equation of the line of
best fit for the data at
the right.
What is the correlation
coefficient?
Year Dollars
(Billions)
1993 340
1994 369
1995 402
1996 430
1997 457
1998 489
1999 527
2000 574
Recreation Expenditures
Answers:
y = 32.33x - 2671.67
r = 0.9964509708
Let 1993 = 93

Scatter plots ppt

  • 1.
    Line of BestFit line of best fit - The trend line that shows the relationship between two sets of data most A graphing calculator computes the equation of a line of best fit using a method called linear regression. The graphing calculator gives you the correlation coefficient r. -1 0 1 negative correlation no correlation positive correlation
  • 2.
    Finding the Equationof Line of Best Fit Example: Find the line of best fit using your calculator. Show a scatter plot for the given data using your calculator. Fat(g) 6 7 10 19 20 27 36 Calories 276 260 220 388 430 550 633 Calories and Fat in Selected Fast-Food Meals
  • 3.
    Cont (example)... Step 1.Use the EDIT feature of the STAT screen on your graphing calculator. Enter the data for fat (L1) and the data for Calories (L2) Calories and Fat in Selected Fast-Food Meals Fat(g) 6 7 10 19 20 27 36 Calories 276 260 220 388 430 550 633
  • 4.
    Cont (example)... Step 2.Use the CALC feature in the STAT screen. Find the equation for the line of best fit ⇒ LinReg (ax + b) LinReg y = ax + b a = 13.60730858 b = 150.8694896 r2 = .9438481593 r = .9715184812 Slope y-intercept Correlation coefficient The equation for the line of best fit is y = 13.61x + 150.87 and the correlation coefficient r is 0.9715184812
  • 5.
    Finding the Equationof Line of Best Fit You try! Use a graphing calculator to find the equation of the line of best fit for the data at the right. What is the correlation coefficient? Year Dollars (Billions) 1993 340 1994 369 1995 402 1996 430 1997 457 1998 489 1999 527 2000 574 Recreation Expenditures Answers: y = 32.33x - 2671.67 r = 0.9964509708 Let 1993 = 93
  • 6.
    Finding the Equationof Line of Best Fit You try! Use a graphing calculator to find the equation of the line of best fit for the data at the right. What is the correlation coefficient? Year Dollars (Billions) 1993 340 1994 369 1995 402 1996 430 1997 457 1998 489 1999 527 2000 574 Recreation Expenditures Answers: y = 32.33x - 2671.67 r = 0.9964509708 Let 1993 = 93