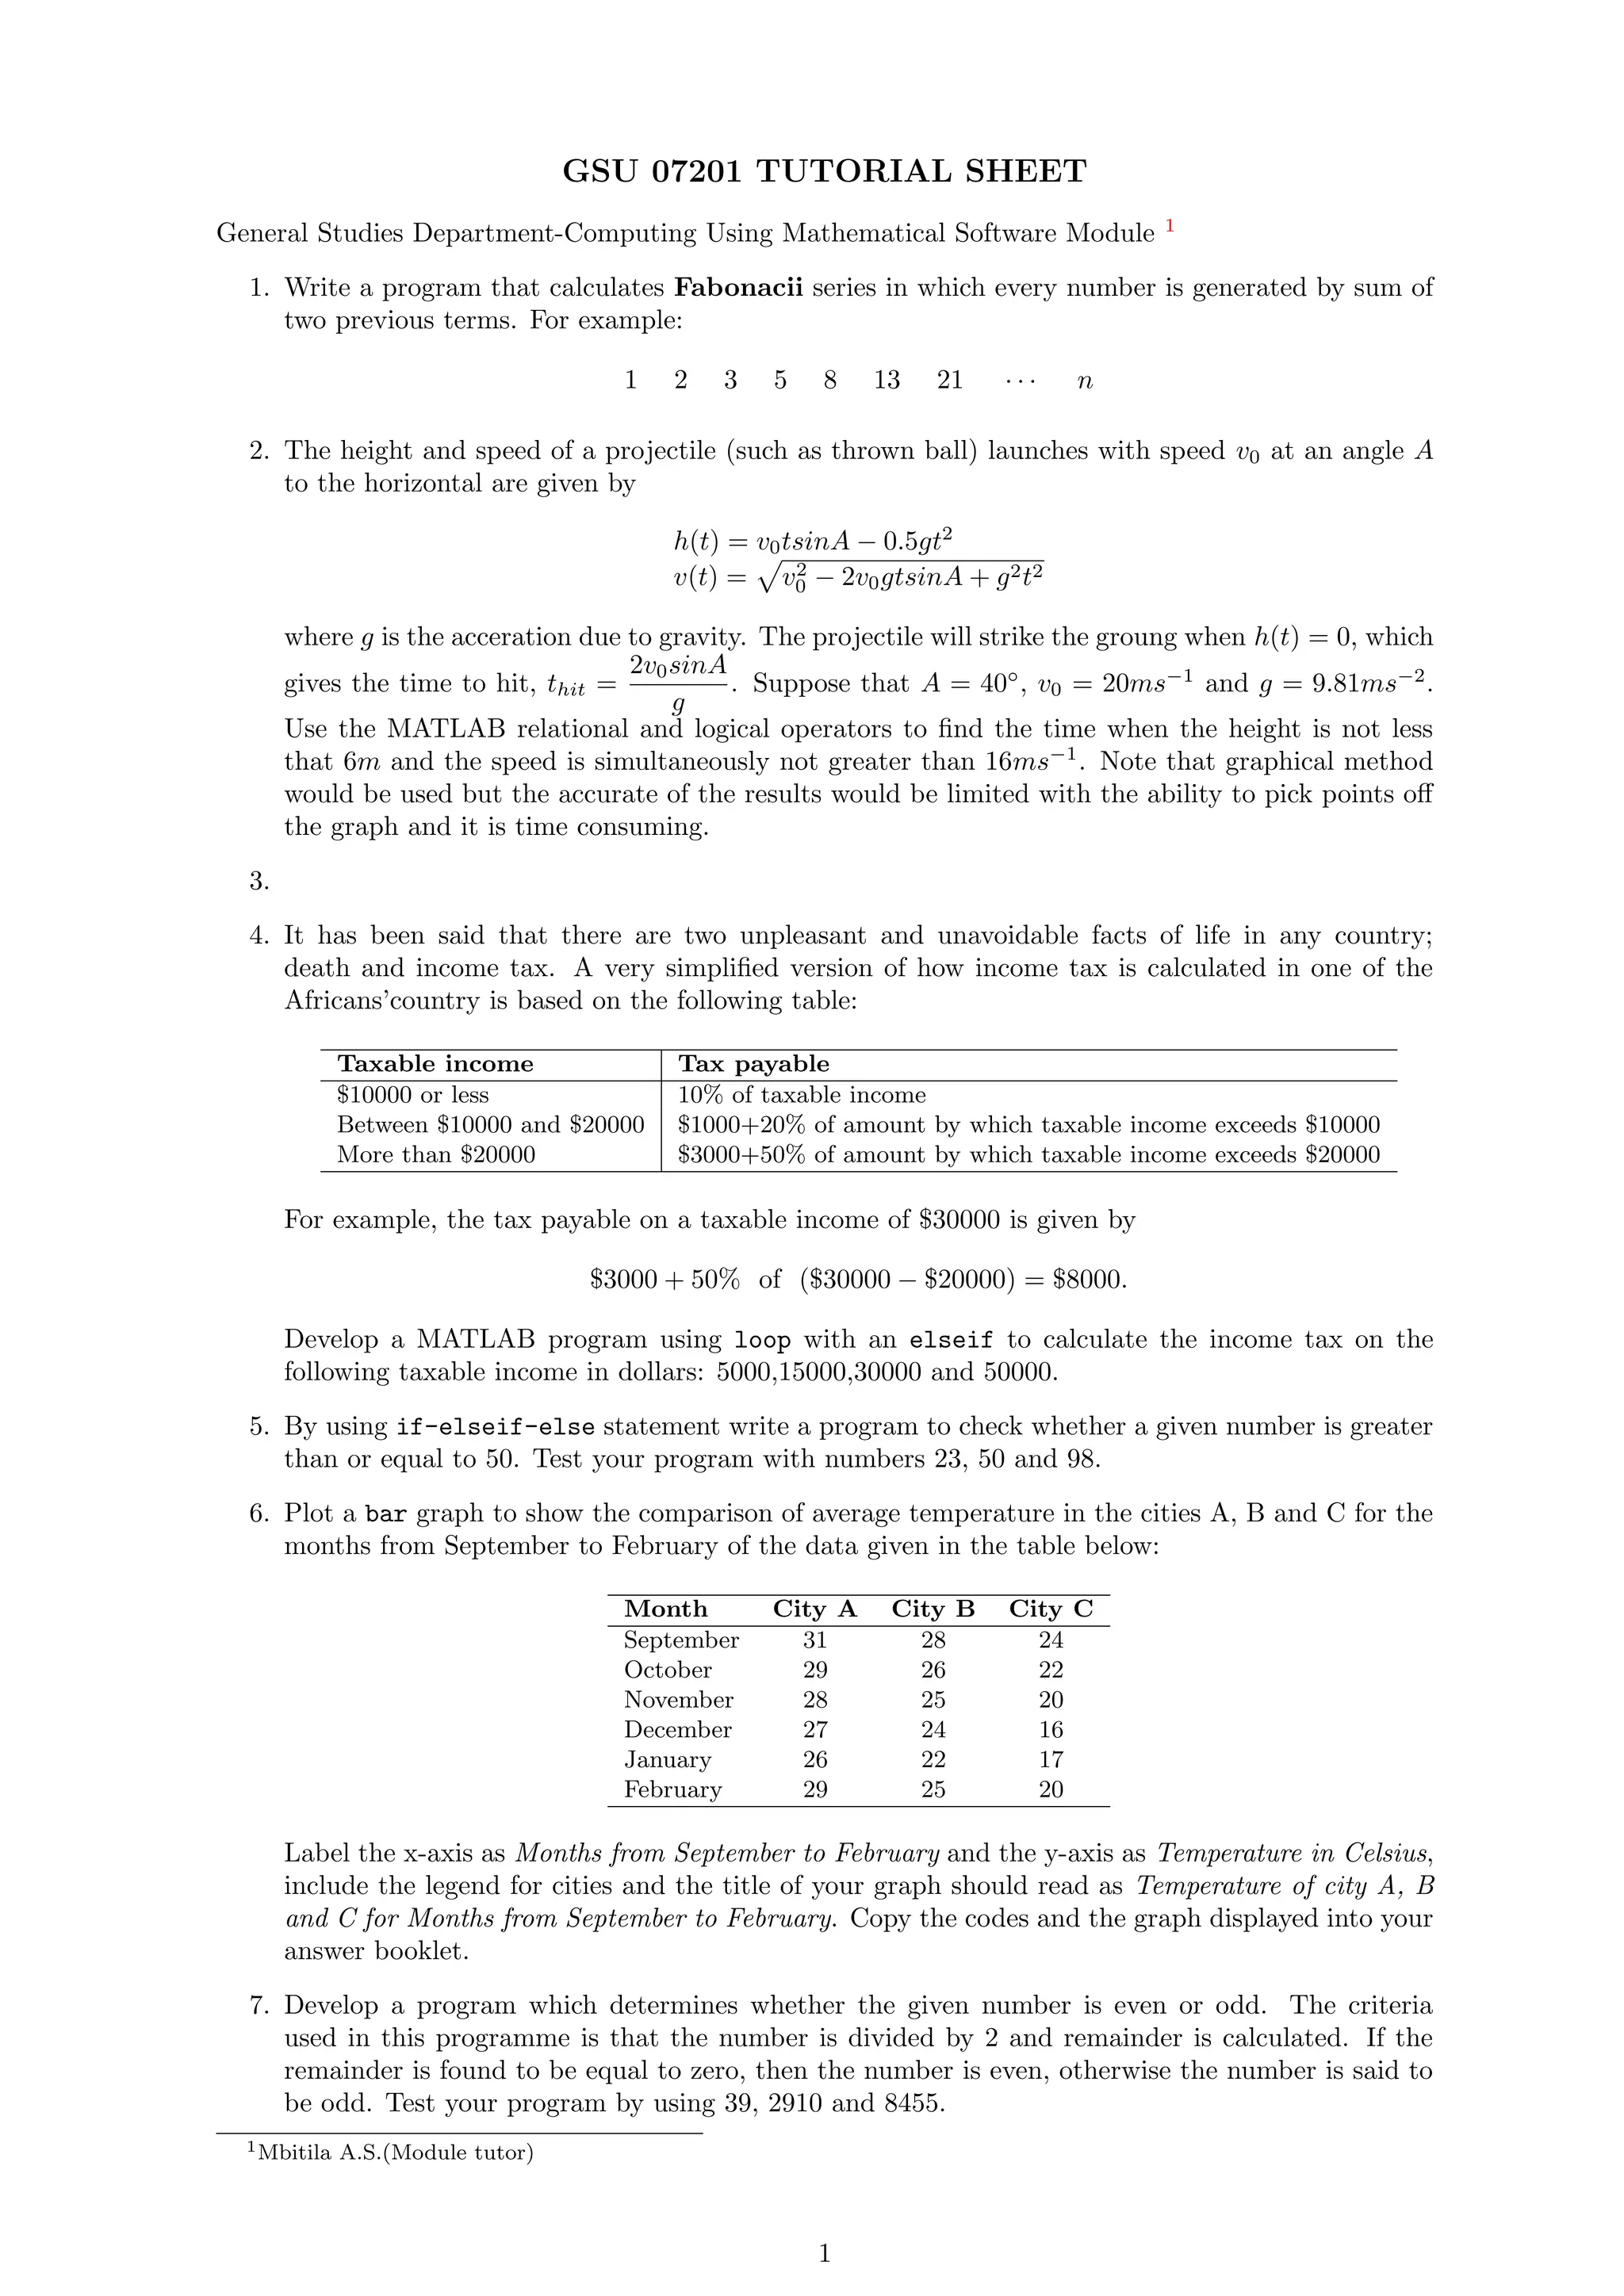
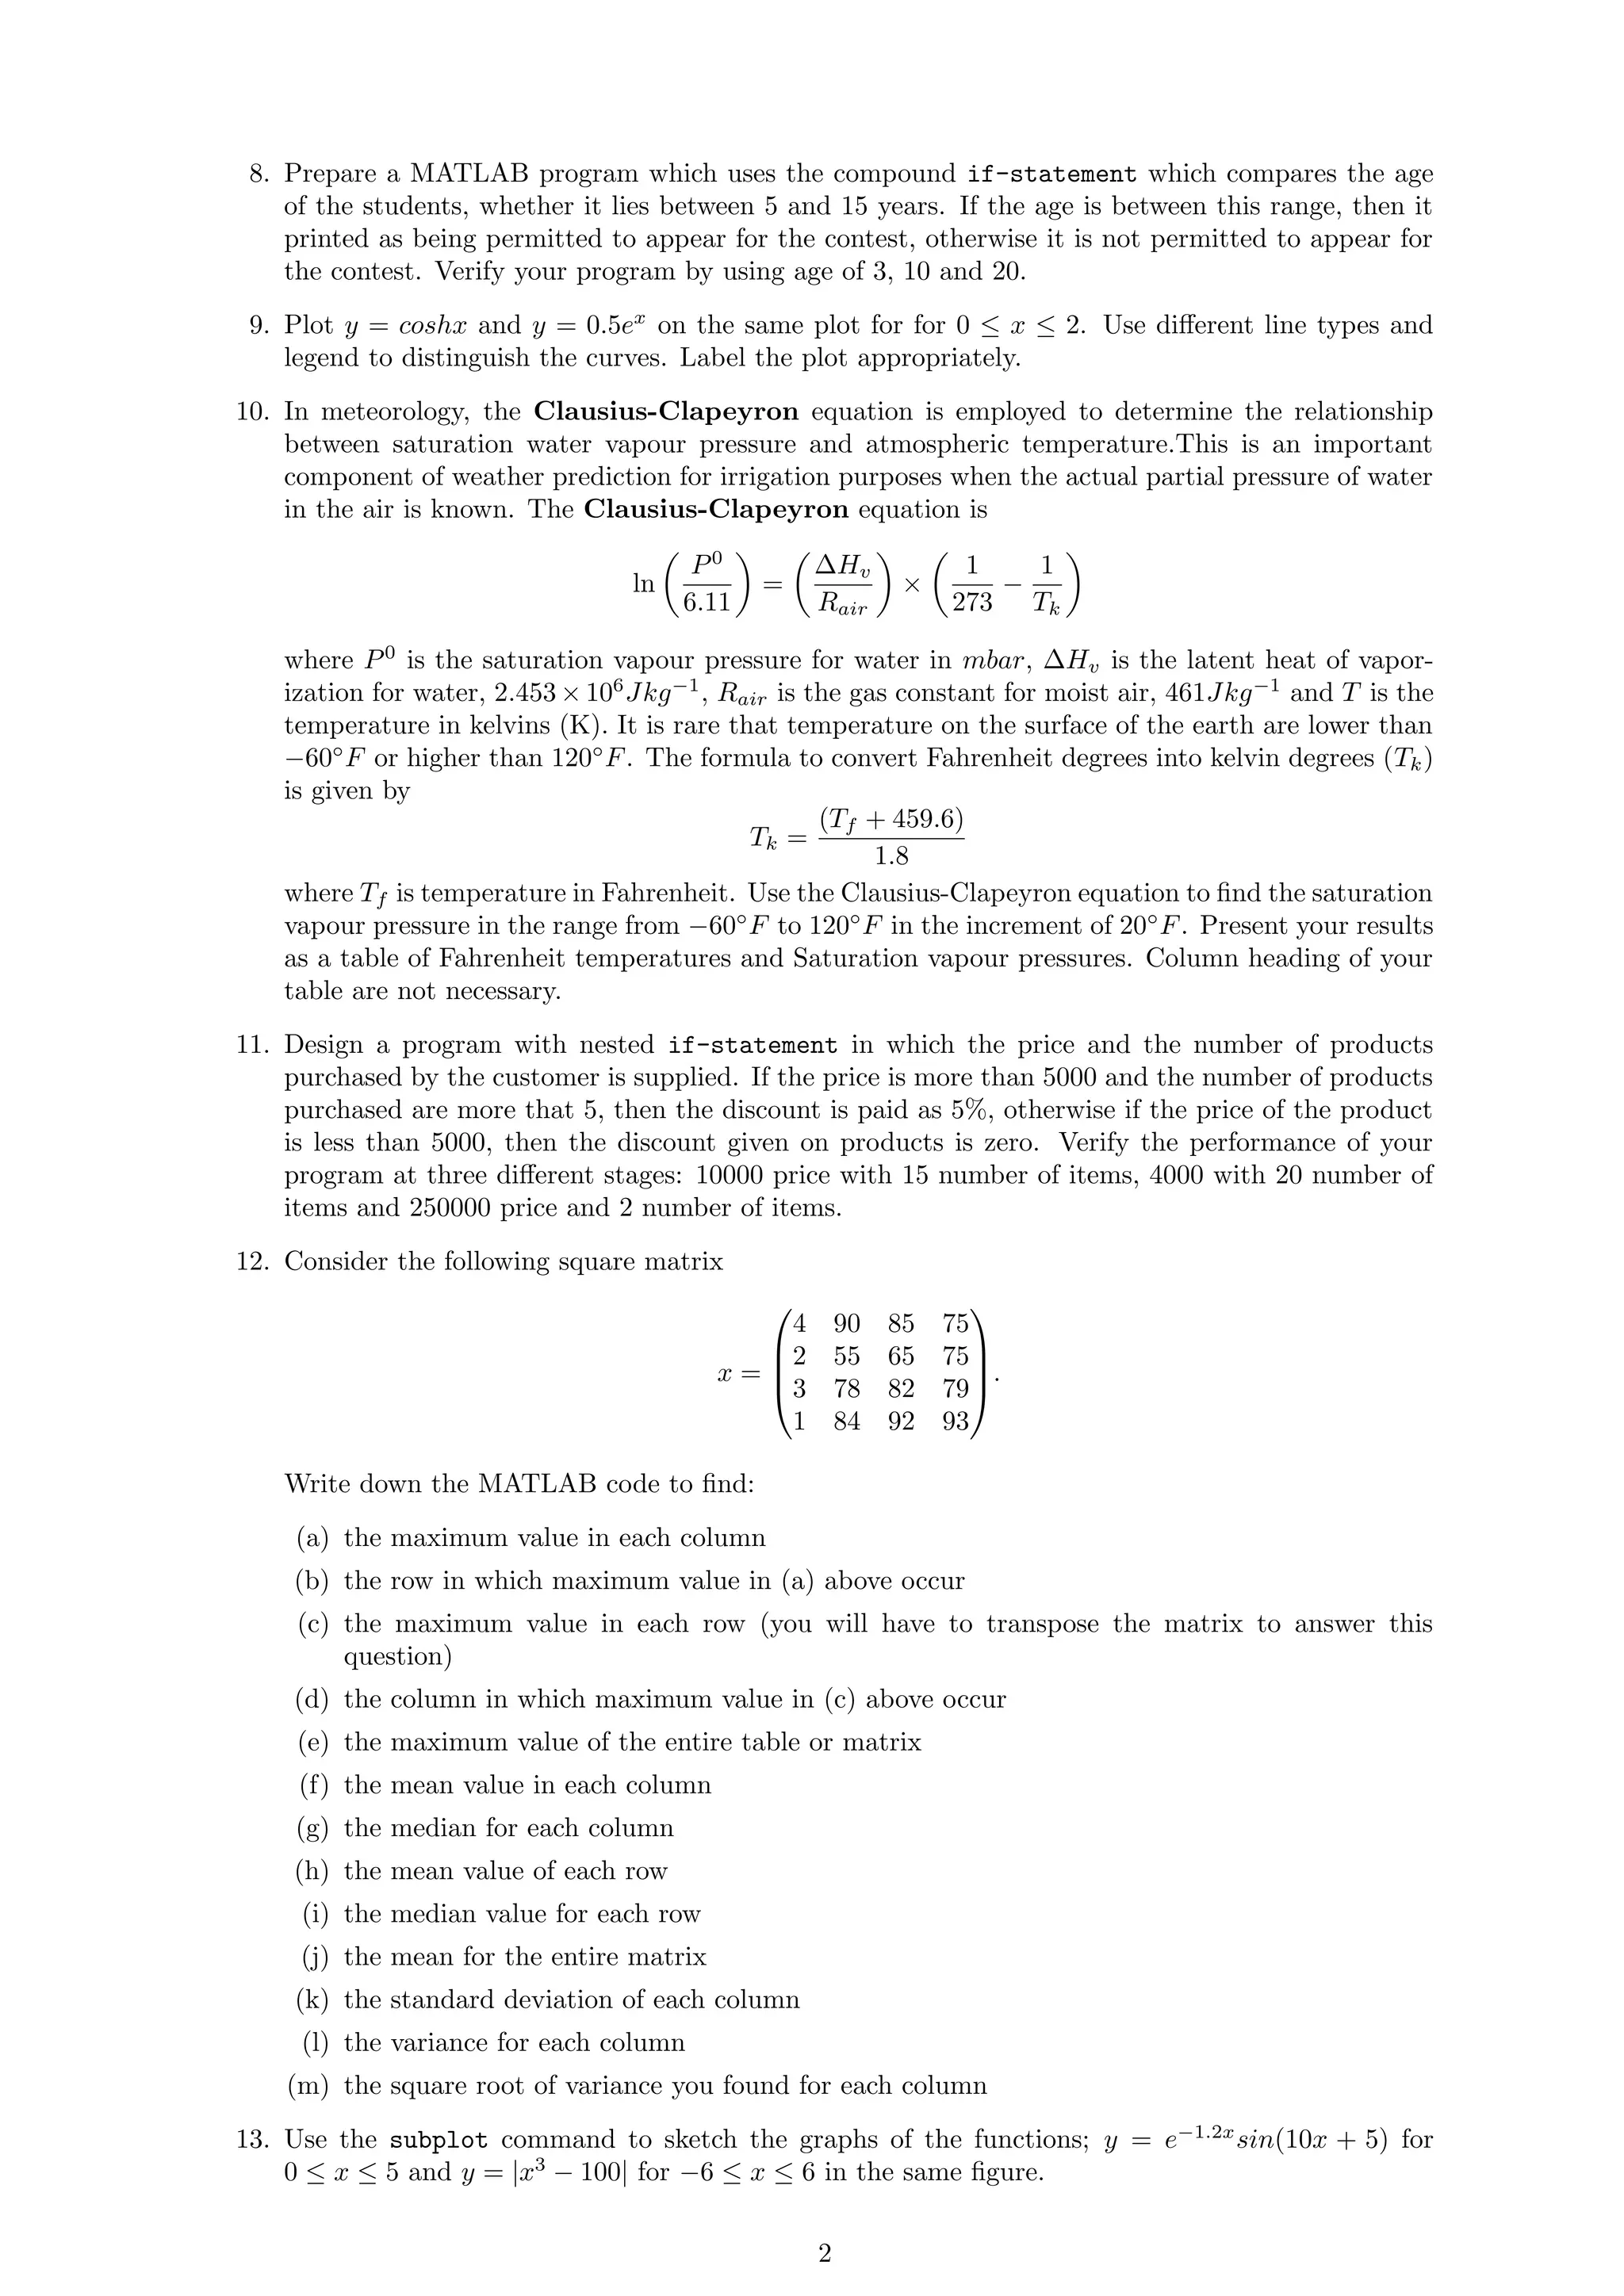
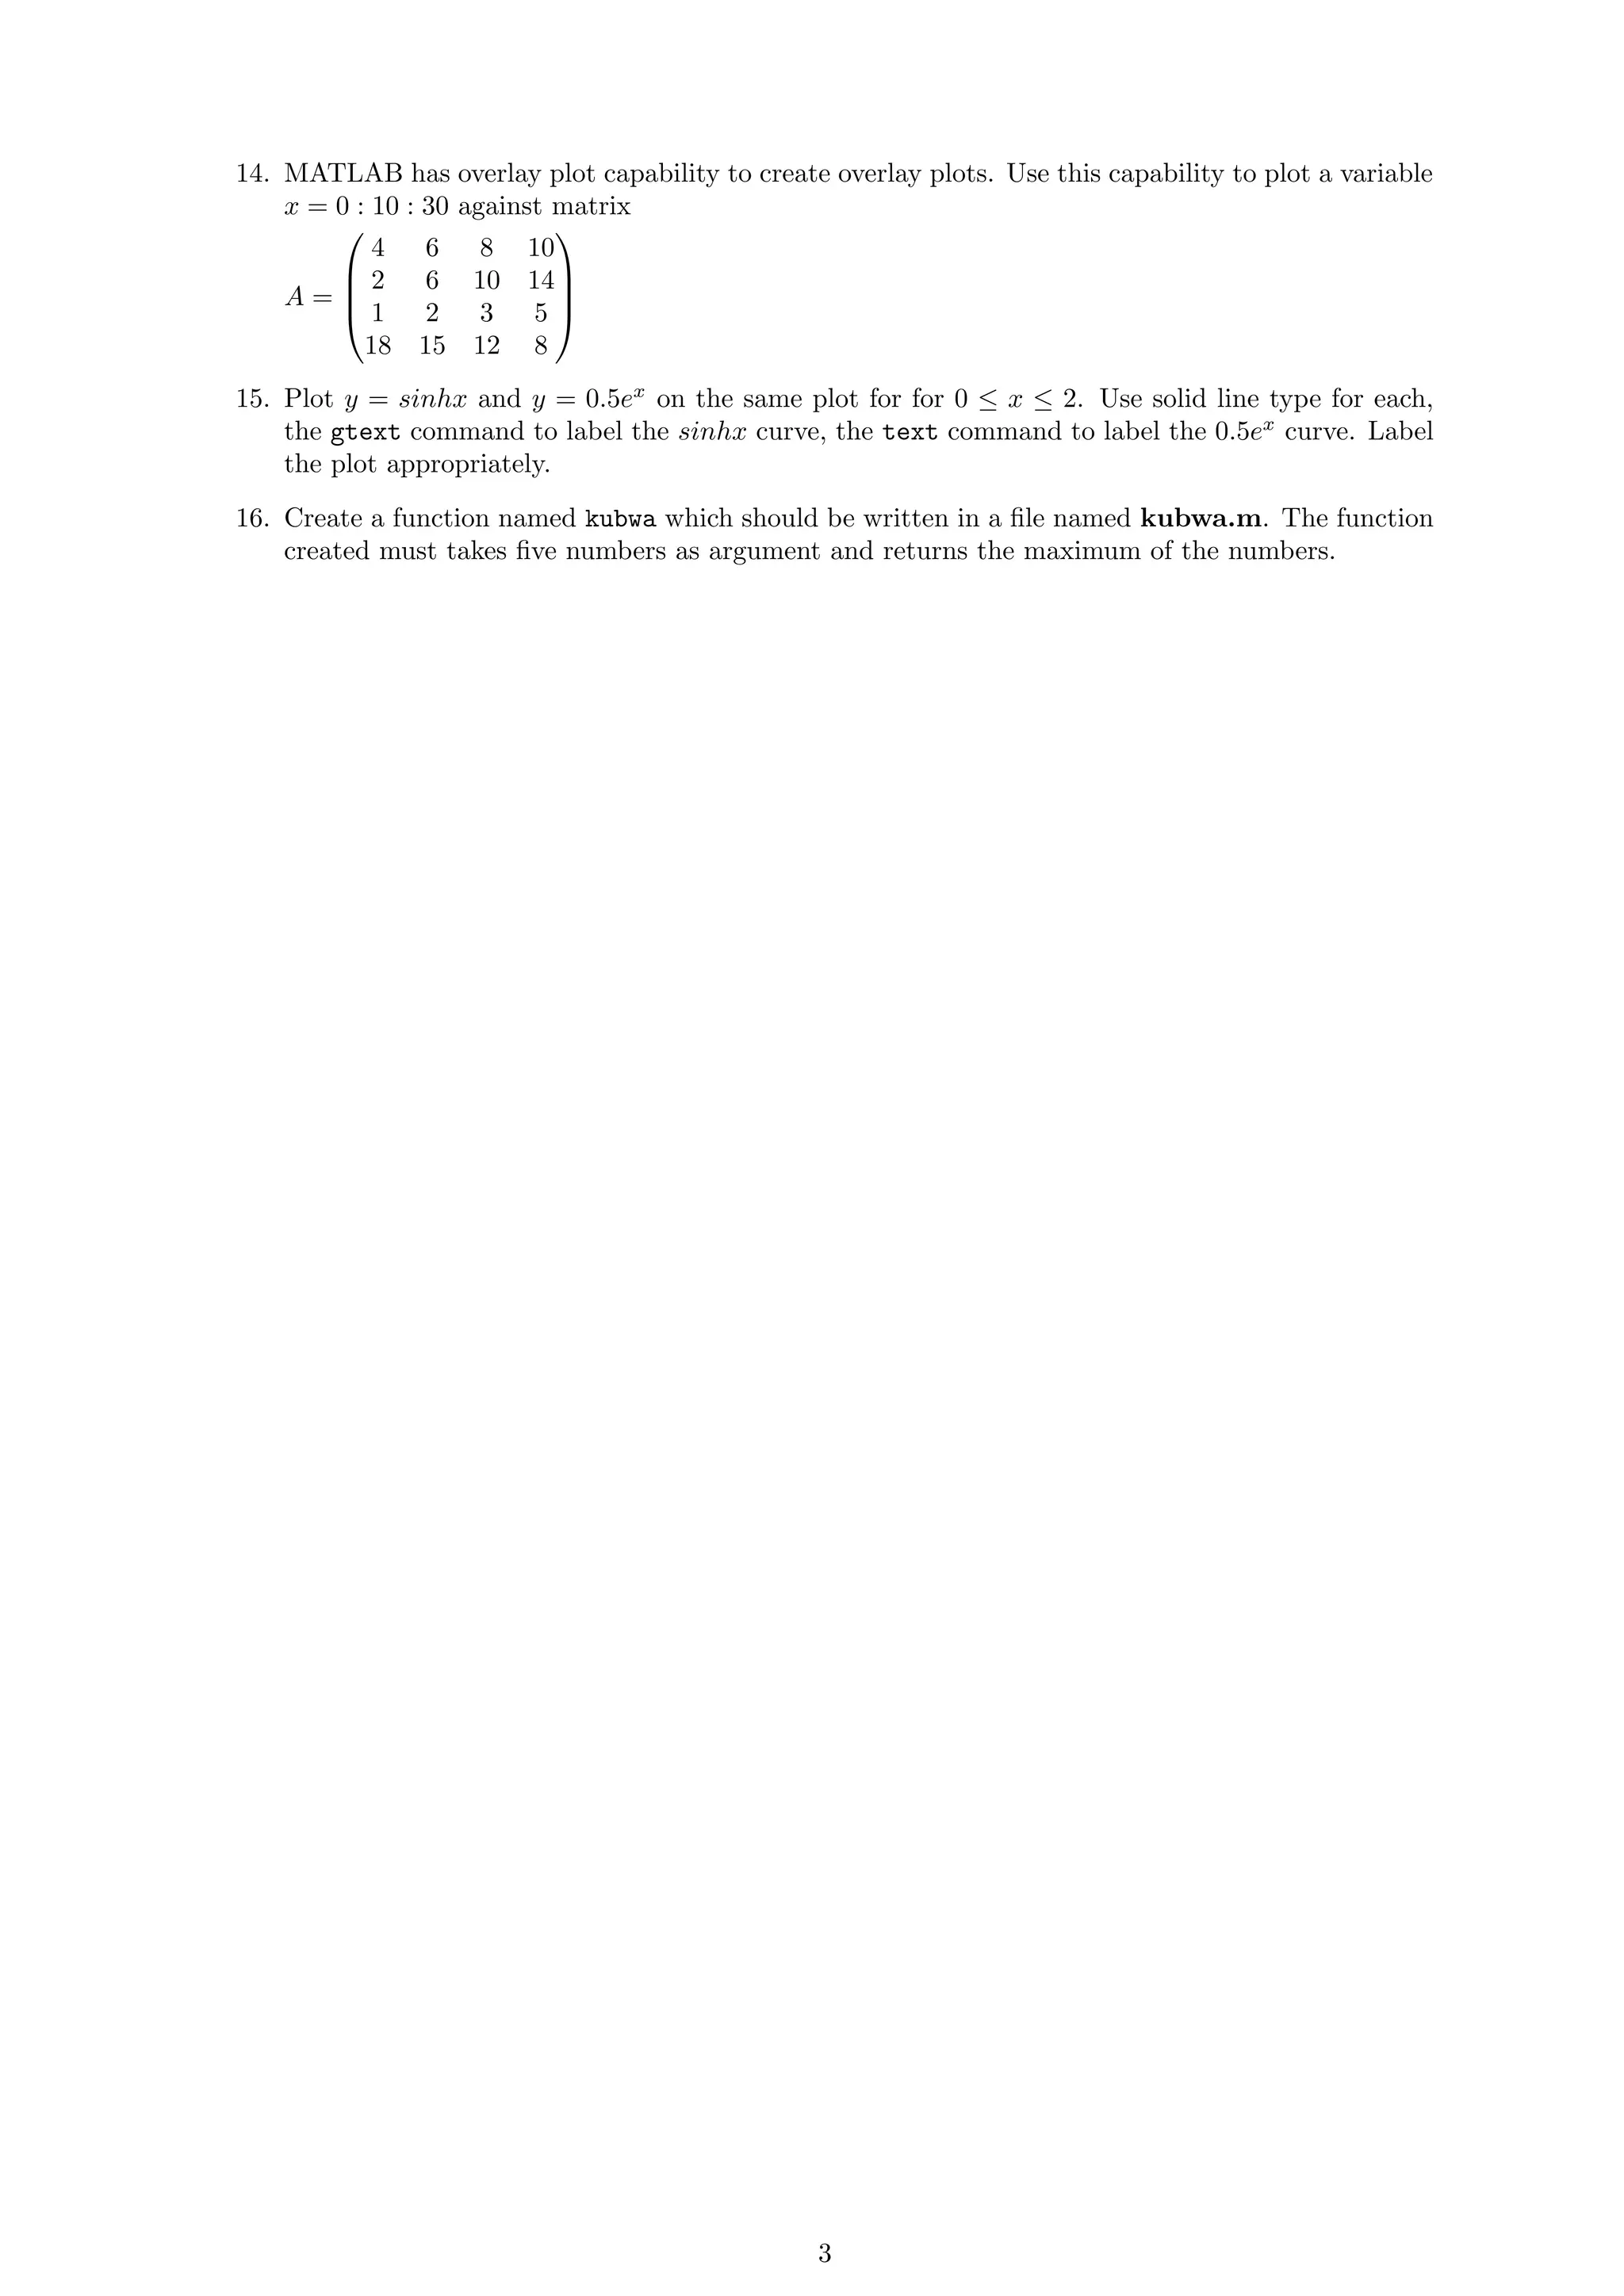
This document provides 16 MATLAB programming exercises involving calculations with matrices, plotting functions, conditional statements, and other concepts. Exercise 2 asks the student to use MATLAB relational and logical operators to find the time when a projectile's height is above 6m and speed is below 16m/s. Exercise 4 develops a program to calculate income tax amounts based on taxable income levels and tax rates. Exercise 10 uses the Clausius-Clapeyron equation to calculate saturation vapor pressure over a range of temperatures.
How to combine interpolation and regression graphs in RDougLoqa
This is a general tutorial that shows you how to take Census data, aggregate columns/rows and use interpolation lines and regression curves in your graphs. You can graph individual rows/columns or aggregate rows/columns. There is an example of graphs created here: https://www.linkedin.com/pulse/comparison-annual-income-going-back-from-2017-doug-loqa-doug-loqa/
- Markov Chain
Random movements, one follow another
- Importance sampling
To sample many points in the region where the Boltzmann factor is large and few elsewhere
- Ergodicity (ensemble average)
Such an average over all possible quantum states of a system
- Detailed Balance
Write a program that produces the first 11 rows of Pascal’s triangle. (Note: ...hwbloom49
Write a program that produces the first 11 rows of Pascal’s triangle. (Note: The numbers in the triangle have many useful mathematical properties.
For example, row n of Pascal’s triangle contains the coefficients obtained when you expand the equation (x+y)n. Your program output may be the
following: 1 1 1 1 2 1 1 3 3 1 1 4 6 4 1 1 5 10 10 5 1 1 6 15 20 15 6 1 1 7 21 35 35 21 7 1 1 8 28 56 70 56 28 8 1 1 9 36 84 126 126 84 36
9 1 1 10 45 120 210 252 210 120 45 10 1
This tutorial tries to define and describe the concept of Auto and Cross Correlation and how to calculate the coefficients. The procedure for finding the auto and cross correlation coefficients are described with examples.
Matrices and arrays are the fundamental representation of information and data in MATLAB. After completing this session, you will know about ,
1)Arrays,
2)Vectors,
3)Row vector:,
4)Row vector:,
5)ARRAY ADDRESSING,
6)SOME FUNCTIONS OF ARRAY
7)SPECIAL FUNCTIONS OF ARRAY
8)POLYNOMIAL OPERATIONS OF ARRAY
9)SOLVING LINEAR EQUATION
10)ELEMENT WISE OPERATION OF MATRIX
11)MATRIX OPERATONS
I am Simon M. I am an Environmental Engineering Assignment Expert at matlabassignmentexperts.com. I hold a Ph.D. in Environmental Engineering, Glasgow University, UK. I have been helping students with their assignments for the past 8 years. I solve assignments related to Environmental Engineering.
Visit matlabassignmentexperts.com or email info@matlabassignmentexperts.com. You can also call on +1 678 648 4277 for any assistance with Environmental Engineering Assignments.
SAMPLE QUESTIONExercise 1 Consider the functionf (x,C).docxanhlodge
SAMPLE QUESTION:
Exercise 1: Consider the function
f (x,C)=
sin(C x)
Cx
(a) Create a vector x with 100 elements from -3*pi to 3*pi. Write f as an inline or anonymous function
and generate the vectors y1 = f(x,C1), y2 = f(x,C2) and y3 = f(x,C3), where C1 = 1, C2 = 2 and
C3 = 3. Make sure you suppress the output of x and y's vectors. Plot the function f (for the three
C's above), name the axis, give a title to the plot and include a legend to identify the plots. Add a
grid to the plot.
(b) Without using inline or anonymous functions write a function+function structure m-file that does
the same job as in part (a)
SAMPLE LAB WRITEUP:
MAT 275 MATLAB LAB 1 NAME: __________________________
LAB DAY and TIME:______________
Instructor: _______________________
Exercise 1
(a)
x = linspace(-3*pi,3*pi); % generating x vector - default value for number
% of pts linspace is 100
f= @(x,C) sin(C*x)./(C*x) % C will be just a constant, no need for ".*"
C1 = 1, C2 = 2, C3 = 3 % Using commans to separate commands
y1 = f(x,C1); y2 = f(x,C2); y3 = f(x,C3); % supressing the y's
plot(x,y1,'b.-', x,y2,'ro-', x,y3,'ks-') % using different markers for
% black and white plots
xlabel('x'), ylabel('y') % labeling the axis
title('f(x,C) = sin(Cx)/(Cx)') % adding a title
legend('C = 1','C = 2','C = 3') % adding a legend
grid on
Command window output:
f =
@(x,C)sin(C*x)./(C*x)
C1 =
1
C2 =
2
C3 =
3
(b)
M-file of structure function+function
function ex1
x = linspace(-3*pi,3*pi); % generating x vector - default value for number
% of pts linspace is 100
C1 = 1, C2 = 2, C3 = 3 % Using commans to separate commands
y1 = f(x,C1); y2 = f(x,C2); y3 = f(x,C3); % function f is defined below
plot(x,y1,'b.-', x,y2,'ro-', x,y3,'ks-') % using different markers for
% black and white plots
xlabel('x'), ylabel('y') % labeling the axis
title('f(x,C) = sin(Cx)/(Cx)') % adding a title
legend('C = 1','C = 2','C = 3') % adding a legend
grid on
end
function y = f(x,C)
y = sin(C*x)./(C*x);
end
Command window output:
C1 =
1
C2 =
2
C3 =
3
More instructions for the lab write-up:
1) You are not obligated to use the 'diary' function. It was presented only for you convenience. You
should be copying and pasting your code, plots, and results into some sort of "Word" type editor that
will allow you to import graphs and such. Make sure you always include the commands to generate
what is been asked and include the outputs (from command window and plots), unless the pr.
Exposure Interval
Initial Risk Assessment (with existing planned/designed-in
countermeasures)
Hazard Target(s) Severity Probability Risk Code
[check all applicable] [worst credible] [for exposure interval] [from matrix]
Personnel
Equipment
Downtime
Environment
Product
Post-Control Measure Risk Assessment
Hazard Target(s) Severity Probability Risk Code
[check all applicable] [worst credible] [for exposure interval] [from matrix]
Personnel
Equipment
Downtime
Environment
Product
Additional Control Measures
Code Each Risk Assessment: SEVERITY:
1 – Catastrophic
2 – Critical
3 – Marginal
4 – Negligible
PROBABILITY
(Likelihood of Occurrence):
A – Frequent
B – Probable
C – Occasional
D – Remote
E – Improbable
RISK CODE:
H – High
S – Serious
M – Medium
L – Low
Comments
BOS 3651— Unit IV Hazard Analysis/Risk Analysis Project
Student Name _
Type of Hazard Date
Hazard Description
Activity
Student Name: Type of Hazard: Date: Hazard Description: Exposure Interval: Activity: worst credible: for exposure interval: from matrix: undefined: undefined_2: undefined_3: undefined_4: undefined_5: undefined_6: undefined_7: undefined_8: undefined_9: Additional Control MeasuresRow1: undefined_10: undefined_11: undefined_12: worst credible_2: for exposure interval_2: from matrix_2: undefined_13: undefined_14: undefined_15: undefined_16: undefined_17: undefined_18: undefined_19: undefined_20: undefined_21: undefined_22: undefined_23: undefined_24: CommentsRow1:
ECO 520 Case Study One: Production and Cost Guidelines and Rubric
Overview
This course includes two case studies. These exercises are designed to actively involve you in microeconomic reasoning and decision making and to help you apply the concepts covered in the course to complex real-world situations. The case studies provide practice reading and interpreting both quantitative and qualitative analysis. You will then use your analysis to make decisions and predictions. These exercises provide practice communicating reasoning in a professional manner.
Prompt
Case Study One: Production and Costfocuses on a perfectly competitive industry. Each competitive firm in this industry has a Cobb-Douglas production function: . These firms combine capital and labor to produce output. In task 3-2 you will use graphs and equations to analyze competitive firm decisions, the interaction between those decisions, and the competitive market determination of price.
Skills needed to complete this case study:
1. The ability to enter data, enter formulas, and create charts in Excel (Note: use the data provided in the Case Study One Data document.)
1. The ability to use basic algebra
To complete Case Study One, follow the steps below:
1. Use algebra to derive the cost function:
·
To solve for K as a function of q and L. Show your work, and verify that you have this solution: .
· Write the cost fu ...
M166Calculus” ProjectDue Wednesday, December 9, 2015PROJ.docxinfantsuk
M166
“Calculus” Project
Due: Wednesday, December 9, 2015
PROJECT WORTH 50 POINTS –
1) NO LATE SUBMISSIONS WILL BE ACCEPTED
2) COMPLETED PROJECTS NEED TO BE LEGIBLE
I. Computing Derivatives (slope of curve at a point) of polynomial functions.
For each of the following functions in a.-e. below perform the following three steps:
1. compute the difference quotient
2. simplify expression from part 1. such that h has been canceled from the denominator
3. substitute and simplify
a.
b.
c.
d.
e. consider , using the results from parts a. through d.,
f. find a general formula for (steps 1 through 3 performed).
II. Show that
Consider the unit circle with in standard position in QI.
a. show that the area of the right triangle (see diagram) is
b. show that the area of the sector (see diagram) is
c. show that the area of the acute triangle (see diagram)
d. set up the inequality
e. multiply the inequality in part d. by . (direction of inequalities is unchanged)
f. take the reciprocal of each term from part e. The direction of the inequality must be reversed because .
g. plug in 0 for for only. The result should be
III. Show that
a. multiply by
b. use trigonometric identity to rewrite the numerator of the expression in part a. in terms of
c. factor the expression in part b. with one factor equal to . (find remaining factor).
d. use the fact that and substitute in the second factor (result is 0)
IV. Show that derivative of
a. find the difference quotient for
(use sum angle formula )
b. factor out of the two terms in the numerator with in part a
c. split up the expression in part b with each term over the denominator h
d. use identities to simplify part c. to
Thus you have shown that if .
0
=
h
c
x
f
=
)
(
b
ax
x
f
+
=
)
(
c
bx
ax
x
f
+
+
=
2
)
(
d
cx
bx
ax
x
f
+
+
+
=
2
3
)
(
(
)
3
2
2
3
3
3
3
:
int
h
xh
h
x
x
h
x
H
+
+
+
=
+
0
1
1
1
.....
)
(
a
x
a
x
a
x
a
x
f
n
n
n
n
+
+
+
+
=
-
-
0
)
(
)
(
)
(
®
-
+
=
h
as
h
x
f
h
x
f
x
f
0
1
sin
®
=
q
q
q
as
q
2
tan
q
=
Triangle
Right
Area
2
q
=
Sector
Area
2
sin
q
=
Triangle
Acute
Area
2
sin
2
2
tan
q
q
q
³
³
q
sin
2
b
a
b
a
b
a
if
1
1
0
,
<
®
<
®
>
q
q
cos
0
1
sin
1
®
£
£
q
q
q
as
0
0
cos
1
®
=
-
q
q
q
as
q
q
cos
1
-
q
q
cos
1
cos
1
+
+
1
sin
cos
2
2
=
+
q
q
q
2
sin
q
q
sin
0
1
sin
®
=
q
q
q
as
0
=
q
q
q
cos
sin
=
h
f
h
f
f
)
(
)
(
)
(
q
q
q
-
+
=
(
)
q
q
sin
=
f
(
)
h
h
h
sin
cos
cos
sin
sin
q
q
q
+
=
+
q
sin
q
sin
0
0
cos
1
1
sin
®
=
-
=
h
as
h
h
and
h
h
q
cos
h
x
f
h
x
f
x
f
)
(
)
(
)
(
-
+
=
q
q
q
q
q
q
cos
0
)
(
)
(
)
(
,
sin
)
(
=
®
-
+
=
=
h
as
h
f
h
f
f
then
f
MATH133: Unit 3 Individual Project 2B Student Answer Form
Name (Required): ____Michael Magro_________________________
Please show all work details with answers, insert the graph, and provide answers to all the critical thinking questions on this form for the Unit 3 IP assignment.
A version of Amdah ...
ENGR 102B Microsoft Excel Proficiency LevelsPlease have your in.docxYASHU40
ENGR 102B: Microsoft Excel Proficiency Levels
Please have your instructor or TA initial each level as you complete it. If you need additional help, ask the TAs or use the help guide within Excel.
Once you master Excel Levels I through IV, you can note Excel as a skill on your resume!
Please see D2L Content for this week for your Excel Homework assignment (individual), which is due via D2L Dropbox by the due date specified in the D2L News for your section.
If you use a Mac, please be sure to submit your homework in a format that the grader and instructor can open on a PC.
Level I: Basic Functions Initials _______
1. Calculating an Average: Calculate the arithmetic average of the 5 values listed below. Enter the values in cells A2 through A6. Place a descriptive label in cell A1.
3.6, 3.8, 3.5, 3.7, 3.6
First, calculate the average the long way, by summing the values and dividing by 5:
You will enter the following formula into a blank cell to accomplish this:
=(A2+A3+A4+A5+A6)/5
Second, calculate the average using Excel’s AVERAGE( ) function by entering the following formula in a cell:
=AVERAGE(cellrange)
Replace the “cellrange” with the actual addresses in your spreadsheet of the range of cells holding the five values (i.e., for this problem, the cell range is A2:A6).
2. Determining Velocities (in kph): Some friends at the University of Calgary are coming south for spring break. Help them avoid a speeding ticket by completing a velocity conversion worksheet that calculates the conversion from mph to kph in increments of 10 from 10 to 100. A conversion factor you will need is 0.62 miles/km; you will need this factor to convert from miles/hour to km/hour. Place the conversion factor in its own cell and then reference it in your conversion calculations using absolute cell referencing (e.g., $C$2). Refer to the CBT video on Absolute and Relative Cell Referencing from the “Preparation for the Excel Workshop” assignment if you don’t remember how to do this.
Level II: Advanced Functions Initials _______
1. Projectile Motion I: (See following page for Fig. 1 Excel chart) A projectile is launched at the angle 35o from the horizontal with a velocity equal to 30 m/s. Neglecting air resistance and assuming a horizontal surface, determine how far away from the launch site the projectile will land.
To answer this problem, you will need:
1. Excel’s trigonometry functions to handle the 35o angle, and
2. Equations relating distance to velocity and acceleration
When velocity is constant, as in the horizontal motion of our particle (since we’re neglecting air resistance), the distance traveled is simply the initial horizontal velocity times the time of flight:
(Equation 1)
What keeps the projectile from flying forever is gravity. Since the gravitational acceleration is constant, the vertical distance traveled becomes
(Equation 2)
Because the projectile ends up back on the ground, the final value of y is zero (a hor ...
CHAPTER TENObjectiveA brief introduction of the basic conceptTawnaDelatorrejs
CHAPTER TEN
Objective:
A brief introduction of the basic concepts of Forecasting Tools like Moving average, Weighted Moving Average, Exponential Smoothing will be used to develop projection models.
Chapter Content:
Forecasting techniques:
Into our class we will use a simple product to manufacturer. A plush eraser will be our product (Note: Don’t blame my drawing, only look at and enjoy it.).
The first technique will be Moving Average (MA). This forecasting technique consists in the estimate of a average value from historical data that move as the new present value it’s know. This average is determinated by a series of terms or established periods (n). The quantity of periods (n) will be based in the variation that it exists between the historical data. If there is large variation, the value (n) must be greater to reflect the variation. If there is small variation, the value (n) can be smaller.
Let us suppose that the following table shown the eraser’s demand for first six months of production.
Period (Month)
Demand
1
1250
2
1590
3
1340
4
1510
5
1486
6
1440
Using the Moving Average equation:
(
)
n
i
t
A
t
MA
å
-
=
)
(
Where: MA(t) is the forecasting for period t
A(t-i) is the present for period t-i
(n) is the number of periods to average
If we looking for the forecasting for the fifth period, using n=2 and n=3, which would be the answer?
N=2
N=3
A(4) = 1510
A(4) = 1510
A(3) = 1340
A(3) = 1340
---------------
A(2) = 1590
Σ = 2850
Σ = 4440
n = 2
n = 3
MA(5) = 1425
MA(5) = 1480
The average changes of period when calculating the next forecasting. When forecast the sixth period, the terms to be used for the average change according to the following example:
N=2
N=3
A(5) = 1486
A(5) = 1486
A(4) = 1510
A(4) = 1510
---------------
A(3) = 1340
Σ = 2996
Σ = 4336
n = 2
n = 3
MA(5) = 1498
MA(5) = 1445.3
The next technique known like Weighted Moving Average, this technique to difference of regular moving average, each period have a weight assigned as output probability. The Moving average to divide the periods sum between the value (n), indirectly,
it’s giving the same probability o weight to each period to determine the forecasting.
(
)
(
)
å
-
-
=
i
t
xW
i
t
A
t
WMA
)
(
Where t is the hoped period and i value run from 1 to n.
Example, determining the sixth forecasting, with (n) = 2
Mov. Average Reg
Weighted MA
A(5) = 1486 x (50%)
A(5) = 1486 x (75%)
A(4) = 1510 x (50%)
A(4) = 1510 x (25%)
MA(6) = 1498
WMA(6) = 1492
This technique allow to assign a weight or probability according to expect behavior from marketing influences. I.e. to assign greater weight to the period value most recent a cause of a promotion. The quantity of periods or term to be used for estimate the forecast depends of the variation that exists between the historical data. That means, follow the same concept of moving average.
The third technique is the Exponential Smoothing. This forecasting technique allows a ...
MATLAB sessions: Laboratory 2
MAT 275 Laboratory 2
Matrix Computations and Programming in MATLAB
In this laboratory session we will learn how to
1. Create and manipulate matrices and vectors.
2. Write simple programs in MATLAB
NOTE: For your lab write-up, follow the instructions of LAB1.
Matrices and Linear Algebra
⋆ Matrices can be constructed in MATLAB in different ways. For example the 3 × 3 matrix
A =
8 1 63 5 7
4 9 2
can be entered as
>> A=[8,1,6;3,5,7;4,9,2]
A =
8 1 6
3 5 7
4 9 2
or
>> A=[8,1,6;
3,5,7;
4,9,2]
A =
8 1 6
3 5 7
4 9 2
or defined as the concatenation of 3 rows
>> row1=[8,1,6]; row2=[3,5,7]; row3=[4,9,2]; A=[row1;row2;row3]
A =
8 1 6
3 5 7
4 9 2
or 3 columns
>> col1=[8;3;4]; col2=[1;5;9]; col3=[6;7;2]; A=[col1,col2,col3]
A =
8 1 6
3 5 7
4 9 2
Note the use of , and ;. Concatenated rows/columns must have the same length. Larger matrices can
be created from smaller ones in the same way:
c⃝2011 Stefania Tracogna, SoMSS, ASU
MATLAB sessions: Laboratory 2
>> C=[A,A] % Same as C=[A A]
C =
8 1 6 8 1 6
3 5 7 3 5 7
4 9 2 4 9 2
The matrix C has dimension 3 × 6 (“3 by 6”). On the other hand smaller matrices (submatrices) can
be extracted from any given matrix:
>> A(2,3) % coefficient of A in 2nd row, 3rd column
ans =
7
>> A(1,:) % 1st row of A
ans =
8 1 6
>> A(:,3) % 3rd column of A
ans =
6
7
2
>> A([1,3],[2,3]) % keep coefficients in rows 1 & 3 and columns 2 & 3
ans =
1 6
9 2
⋆ Some matrices are already predefined in MATLAB:
>> I=eye(3) % the Identity matrix
I =
1 0 0
0 1 0
0 0 1
>> magic(3)
ans =
8 1 6
3 5 7
4 9 2
(what is magic about this matrix?)
⋆ Matrices can be manipulated very easily in MATLAB (unlike Maple). Here are sample commands
to exercise with:
>> A=magic(3);
>> B=A’ % transpose of A, i.e, rows of B are columns of A
B =
8 3 4
1 5 9
6 7 2
>> A+B % sum of A and B
ans =
16 4 10
4 10 16
10 16 4
>> A*B % standard linear algebra matrix multiplication
ans =
101 71 53
c⃝2011 Stefania Tracogna, SoMSS, ASU
MATLAB sessions: Laboratory 2
71 83 71
53 71 101
>> A.*B % coefficient-wise multiplication
ans =
64 3 24
3 25 63
24 63 4
⋆ One MATLAB command is especially relevant when studying the solution of linear systems of dif-
ferentials equations: x=A\b determines the solution x = A−1b of the linear system Ax = b. Here is an
example:
>> A=magic(3);
>> z=[1,2,3]’ % same as z=[1;2;3]
z =
1
2
3
>> b=A*z
b =
28
34
28
>> x = A\b % solve the system Ax = b. Compare with the exact solution, z, defined above.
x =
1
2
3
>> y =inv(A)*b % solve the system using the inverse: less efficient and accurate
ans =
1.0000
2.0000
3.0000
Now let’s check for accuracy by evaluating the difference z − x and z − y. In exact arithmetic they
should both be zero since x, y and z all represent the solution to the system.
>> z - x % error for backslash command
ans =
0
0
0
>> z - y % error for inverse
ans =
1.0e-015 *
-0.4441
0
-0.88 ...
Name ____________________________Student Number ________________.docxTanaMaeskm
Name: ____________________________
Student Number: ___________________
Short Answer:
Type your answer below each question. Show your work.
1
Verify the identity.
Show your work.
cot θ ∙ sec θ = csc θ
2
A gas company has the following rate schedule for natural gas usage in single-family residences:
Monthly service charge $8.80
Per therm service charge
1st 25 therms $0.6686/therm
Over 25 therms $0.85870/therm
What is the charge for using 25 therms in one month? Show your work.
What is the charge for using 45 therms in one month? Show your work.
Construct a function that gives the monthly charge C for x therms of gas.
3
The wind chill factor represents the equivalent air temperature at a standard wind speed that would produce the same heat loss as the given temperature and wind speed. One formula for computing the equivalent temperature is
W(t) =
where v represents the wind speed (in meters per second) and t represents the air temperature . Compute the wind chill for an air temperature of 15°C and a wind speed of 12 meters per second. (Round the answer to one decimal place.) Show your work.
4
Complete the following:
(a) Use the Leading Coefficient Test to determine the graph's end behavior.
(b) Find the x-intercepts. State whether the graph crosses the x-axis or touches the x-axis and turns around at each intercept.
Show your work.
(c) Find the y-intercept.
Show your work.
f(x) = x
2
(x + 2)
(a).
(b).
(c).
5
For the data set shown by the table,
a. Create a scatter plot for the data. (You do not need to submit the scatter plot)
b. Use the scatter plot to determine whether an exponential function or a logarithmic function is the best choice for modeling the data.
Number of Homes Built in a Town by Year
6
Verify the identity. Show your work.
(1 + tan
2
u)(1 - sin
2
u) = 1
7
Verify the identity
. Show your work.
cot
2
x + csc
2
x = 2csc
2
x - 1
8
Verify the identity. Show your work.
1 + sec
2
xsin
2
x = sec
2
x
9
Verify the identity.
Show your work.
cos(α - β) - cos(α + β) = 2 sin α sin β
10
The following data represents the normal monthly precipitation for a certain city.
Draw a scatter diagram of the data for one period. (You do not need to submit the scatter diagram). Find the sinusoidal function of the form that fits the data. Show your work.
.
11.
The graph below shows the percentage of students enrolled in the College of Engineering at State University. Use the graph to answer the question.
Does the graph represent a function? Explain
12.
Find the vertical asymptotes, if any, of the graph of the rational function. Show your work.
f(x) =
13.
The formula A = 118e
0.024t
models the popula.
Pre-Calculus Midterm Exam
Score: ______ / ______
Name: ____________________________
Student Number: ___________________
Short Answer: Type your answer below each question. Show your work.
1
Verify the identity. Show your work.
cot θ ∙ sec θ = csc θ
2
A gas company has the following rate schedule for natural gas usage in single-family residences:
Monthly service charge $8.80
Per therm service charge
1st 25 therms $0.6686/therm
Over 25 therms $0.85870/therm
What is the charge for using 25 therms in one month? Show your work.
What is the charge for using 45 therms in one month? Show your work.
Construct a function that gives the monthly charge C for x therms of gas.
3
The wind chill factor represents the equivalent air temperature at a standard wind speed that would produce the same heat loss as the given temperature and wind speed. One formula for computing the equivalent temperature is
W(t) =
where v represents the wind speed (in meters per second) and t represents the air temperature . Compute the wind chill for an air temperature of 15°C and a wind speed of 12 meters per second. (Round the answer to one decimal place.) Show your work.
4
Complete the following:
(a) Use the Leading Coefficient Test to determine the graph's end behavior.
(b) Find the x-intercepts. State whether the graph crosses the x-axis or touches the x-axis and turns around at each intercept. Show your work.
(c) Find the y-intercept. Show your work.
f(x) = x2(x + 2)
(a).
(b).
(c).
5
For the data set shown by the table,
a. Create a scatter plot for the data. (You do not need to submit the scatter plot)
b. Use the scatter plot to determine whether an exponential function or a logarithmic function is the best choice for modeling the data.
Number of Homes Built in a Town by Year
6
Verify the identity. Show your work.
(1 + tan2u)(1 - sin2u) = 1
7
Verify the identity. Show your work.
cot2x + csc2x = 2csc2x - 1
8
Verify the identity. Show your work.
1 + sec2xsin2x = sec2x
9
Verify the identity. Show your work.
cos(α - β) - cos(α + β) = 2 sin α sin β
10
The following data represents the normal monthly precipitation for a certain city.
Draw a scatter diagram of the data for one period. (You do not need to submit the scatter diagram). Find the sinusoidal function of the form that fits the data. Show your work.
.
11.
The graph below shows the percentage of students enrolled in the College of Engineering at State University. Use the graph to answer the question.
Does the graph represent a function? Explain
12.
Find the vertical asymptotes, if any, of the graph of the rational function. Show your work.
f(x) =
13.
T.
ECO 520 Case Study One Production and Cost Guidelines and Rubric.docxjack60216
ECO 520 Case Study One: Production and Cost Guidelines and Rubric
Overview
This course includes two case studies. These exercises are designed to actively involve you in microeconomic reasoning and decision making and to help you apply the concepts covered in the course to complex real-world situations. The case studies provide practice reading and interpreting both quantitative and qualitative analysis. You will then use your analysis to make decisions and predictions. These exercises provide practice communicating reasoning in a professional manner.
Prompt
Case Study One: Production and Costfocuses on a perfectly competitive industry. Each competitive firm in this industry has a Cobb-Douglas production function:
5
.
0
5
.
0
02
.
0
L
K
q
=
. These firms combine capital and labor to produce output. In task 3-2 you will use graphs and equations to analyze competitive firm decisions, the interaction between those decisions, and the competitive market determination of price.
Skills needed to complete this case study:
1. The ability to enter data, enter formulas, and create charts in Excel (Note: use the data provided in the Case Study One Data document.)
2. The ability to use basic algebra
To complete Case Study One, follow the steps below:
1. Use algebra to derive the cost function:
· To solve for K as a function of q and L. Show your work, and verify that you have this solution:
L
q
K
2
2
02
.
0
=
.
· Write the cost function. Cost is equal to the sum of the expenditures to purchase capital plus the expenditures to purchase labor. Each of these expenditures is equal to the price of the input multiplied by the quantity of the input. Use the letter r to denote the price of capital and w to denote the price of labor.
2. Use Excel to create and graph isoquant curves:
· Use column A to store possible values for L. Use the first row to label the column. Put a zero (use the number 0) in the second row. Put the formula =a2+5 in the third row. Copy this formula in rows 4-25.
· Use column B to store the quantity of K that is needed to combine with each possible value of L to produce 5 units. Use the equation from Step 1, with q = 5.
· Use column C to store the quantity of K that is needed to combine with each possible value of L to produce 10 units. Use the equation from Step 1, with q = 10.
· Use column D to store the quantity of K that is needed to combine with each possible value of L to produce 15 units. Use the equation from Step 1, with q = 15.
· Use scatter-plot to graph the isoquants. Print the graph, and use this graph to complete the following table:
Q
quantity of L that must be combined with K=5000 to produce each quantity of output (q)
5
10
15
3. Consider the short run situation in which K is fixed at 5000. Assume r = .05 and w = 40. Open a new Excel worksheet for cost information. Note the difference between your production worksheet, in which the first column stored possible values of L, and this new cost worksheet in ...
ECO 520 Case Study One Production and Cost Guidelines and Rubri.docxjack60216
ECO 520 Case Study One: Production and Cost Guidelines and Rubric
Overview
This course includes two case studies. These exercises are designed to actively involve you in microeconomic reasoning and decision making and to help you apply the concepts covered in the course to complex real-world situations. The case studies provide practice reading and interpreting both quantitative and qualitative analysis. You will then use your analysis to make decisions and predictions. These exercises provide practice communicating reasoning in a professional manner.
Prompt
Case Study One: Production and Costfocuses on a perfectly competitive industry. Each competitive firm in this industry has a Cobb-Douglas production function:
5
.
0
5
.
0
02
.
0
L
K
q
=
. These firms combine capital and labor to produce output. In task 3-2 you will use graphs and equations to analyze competitive firm decisions, the interaction between those decisions, and the competitive market determination of price.
Skills needed to complete this case study:
1. The ability to enter data, enter formulas, and create charts in Excel (Note: use the data provided in the Case Study One Data document.)
2. The ability to use basic algebra
To complete Case Study One, follow the steps below:
1. Use algebra to derive the cost function:
· To solve for K as a function of q and L. Show your work, and verify that you have this solution:
L
q
K
2
2
02
.
0
=
.
· Write the cost function. Cost is equal to the sum of the expenditures to purchase capital plus the expenditures to purchase labor. Each of these expenditures is equal to the price of the input multiplied by the quantity of the input. Use the letter r to denote the price of capital and w to denote the price of labor.
2. Use Excel to create and graph isoquant curves:
· Use column A to store possible values for L. Use the first row to label the column. Put a zero (use the number 0) in the second row. Put the formula =a2+5 in the third row. Copy this formula in rows 4-25.
· Use column B to store the quantity of K that is needed to combine with each possible value of L to produce 5 units. Use the equation from Step 1, with q = 5.
· Use column C to store the quantity of K that is needed to combine with each possible value of L to produce 10 units. Use the equation from Step 1, with q = 10.
· Use column D to store the quantity of K that is needed to combine with each possible value of L to produce 15 units. Use the equation from Step 1, with q = 15.
· Use scatter-plot to graph the isoquants. Print the graph, and use this graph to complete the following table:
Q
quantity of L that must be combined with K=5000 to produce each quantity of output (q)
5
10
15
3. Consider the short run situation in which K is fixed at 5000. Assume r = .05 and w = 40. Open a new Excel worksheet for cost information. Note the difference between your production worksheet, in which the first column stored possible values of L, and this new cost worksheet in ...
2024.06.01 Introducing a competency framework for languag learning materials ...Sandy Millin
http://sandymillin.wordpress.com/iateflwebinar2024
Published classroom materials form the basis of syllabuses, drive teacher professional development, and have a potentially huge influence on learners, teachers and education systems. All teachers also create their own materials, whether a few sentences on a blackboard, a highly-structured fully-realised online course, or anything in between. Despite this, the knowledge and skills needed to create effective language learning materials are rarely part of teacher training, and are mostly learnt by trial and error.
Knowledge and skills frameworks, generally called competency frameworks, for ELT teachers, trainers and managers have existed for a few years now. However, until I created one for my MA dissertation, there wasn’t one drawing together what we need to know and do to be able to effectively produce language learning materials.
This webinar will introduce you to my framework, highlighting the key competencies I identified from my research. It will also show how anybody involved in language teaching (any language, not just English!), teacher training, managing schools or developing language learning materials can benefit from using the framework.
Acetabularia Information For Class 9 .docxvaibhavrinwa19
Acetabularia acetabulum is a single-celled green alga that in its vegetative state is morphologically differentiated into a basal rhizoid and an axially elongated stalk, which bears whorls of branching hairs. The single diploid nucleus resides in the rhizoid.
Synthetic Fiber Construction in lab .pptxPavel ( NSTU)
Synthetic fiber production is a fascinating and complex field that blends chemistry, engineering, and environmental science. By understanding these aspects, students can gain a comprehensive view of synthetic fiber production, its impact on society and the environment, and the potential for future innovations. Synthetic fibers play a crucial role in modern society, impacting various aspects of daily life, industry, and the environment. ynthetic fibers are integral to modern life, offering a range of benefits from cost-effectiveness and versatility to innovative applications and performance characteristics. While they pose environmental challenges, ongoing research and development aim to create more sustainable and eco-friendly alternatives. Understanding the importance of synthetic fibers helps in appreciating their role in the economy, industry, and daily life, while also emphasizing the need for sustainable practices and innovation.
Read| The latest issue of The Challenger is here! We are thrilled to announce that our school paper has qualified for the NATIONAL SCHOOLS PRESS CONFERENCE (NSPC) 2024. Thank you for your unwavering support and trust. Dive into the stories that made us stand out!
Francesca Gottschalk - How can education support child empowerment.pptxEduSkills OECD
Francesca Gottschalk from the OECD’s Centre for Educational Research and Innovation presents at the Ask an Expert Webinar: How can education support child empowerment?
Biological screening of herbal drugs: Introduction and Need for
Phyto-Pharmacological Screening, New Strategies for evaluating
Natural Products, In vitro evaluation techniques for Antioxidants, Antimicrobial and Anticancer drugs. In vivo evaluation techniques
for Anti-inflammatory, Antiulcer, Anticancer, Wound healing, Antidiabetic, Hepatoprotective, Cardio protective, Diuretics and
Antifertility, Toxicity studies as per OECD guidelines
Operation “Blue Star” is the only event in the history of Independent India where the state went into war with its own people. Even after about 40 years it is not clear if it was culmination of states anger over people of the region, a political game of power or start of dictatorial chapter in the democratic setup.
The people of Punjab felt alienated from main stream due to denial of their just demands during a long democratic struggle since independence. As it happen all over the word, it led to militant struggle with great loss of lives of military, police and civilian personnel. Killing of Indira Gandhi and massacre of innocent Sikhs in Delhi and other India cities was also associated with this movement.
Introduction to AI for Nonprofits with Tapp NetworkTechSoup
Dive into the world of AI! Experts Jon Hill and Tareq Monaur will guide you through AI's role in enhancing nonprofit websites and basic marketing strategies, making it easy to understand and apply.
1. GSU 07201 TUTORIAL SHEET
General Studies Department-Computing Using Mathematical Software Module 1
1. Write a program that calculates Fabonacii series in which every number is generated by sum of
two previous terms. For example:
1 2 3 5 8 13 21 · · · n
2. The height and speed of a projectile (such as thrown ball) launches with speed v0 at an angle A
to the horizontal are given by
h(t) = v0tsinA − 0.5gt2
v(t) = v2
0 − 2v0gtsinA + g2t2
where g is the acceration due to gravity. The projectile will strike the groung when h(t) = 0, which
gives the time to hit, thit =
2v0sinA
g
. Suppose that A = 40◦
, v0 = 20ms−1
and g = 9.81ms−2
.
Use the MATLAB relational and logical operators to find the time when the height is not less
that 6m and the speed is simultaneously not greater than 16ms−1
. Note that graphical method
would be used but the accurate of the results would be limited with the ability to pick points off
the graph and it is time consuming.
3.
4. It has been said that there are two unpleasant and unavoidable facts of life in any country;
death and income tax. A very simplified version of how income tax is calculated in one of the
Africans’country is based on the following table:
Taxable income Tax payable
$10000 or less 10% of taxable income
Between $10000 and $20000 $1000+20% of amount by which taxable income exceeds $10000
More than $20000 $3000+50% of amount by which taxable income exceeds $20000
For example, the tax payable on a taxable income of $30000 is given by
$3000 + 50% of ($30000 − $20000) = $8000.
Develop a MATLAB program using loop with an elseif to calculate the income tax on the
following taxable income in dollars: 5000,15000,30000 and 50000.
5. By using if-elseif-else statement write a program to check whether a given number is greater
than or equal to 50. Test your program with numbers 23, 50 and 98.
6. Plot a bar graph to show the comparison of average temperature in the cities A, B and C for the
months from September to February of the data given in the table below:
Month City A City B City C
September 31 28 24
October 29 26 22
November 28 25 20
December 27 24 16
January 26 22 17
February 29 25 20
Label the x-axis as Months from September to February and the y-axis as Temperature in Celsius,
include the legend for cities and the title of your graph should read as Temperature of city A, B
and C for Months from September to February. Copy the codes and the graph displayed into your
answer booklet.
7. Develop a program which determines whether the given number is even or odd. The criteria
used in this programme is that the number is divided by 2 and remainder is calculated. If the
remainder is found to be equal to zero, then the number is even, otherwise the number is said to
be odd. Test your program by using 39, 2910 and 8455.
1Mbitila A.S.(Module tutor)
1
2. 8. Prepare a MATLAB program which uses the compound if-statement which compares the age
of the students, whether it lies between 5 and 15 years. If the age is between this range, then it
printed as being permitted to appear for the contest, otherwise it is not permitted to appear for
the contest. Verify your program by using age of 3, 10 and 20.
9. Plot y = coshx and y = 0.5ex
on the same plot for for 0 ≤ x ≤ 2. Use different line types and
legend to distinguish the curves. Label the plot appropriately.
10. In meteorology, the Clausius-Clapeyron equation is employed to determine the relationship
between saturation water vapour pressure and atmospheric temperature.This is an important
component of weather prediction for irrigation purposes when the actual partial pressure of water
in the air is known. The Clausius-Clapeyron equation is
ln
P0
6.11
=
∆Hv
Rair
×
1
273
−
1
Tk
where P0
is the saturation vapour pressure for water in mbar, ∆Hv is the latent heat of vapor-
ization for water, 2.453 × 10⁶
Jkg−1
, Rair is the gas constant for moist air, 461Jkg−1
and T is the
temperature in kelvins (K). It is rare that temperature on the surface of the earth are lower than
−60◦
F or higher than 120◦
F. The formula to convert Fahrenheit degrees into kelvin degrees (Tk)
is given by
Tk =
(Tf + 459.6)
1.8
where Tf is temperature in Fahrenheit. Use the Clausius-Clapeyron equation to find the saturation
vapour pressure in the range from −60◦
F to 120◦
F in the increment of 20◦
F. Present your results
as a table of Fahrenheit temperatures and Saturation vapour pressures. Column heading of your
table are not necessary.
11. Design a program with nested if-statement in which the price and the number of products
purchased by the customer is supplied. If the price is more than 5000 and the number of products
purchased are more that 5, then the discount is paid as 5%, otherwise if the price of the product
is less than 5000, then the discount given on products is zero. Verify the performance of your
program at three different stages: 10000 price with 15 number of items, 4000 with 20 number of
items and 250000 price and 2 number of items.
12. Consider the following square matrix
x =
4 90 85 75
2 55 65 75
3 78 82 79
1 84 92 93
.
Write down the MATLAB code to find:
(a) the maximum value in each column
(b) the row in which maximum value in (a) above occur
(c) the maximum value in each row (you will have to transpose the matrix to answer this
question)
(d) the column in which maximum value in (c) above occur
(e) the maximum value of the entire table or matrix
(f) the mean value in each column
(g) the median for each column
(h) the mean value of each row
(i) the median value for each row
(j) the mean for the entire matrix
(k) the standard deviation of each column
(l) the variance for each column
(m) the square root of variance you found for each column
13. Use the subplot command to sketch the graphs of the functions; y = e−1.2x
sin(10x + 5) for
0 ≤ x ≤ 5 and y = |x3
− 100| for −6 ≤ x ≤ 6 in the same figure.
2
3. 14. MATLAB has overlay plot capability to create overlay plots. Use this capability to plot a variable
x = 0 : 10 : 30 against matrix
A =
4 6 8 10
2 6 10 14
1 2 3 5
18 15 12 8
15. Plot y = sinhx and y = 0.5ex
on the same plot for for 0 ≤ x ≤ 2. Use solid line type for each,
the gtext command to label the sinhx curve, the text command to label the 0.5ex
curve. Label
the plot appropriately.
16. Create a function named kubwa which should be written in a file named kubwa.m. The function
created must takes five numbers as argument and returns the maximum of the numbers.
3